One of the great features in CodeWarrior for MCU10.x is the ability to read memory/variables while running (see “Live View for Variables and Memory“). This technology of ‘live view’ is based on the CodeWarrior debugger engine. How can I do something like this with stock GDB and Eclipse? What I need is a periodic update of variables/expressions/memory while the program on the board is running, without the need to stop the board with the debugger first:
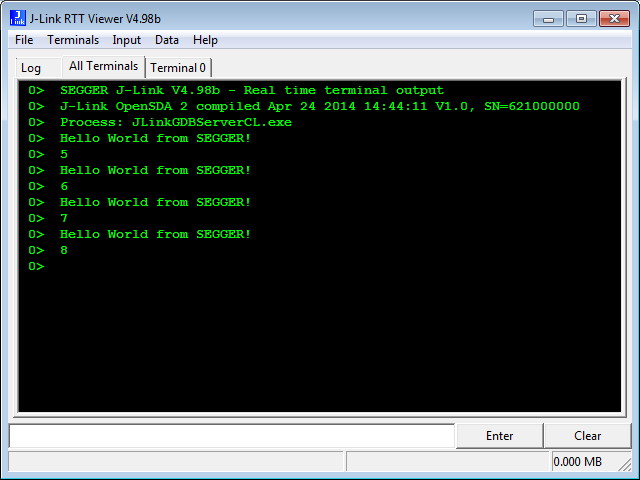
Category Archives: Eclipse
FreeRTOS Continuous Trace Streaming
Key to successfully implementing embedded applications these days is to have detailed visibility into what is going on with the application on the board. For this, I’m using the FreeRTOS+Trace from Percepio to inspect the runtime behaviour. Stop-Mode debugging is very useful, but visibility into the runtime is even more important. FreeRTOS+Trace is a tool to accomplish this, but it requires to dump the data off the target to the host (see “Updated Percepio Tracealyzer and Trace Library to Version V2.7.0“). Usually, I’m using the GDB debugger for this, and that works for shorter trace sequences like a few seconds. Yes, I can combine them, but it painful to stop, dump and continue. So what if I could collect trace for several minutes or hours without the need to stop the application? Why not stream the data to the host directly?
So here is it: I’m now able to get almost unlimited trace streaming off the target, witout user intervention. I can trace my application for hours 🙂
Tutorial: Using Processor Expert and FreeRTOS with Kinetis SDK V1.2
Freescale has released the new Kinetis SDK v1.2 back in May. Because of the changes in v1.2, previous applications (or my tutorials) do not work any more :-(. So time to write a new tutorial: how I can use Processor Expert with FreeRTOS for the Kinetis SDK v1.2.
Getting started with Kinetis FRDM- K64F: New and Better!! :)
Hello all!
Here is my second blog about the Kinetis MCU development boards, introducing you to the new and more informative Getting Started process for Kinetis FRDM-K64F from Freescale. As a part of my internship I got the amazing opportunity to play with the ‘New Getting Started’ process and the most recent box of the FRDM-K64F development board from Freescale.
Freescale have been working all along to make the life of its customers easier. So, at the FTF 2015 we launched the new website:
http://www.freescale.com/webapp/sps/site/prod_summary.jsp?code=FRDM-K64F&tab=In-Depth_Tab
This website is for the new Getting started process for FRDM K-64F. This website will tell you all that you will need to start the FRDM K-64F development board. Continue reading
Using Segger Real Time Terminal (RTT) with Eclipse
I have used semihosting more and more in my projects. However, there are several disadvantage of using it:
- Without special handlers, it only works with an active debug connection going on. Without a debugger attached, the application blocks otherwise.
- Because it needs debugger interactions, it is rather slow (only several hundreds of bytes per second)
The good news is that Segger supports with their debug probes a faster approach with what they name Real Time Terminal (RTT). And it even runs without a debugger attached to the board: all what I need is a Segger J-Link probe (or Segger J-Link OpenSDA) plus a telnet client.
Processor Expert Component Repositories
Processor Expert for Kinetis v3.0.0 (which is part of Freescale Kinetis Design Studio v3.0.0, KDS) has now the concept of ‘repositories’ for the components.
Previously, Processor Expert was able to use two paths for its components (e.g. in KDS v2.0.0):
- The ‘System‘ directory inside the Eclipse installation
- The ‘User‘ directory: a fixed path, global for all installations
These directories are listed in the workspace settings (menu Window > Preferences > Processor Expert > Paths):
McuOnEclipse Components: 05-July-2015 Release
I know: A new McuOnEclipse Processor Expert components release was long overdue. But I have been extremely busy in the last months, but now the university semester is over, and I have finally some spare time to catch up on a lot of things. So here we go: there is a new component release available on SourceForge (https://sourceforge.net/projects/mcuoneclipse/files/PEx%20Components/): Components 2015-07-05.zip
Debugging ARM Cortex-M Hard Faults with GDB Custom Command
In “A Processor Expert Component to Help with Hard Faults” I’m using a C handler with some assembly code, created with Processor Expert, to help me with debugging hard faults on ARM Cortex-M. Inspired by a GNU gdb script here, I have now an alternative way. As this approach is using the GDB command line approach, it works both with an Eclipse GUI and with using GDB in command line mode only :-).

Open Source Static Code Analysis: Cppcheck with Eclipse
I have a challenge for you: Can you spot the problem in the following source?
TMOUT1_CounterHandle TMOUT1_GetCounter(TMOUT1_CounterType nofTicks){Â Â TMOUT1_CounterHandle handle;Â Â CS1_CriticalVariable();Â Â handle = 0;Â Â if (nofTicks==0) {Â Â Â Â nofTicks = 1; /* wait at least for one tick, otherwise will timeout immediately */Â Â }Â Â CS1_EnterCritical();Â Â while (!TMOUT1_FreeCounters[handle] && handle<TMOUT1_NOF_COUNTERS) {Â Â Â Â handle++;Â Â }Â Â if (handle<TMOUT1_NOF_COUNTERS) {Â Â Â Â TMOUT1_FreeCounters[handle]=FALSE;Â Â Â Â TMOUT1_Counters[handle] = nofTicks;Â Â }Â Â CS1_ExitCritical();Â Â if (handle==TMOUT1_NOF_COUNTERS) {Â Â Â Â return TMOUT1_OUT_OF_HANDLE;Â Â }Â Â return handle;}No? Well, I have not spotted the problem the first time neither. However, a reader of this blog did: he used a cool tool named ‘cppcheck’: that tool reported the following:
Tutorial: Using Kinetis Design Studio V3.0.0 with IAR and Keil IDE’s
Freescale Kinetis Design Studio V3.0.0 came out early May this year. One of the new cool features is that it includes the Processor Expert V3.0.0 with an extended New Project Wizard. With this wizard I’m able to create and use Processor Expert projects with IAR Embedded Workbench and Keil MDK :-).


