FreeRTOS Continuous Trace Streaming

Key to successfully implementing embedded applications these days is to have detailed visibility into what is going on with the application on the board. For this, I’m using the FreeRTOS+Trace from Percepio to inspect the runtime behaviour. Stop-Mode debugging is very useful, but visibility into the runtime is even more important. FreeRTOS+Trace is a tool to accomplish this, but it requires to dump the data off the target to the host (see “Updated Percepio Tracealyzer and Trace Library to Version V2.7.0“). Usually, I’m using the GDB debugger for this, and that works for shorter trace sequences like a few seconds. Yes, I can combine them, but it painful to stop, dump and continue. So what if I could collect trace for several minutes or hours without the need to stop the application? Why not stream the data to the host directly?

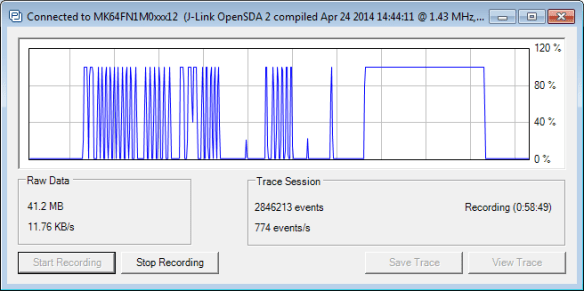
So here is it: I’m now able to get almost unlimited trace streaming off the target, witout user intervention. I can trace my application for hours šŸ™‚

Trace Recording

Trace Recording for almost one hour

Continue reading

CRC Checksum Generation with ‘SRecord’ Tools for GNU and Eclipse

One of the things missing for Embedded in the GNU linker is that it cannot generate a CRC checksum. Luckily, there is the solution of using SRecord:

SRecord 1.64 Web Page
Continue reading

Poor Man’s Trace: Free-of-Charge Function Entry/Exit Trace with GNU Tools

There are cases where my application runs find for days, weeks or even months, but then from time to time there is an application crash. Yes, the watchdog will recover it, but still it would be good to know what happened? One solution would be to hook up a trace probe (like the one I have described in this post: “First Steps with the P&E Tracelink“). But having such a trace probe attached all the time is first not cheap and second not always possible. So what if the application would leave ‘breadcrumbs’ behind which would tell me the flow of the program leading to the problem? I have found a functionality in the GNU tools which seems not be widely known or use, but is incredibly helpful in such cases.

So what if I could get a log like this telling me which functions get called by whom?

{ 00000E88->00000DA0 ???->DEMO_Init
} 00000E88<-00000DA0 ???<-DEMO_Init
{ 00000E8C->00000D40 ???->DEMO_Run
Ā { 00000D62->00000CE8Ā  DEMO_Run:0x0022->decide
Ā  { 00000D0E->00000C60Ā  decide:0x0026->calcValue
Ā  } 00000D0E<-00000C60Ā  decide:0x0026<-calcValue
Ā  { 00000D16->00000CA0Ā  decide:0x002E->getValue
Ā Ā  { 00000CC6->00000C60Ā  getValue:0x0026->calcValue
Ā Ā  } 00000CC6<-00000C60Ā  getValue:0x0026<-calcValue
Ā  } 00000D16<-00000CA0Ā  decide:0x002E<-getValue
Ā } 00000D62<-00000CE8Ā  DEMO_Run:0x0022<-decide
Ā { 00000D62->00000CE8Ā  DEMO_Run:0x0022->decide

Continue reading

Using the DHT11/DHT22 Temperature/Humidity Sensor with a FRDM Board

For a home automation project I need to know the room temperature and humidity percentage of the room air. Adafruit has an inexpensive DHT11 sensor fromĀ http://www.aosong.com which I decided to use for that project.

Test Setup for DHT11 Sensor

Test Setup for DHT11 Sensor

Continue reading

Altium File for Freescale FRDM-K25Z Board

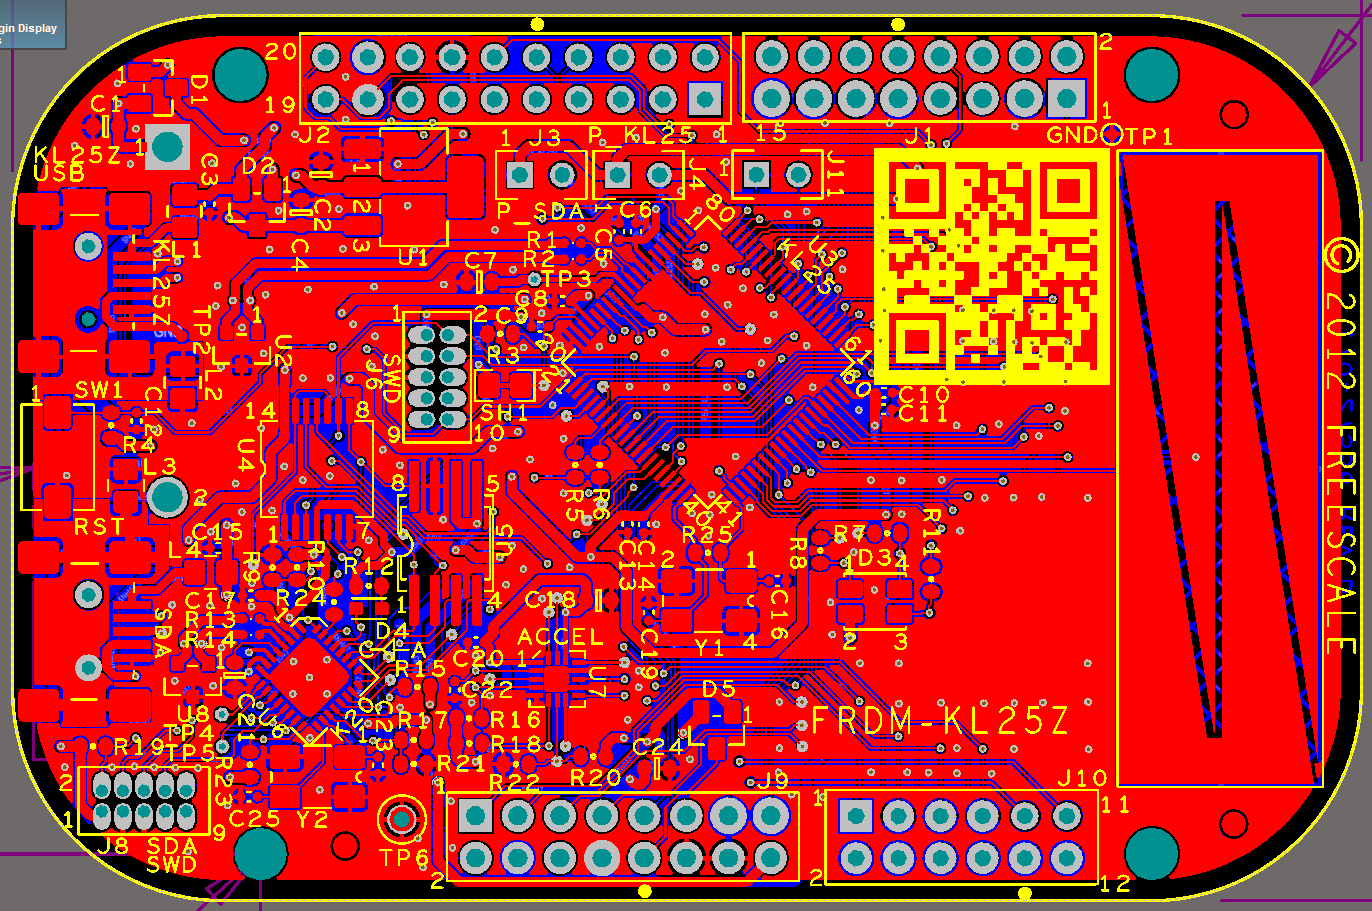
If you are designing your own board for the Freescale FRDM boards, then having the matching PCB design files is a good thing to have. I have posted this week an Altium contribution on GitHub for the FRDM headers (see “FRDM-KL25Z Arduino Headers with Altium“). And here there is yet another contribution I received from [Darren]: the FRDM-KL25Z board in Altium :-):

FRDM-KL25Z in Altium

FRDM-KL25Z in Altium

Continue reading

Command Line Programming and Debugging with GDB

Eclipse with GDB is great: it comes with a graphical front end for debugging. But sometimes it is all about to download a program. Is it really necessary to launch an IDE like Eclipse to program or quickly debug a board? With the GNU Debugger (GDB), the answer is ‘no’: GDB comes with a command line debugger which is designed exactly for this: providing a command line interface for programming/downloading and debugging, bypassing any GUI (Graphical User Interface).

Combination of GDB Debugging Probes and Boards

Combination of GDB Debugging Probes and Boards (P&E, Segger and FRDM-KL25Z)

Continue reading

OpenOCD/CMSIS-DAP Debugging with Eclipse and without an IDE

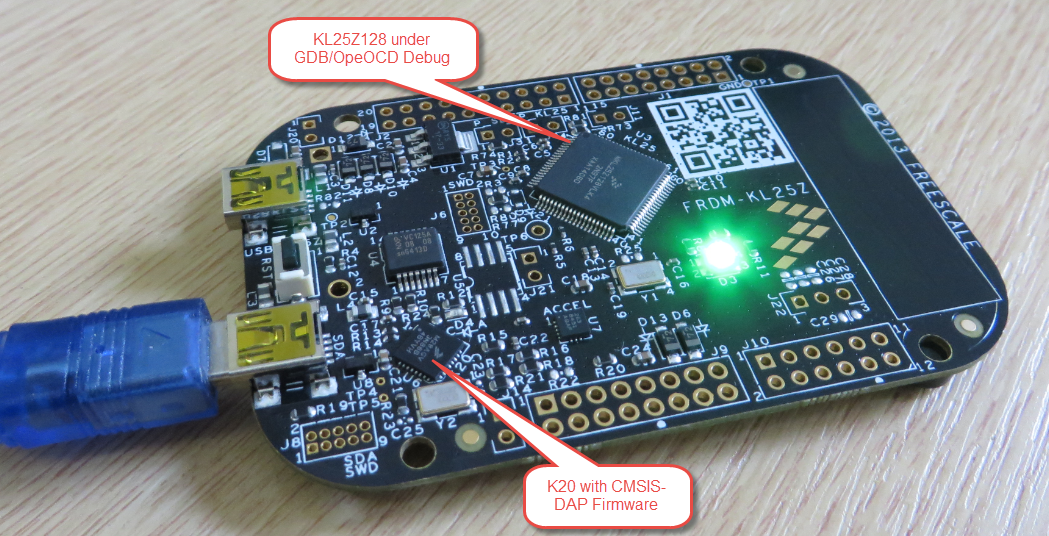
OpenOCD is an open source and free-of-charge debugging solution, which is a great option here at the University of Lucerne, as students do not need to buy an expensive debugging probe. Still, I recommend to buy professional probes like the P&E or Segger ones, as they are worth every (Euro) cent. But for a ‘zero’ budget, OpenOCD with CMSIS-DAP is something to consider. And with Kinetis Design Studio using the GNU ARM Eclipse Plugins, OpenOCD is not that hard to be used. And because both Freescale and GNU ARM Eclipse offer OpenOCD Windows binaries, that connection method is in the reach of Windows users too.

FRDM-KL25Z with OpenOCD Debug

FRDM-KL25Z with OpenOCD Debug

Continue reading

Attaching to a Running Target with Segger J-Link, GDB and Eclipse

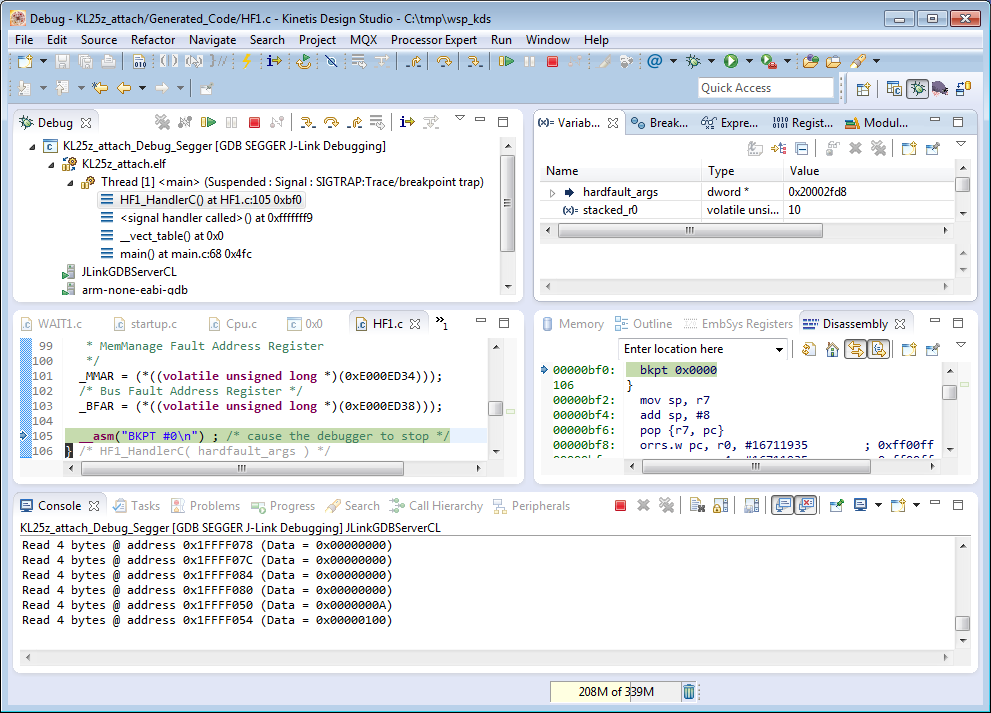
This happens several times for me: I have a board running for a while (even for days), and then it crashes or is stuck somewhere. Yes, I usually use a watchdog do recover from that situation. But it would be good to know and debug the problem. With CodeWarrior I had the functionality in the debugger to ‘attach’ or ‘connect’ to a running (stuck/crashed) board. However, with Eclipse/Kinetis Design Studio/GDB this is a different debugger, and not possible. At connection time with the debugger the target does a reset, so I don’t know any more where the application crashed. But now I have a solution, at least with the Segger GDB :-).

Debug Hard Fault Attached Target

Debug Hard Fault Attached Target

Continue reading