In “Unboxing the Freescale FRDM-KL43Z Board” I was using the FRDM-KL43Z board the first time. The FRDM-KL43Z board has an on-board debug interface (Kinetis K20, OpenSDA). In this post I show how to use the FRDM-KL43Z board to debug another ARM board.
Category Archives: Debugging
Thanks to Erich and FRDM-K64F!! :)
It has been a long time since I wrote my last blog. I really want to apologize to you all for the delay, but I was busy with another project about the competitive analysis of Freescale with our competitors. I hope I can provide you guys later with some important findings from my research.
Well as far as my project for neopixels using FRDM-K64F is concerned, Erich wrote the wonderful tutorial for all of us to turn on the NeoMatrix. I tried my hands on that and I was indeed able to turn on the board but not in the way I wanted it to. 😦 So, it turns out that I got few LEDs turning blue or some turning green. I asked Erich about it and I got to know that it is because I screwed up with the timing signals. I was using an oscilloscope and not a logic analyzer but Erich’s recommendation was to use the Logic Analyzer. This was the result of my experiment following Erich’s tutorials.
Tutorial: Adafruit WS2812B NeoPixels with the Freescale FRDM-K64F Board – Part 1: Hardware
Tutorial: Adafruit WS2812B NeoPixels with the Freescale FRDM-K64F Board – Part 2: Software Tools
This is Part 2 of a Mini Series. In Part 1, I described how to set up the hardware (see “Tutorial: Adafruit WS2812B NeoPixels with the Freescale FRDM-K64F Board – Part 1: Hardware“). Now it is time to have the software tools ready. In this post I describe to have the IDE (Freescale Kinetis Design Studio) with the Freescale SDK installed, along with the correct firmware on the FRDM-K64F Board. The goal is to drive Adafruit’s NeoPixel (WS2812B) with the Freescale FRDM-K64F board:
To write a program using KDS with Kinetis SDK!!
Starting from the baby steps for our project seems like a good idea but not very helpful though. Learning and understanding Kinetis SDK seems like a lot of work. Meanwhile, I would like to share an important piece of information that I found on my path of working on this project. Many of you might already know, but being a first time user of Kinetis SDK 1.2.0, I found that there are few differences between Kinetis SDK 1.1.0 and Kinetis SDK 1.2.0. I was trying my hands on to use the KDS with KSDK.
So, In order to create a KDS project with Kinetis SDK, I need to create new folders, add different files and the libraries to my project. I didn’t look into all this with much detail before. I would recommend all to go through this link in order to understand using KDS with Kinetis SDK1.1.0 and Kinetis SDK 1.2.0.
This is how it looks after you have added everything:
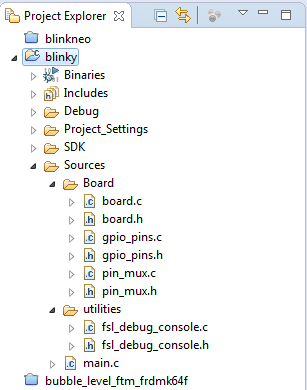
Using Kinetis Design Studio V3.0.0 with the Launchpad 4.9-2015-q2 Release
The Kinetis Design Studio v3.0.0 comes with the GNU/GCC ARM Embedded (launchpad) version 4.8-2014-q3. End of June 2015, ARM released a new version, the 4.9-2015-q1.So why not using that newer release?
- It comes with GDB version 7.8 and has the ‘return of function display’ feature.
- GDB has Phyton scripting support.
- It fixes that nasty GDB bug ‘breakpoint on removed code’ issue.
Is that already enough to make that switch?
Show Opcodes in Eclipse Disassembly View
One new feature in CDT 8.4 or later is the ability to see the instruction opcode in the disassembly view:
Automatic Variable, Expression and Memory Display with GDB and Eclipse
One of the great features in CodeWarrior for MCU10.x is the ability to read memory/variables while running (see “Live View for Variables and Memory“). This technology of ‘live view’ is based on the CodeWarrior debugger engine. How can I do something like this with stock GDB and Eclipse? What I need is a periodic update of variables/expressions/memory while the program on the board is running, without the need to stop the board with the debugger first:
FreeRTOS Continuous Trace Streaming
Key to successfully implementing embedded applications these days is to have detailed visibility into what is going on with the application on the board. For this, I’m using the FreeRTOS+Trace from Percepio to inspect the runtime behaviour. Stop-Mode debugging is very useful, but visibility into the runtime is even more important. FreeRTOS+Trace is a tool to accomplish this, but it requires to dump the data off the target to the host (see “Updated Percepio Tracealyzer and Trace Library to Version V2.7.0“). Usually, I’m using the GDB debugger for this, and that works for shorter trace sequences like a few seconds. Yes, I can combine them, but it painful to stop, dump and continue. So what if I could collect trace for several minutes or hours without the need to stop the application? Why not stream the data to the host directly?
So here is it: I’m now able to get almost unlimited trace streaming off the target, witout user intervention. I can trace my application for hours 🙂
Using Segger Real Time Terminal (RTT) with Eclipse
I have used semihosting more and more in my projects. However, there are several disadvantage of using it:
- Without special handlers, it only works with an active debug connection going on. Without a debugger attached, the application blocks otherwise.
- Because it needs debugger interactions, it is rather slow (only several hundreds of bytes per second)
The good news is that Segger supports with their debug probes a faster approach with what they name Real Time Terminal (RTT). And it even runs without a debugger attached to the board: all what I need is a Segger J-Link probe (or Segger J-Link OpenSDA) plus a telnet client.
Debugging ARM Cortex-M Hard Faults with GDB Custom Command
In “A Processor Expert Component to Help with Hard Faults” I’m using a C handler with some assembly code, created with Processor Expert, to help me with debugging hard faults on ARM Cortex-M. Inspired by a GNU gdb script here, I have now an alternative way. As this approach is using the GDB command line approach, it works both with an Eclipse GUI and with using GDB in command line mode only :-).


