Wondering why the Eclipse Project view might not show all files in the Project Explorer view? For example it shows this:

Eclipse Project Explorer View
But on disk I have more files? Where are they?
Wondering why the Eclipse Project view might not show all files in the Project Explorer view? For example it shows this:
Eclipse Project Explorer View
But on disk I have more files? Where are they?
The FRDM-K64F board as other Freescale Freedom board have an onboard debugging device. For everyone who wants to debug the FRDM-K64F board with say a P&E Universal Multilink, here is my setup in case you do not get it working out of the box:

FRDM-K64F with P&E Multilink (click to enlarge)
I very much liked the CodeRed Eclipse based IDE (see “Red Suite 5: Eclipse Juno, Processor Expert and unlimited FRDM-KL25Z“). But back in May 2013 CodeRed was acquired by NXP. I have not used much NXP devices for my projects, and as CodeRed was focusing on the NXP parts, CodeRed was not running daily on my desk any more :-(. Well, things might make a full back circle, as NXP announced back March 1st 2015 to acquire Freescale :-). And maybe as a taste how things might come out, the GNU ARM Eclipse plugin release from March 22nd 2015 includes a CodeRed debug view 🙂 🙂

CodeRed Debug Perspective in KDS
That debug perspective mimics a CodeRed debug perspective. The advantage of this Eclipse perspective is that it works very well with small screens. This post is about adding this perspective to the recently release Kinetis Design Studio v3.0.0.
What I love with Eclipse: it has lots of small and useful features, either built-in or available as plug-in. Recently I started to use a feature which is present in Eclipse for some time: the ability to save screen real estate during debugging with the ‘breadcrumb’ view option:

Expanded Breadcrumb View
In Eclipse, the usual way to add new plugins or extend the IDE is using the menu Help > Install New Software. Same thing for the newly released Freescale Kinetis Design Studio V3.0.0: I add the support for new devices in the Freescale Kinetis SDK from the SDK Eclipse update:

Installing Kinetis SDK v1.2 update in Eclipse
One thing I noticed with this (and all others updates I do) is that they take much time to install. That’s expected if the update needs to be downloaded from the web. But I was wondering why it takes so long even if the files are local?
Thanks to a tip (thank you, Marek!), there is a setting to cut the installation time :-). Continue reading
So now I have carefully set up my compiler include paths in Eclipse to tell the GNU compiler where to find my header files:

Include Paths
The question is: how can I apply these settings to another project?
One of the things missing for Embedded in the GNU linker is that it cannot generate a CRC checksum. Luckily, there is the solution of using SRecord:

If you have read my article “Serial Terminal View with Eclipse Kepler“, then you are aware that using a Terminal view to a serial connection (COM port) under Eclipse Kepler is pretty much broken. I’m moving some of my projects to the more recent Eclipse Luna release, and the good news is that support is back 🙂

Terminal View with connection to board
P&E has upgraded their GDB implementation and interface used in combination with the GNU ARM Eclipse plugins: they support now advanced flash programming options plus the ability to attach/connect to a running target :-). This update is available as Eclipse update.
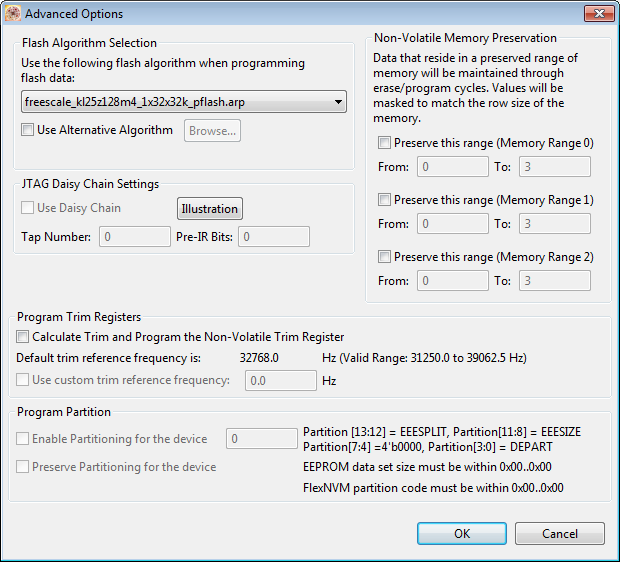
Advanced Options
There are cases where my application runs find for days, weeks or even months, but then from time to time there is an application crash. Yes, the watchdog will recover it, but still it would be good to know what happened? One solution would be to hook up a trace probe (like the one I have described in this post: “First Steps with the P&E Tracelink“). But having such a trace probe attached all the time is first not cheap and second not always possible. So what if the application would leave ‘breadcrumbs’ behind which would tell me the flow of the program leading to the problem? I have found a functionality in the GNU tools which seems not be widely known or use, but is incredibly helpful in such cases.
So what if I could get a log like this telling me which functions get called by whom?
{ 00000E88->00000DA0 ???->DEMO_Init
} 00000E88<-00000DA0 ???<-DEMO_Init
{ 00000E8C->00000D40 ???->DEMO_Run
 { 00000D62->00000CE8  DEMO_Run:0x0022->decide
  { 00000D0E->00000C60  decide:0x0026->calcValue
  } 00000D0E<-00000C60  decide:0x0026<-calcValue
  { 00000D16->00000CA0  decide:0x002E->getValue
   { 00000CC6->00000C60  getValue:0x0026->calcValue
   } 00000CC6<-00000C60  getValue:0x0026<-calcValue
  } 00000D16<-00000CA0  decide:0x002E<-getValue
 } 00000D62<-00000CE8  DEMO_Run:0x0022<-decide
 { 00000D62->00000CE8  DEMO_Run:0x0022->decide
