Remote debugging an embedded target is very useful: I don’t need a direct debug probe or USB cable connection. Instead, I’m using a network connection (wired or even wireless) over TCP/IP to talk to the debug probe and target. That way I can place the debug probe and target system away from my desk.
In Remote Debugging with USB based JTAG/SWD Debug Probes I showed how normal USB based debug probes can be used. This approach uses a remote host machine (e.g. desktop machine or notebook). This approach is still expensive, not scalable and the host machine needs a lot of space too.
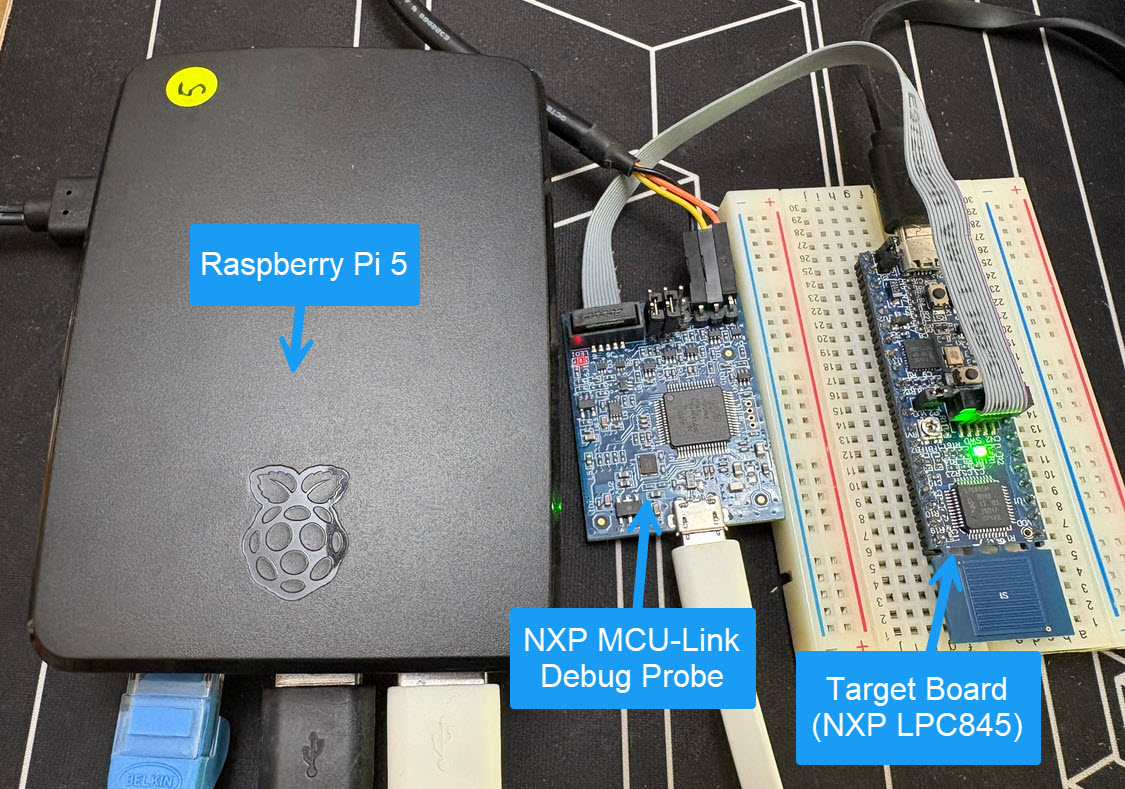
So what if I use a Raspberry Pi instead? The RPi is small, inexpensive and ideal for such a task. Additionally, I can easily use it to build a test or debug farm. In this article, I show the use of the Raspberry Pi for remote debugging. A sub $20 or embedded target debug probe can be employed.
Raspberry Pi with NXP MCU-Link for Embedded Target DebuggingContinue reading →
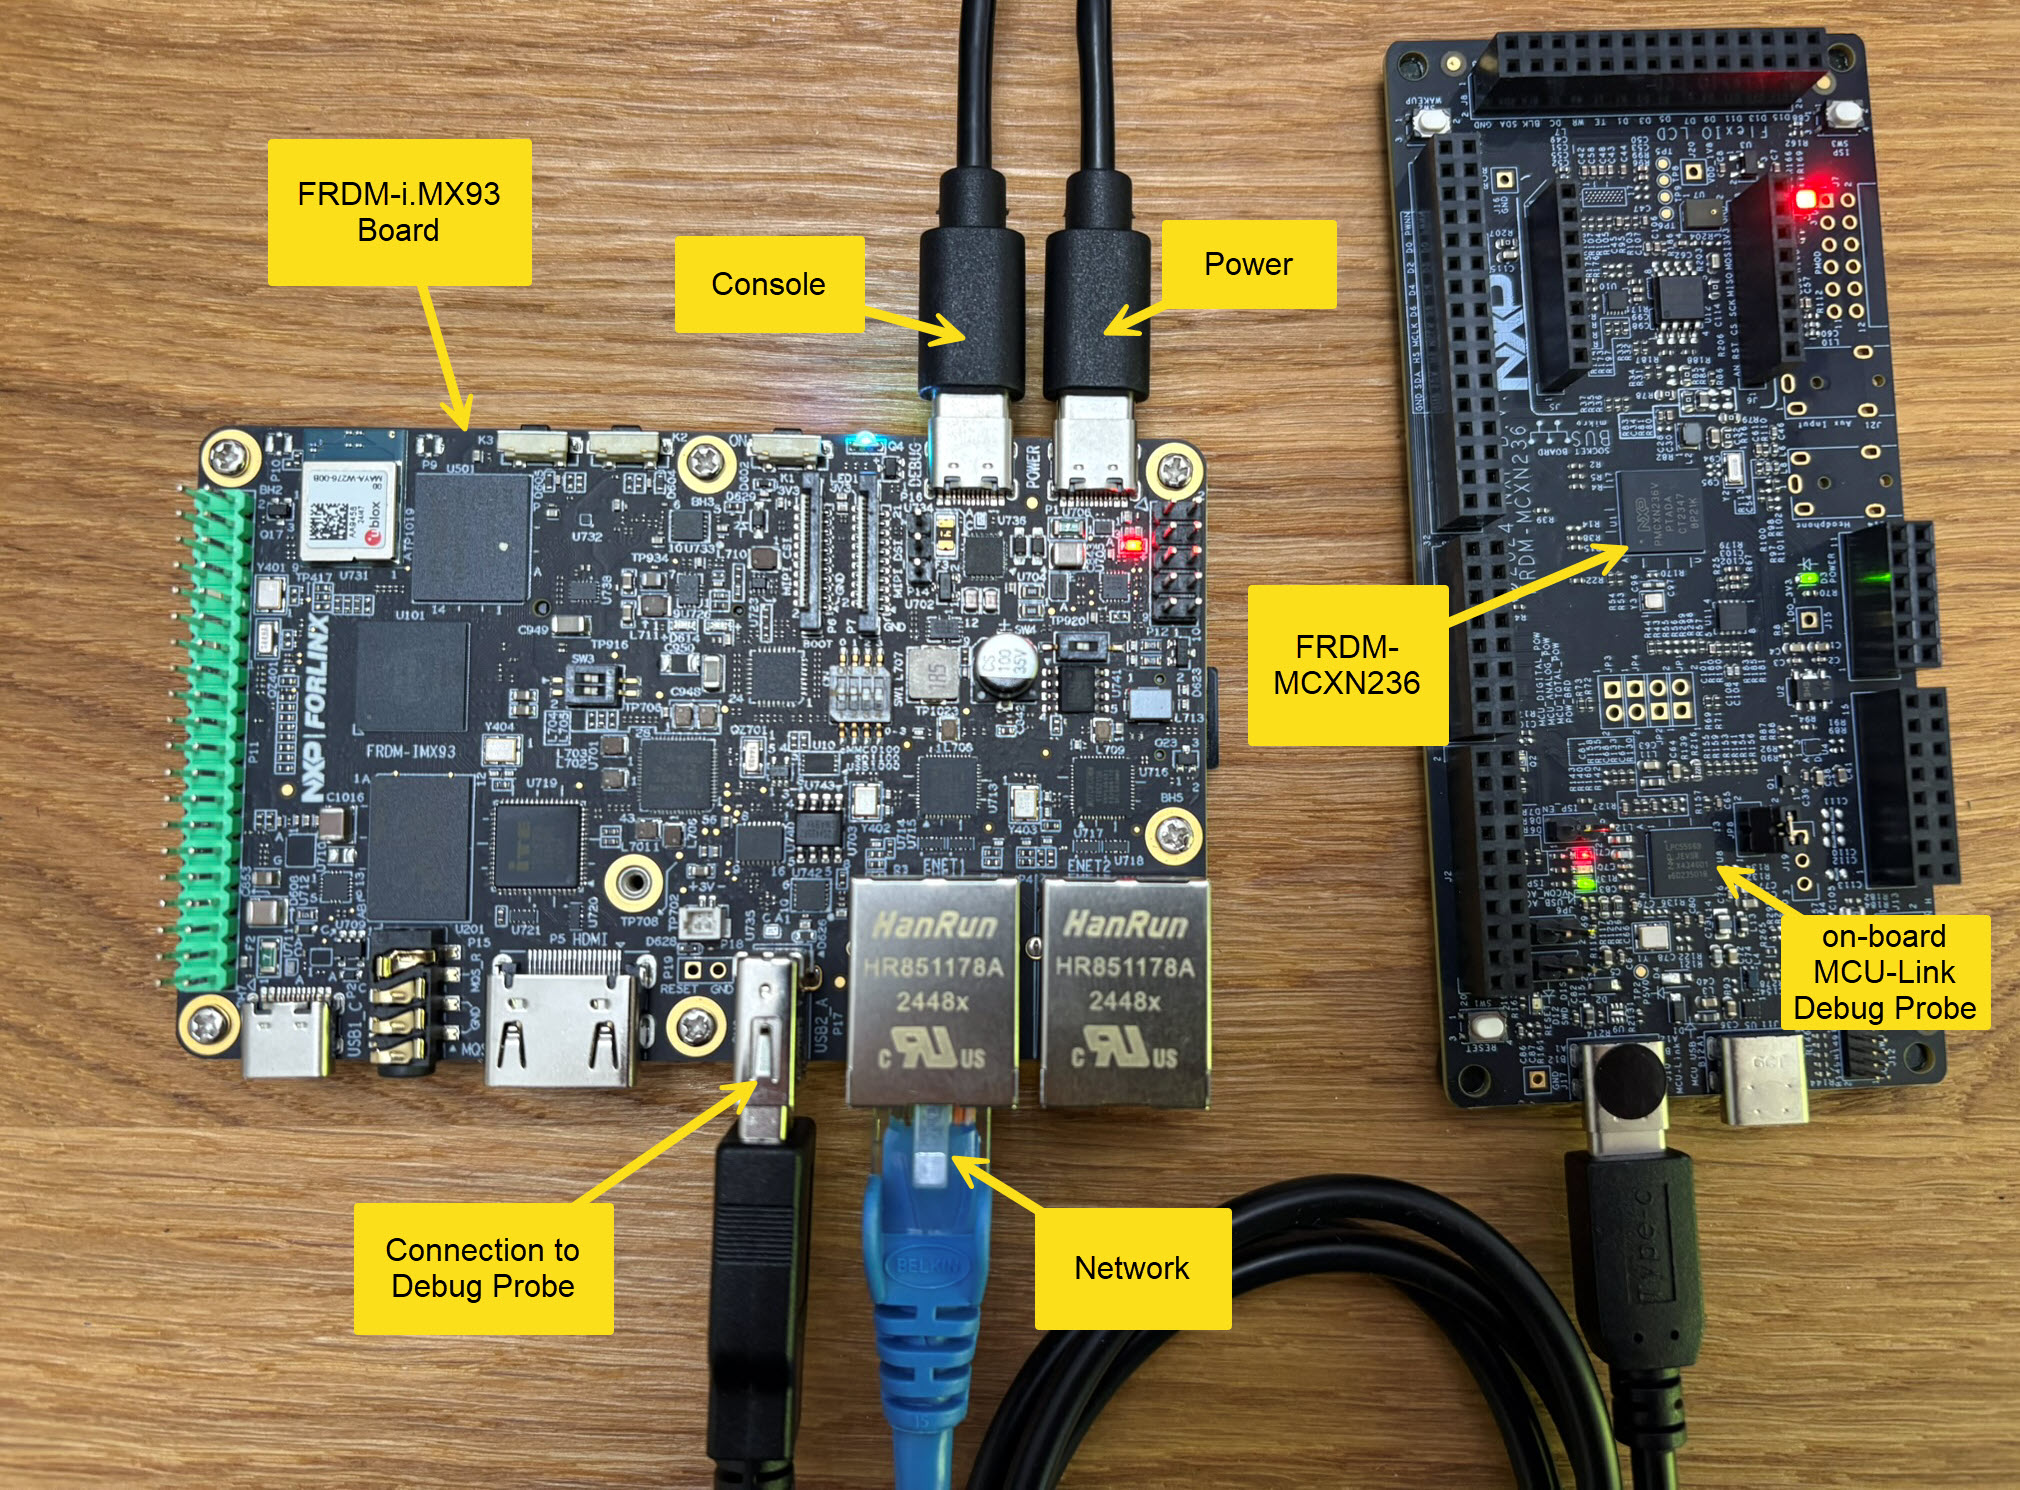
The NXP i.MX RT685 is an interesting device: an ARM Cortex M33 with a Cadence Xtensa audio DSP. To explore the features of the device, I’m using the NXP EVK board:
pyOCD with NXP i.MX RT685
I have used it so far with the on-board MCU-Link debug probe and LinkServer. This article describes how I have added pyOCD as debug interface for the RT685, as well how to patch and use custom DFP (Device Family Pack) files with pyOCD and Eclipse.
If doing embedded development, then the debugging solution is probably the most important single tool in the development chain. Because very debugging probe has its pros and cons, I usually have at least three different debug probes on my desk, simply to get the job done in all aspects.
What is true for the hardware debugging probes, is true for the gdb client and server side. I’m using mostly the P&E, SEGGER and CMSIS-DAP plugins (e.g. NXP LinkServer) and OpenOCD from the Eclipse IDE side. But there are more choices, for example pyOCD.