Using Raspberry Pi and MCU-Link for Remote Embedded Debugging

Remote debugging an embedded target is very useful: I don’t need a direct debug probe or USB cable connection. Instead, I’m using a network connection (wired or even wireless) over TCP/IP to talk to the debug probe and target. That way I can place the debug probe and target system away from my desk.

In Debugging ARM Cores with IP based Debug Probes and Eclipse I have used IP-based debug probes. This is a logical path, but expensive.

In Remote Debugging with USB based JTAG/SWD Debug Probes I showed how normal USB based debug probes can be used. This approach uses a remote host machine (e.g. desktop machine or notebook). This approach is still expensive, not scalable and the host machine needs a lot of space too.

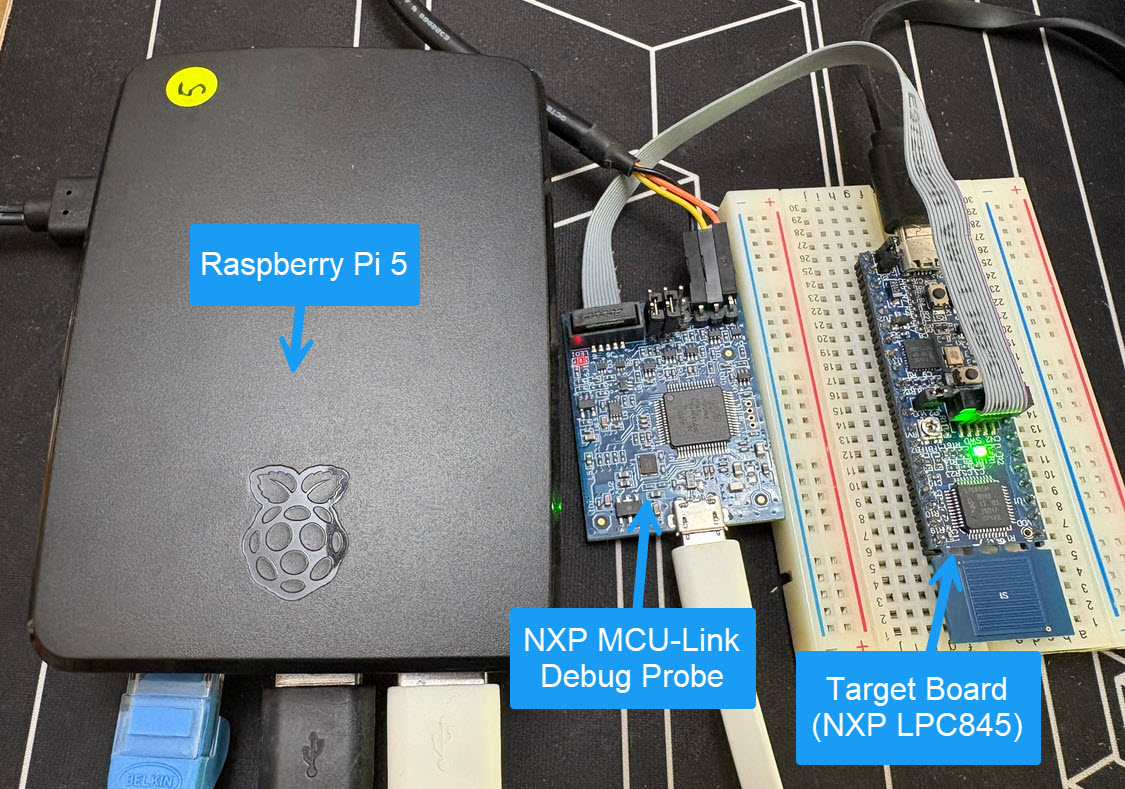
So what if I use a Raspberry Pi instead? The RPi is small, inexpensive and ideal for such a task. Additionally, I can easily use it to build a test or debug farm. In this article, I show the use of the Raspberry Pi for remote debugging. A sub $20 or embedded target debug probe can be employed.

Raspberry Pi with NXP MCU-Link for Embedded Target Debugging
Continue reading

Multi-Core Symmetric Multi-Processing (SMP) with FreeRTOS

Maybe you are using a multi-core device in your projects, but have not tapped into multi-core usage yet? FreeRTOS V11.0 is out, and the big news is that it has finally Symmetric Multi-Processing (SMP) integrated into the mainline. This greatly simplifies FreeRTOS usage, as I finally can use the same RTOS for my SMP targets and boards, and I can easily switch between single-core and multi-core applications.

Dual-Core Boards running with FreeRTOS
Continue reading

Debugging Embedded Targets with pyOCD and Eclipse

If doing embedded development, then the debugging solution is probably the most important single tool in the development chain. Because very debugging probe has its pros and cons, I usually have at least three different debug probes on my desk, simply to get the job done in all aspects.

What is true for the hardware debugging probes, is true for the gdb client and server side. I’m using mostly the P&E, SEGGER and CMSIS-DAP plugins (e.g. NXP LinkServer) and OpenOCD from the Eclipse IDE side. But there are more choices, for example pyOCD.

Continue reading

Open Source FTDI FT2232 JTAG and UART Adapter Board

In JTAG Debugging the ESP32 with FT2232 and OpenOCD I have used a FTDI FT2232 breakout board to JTAG debug with OpenOCD. With an adapter board on top of the TDI FT2232 the wiring is much easier and simpler to use:

JTAG Debugging the ESP32 with FT2232

JTAG Debugging the ESP32 with FT2232

Continue reading

JTAG Debugging the ESP32 with FT2232 and OpenOCD

In “Eclipse JTAG Debugging the ESP32 with a SEGGER J-Link”  I used a SEGGER J-Link to debug an ESP32 device with JTAG. I looked at using one of the FTDI FT2232HL development boards which are supported by OpenOCD. The FT2232HL is dual high-speed USB to UART/FIFO device, and similar FTDI devices are used on many boards as UART to USB converters. With OpenOCD these devices can be turned into inexpensive JTAG debug probes. This article shows how to use a $10 FTDI board as JTAG interface to program and debug the Espressif ESP32.

FTDI JTAG Connection

Continue reading