
FreeRTOS seems to get more and more popular, and I think as well because more and more debugger and Eclipse IDE vendors add dedicated debugging support for it.

FreeRTOS Threads in Eclipse
Outline
This article describes tips and tricks to get FreeRTOS thread aware debugging in Eclipse, organized by debug probe connection/vendor. For thread awareness, the debugger needs to know some well-known symbols of the RTOS. So beside of checking if the thread awareness is turned on, have a look about the debug output. If the symbols are not present, it might be because of linker optimizations or not turning on FreeRTOS features.
P&E (Multilink)
The P&E debug connection has no special setting for FreeRTOS thread aware debugging and does it automatically, so there is no option to turn it on or off.
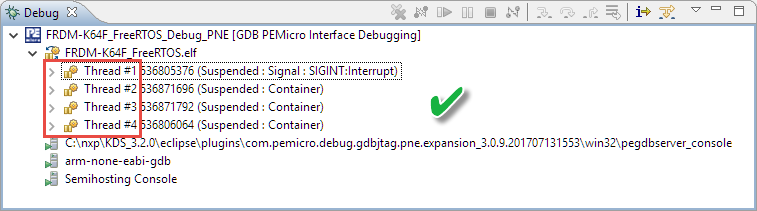
Thread Aware FreeRTOS Debugging with P&E
The P&E GDB servers should report this at the beginning in the console:
Successfully initialized kernel symbols.
P&E Sucessfully Initialized kernel symbols
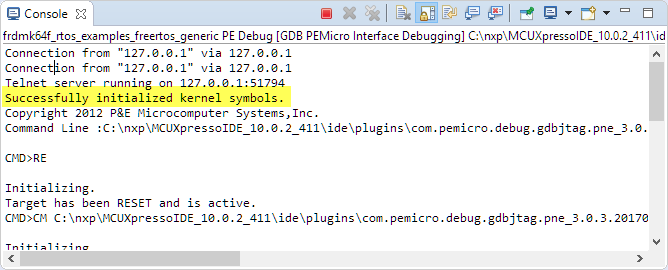
The P&E GDB Server console should show
Kernel thread information now available.

Kernel Thread Information available
Below is a list of symbols the P&E GDB server is looking for:
Searching for FreeRTOS Kernel Symbols…
Symbol pxCurrentTCB found. (0x20002880)
Symbol pxReadyTasksLists found. (0x20002884)
Symbol xDelayedTaskList1 found. (0x200028E8)
Symbol xDelayedTaskList2 found. (0x200028FC)
Symbol xPendingReadyList found. (0x20002918)
Symbol uxCurrentNumberOfTasks found. (0x20002958)
Symbol uxDeletedTasksWaitingCleanUp found. (0x20002940)
Symbol xSuspendedTaskList found. (0x20002944)
Symbol xSchedulerRunning found. (0x20002964)
Successfully initialized kernel symbols. FreeRTOS analysis enabled.
Segger (J-Link)

FreeRTOS Thread Aware Debugging with J-Link

Debugging with Segger J-Link
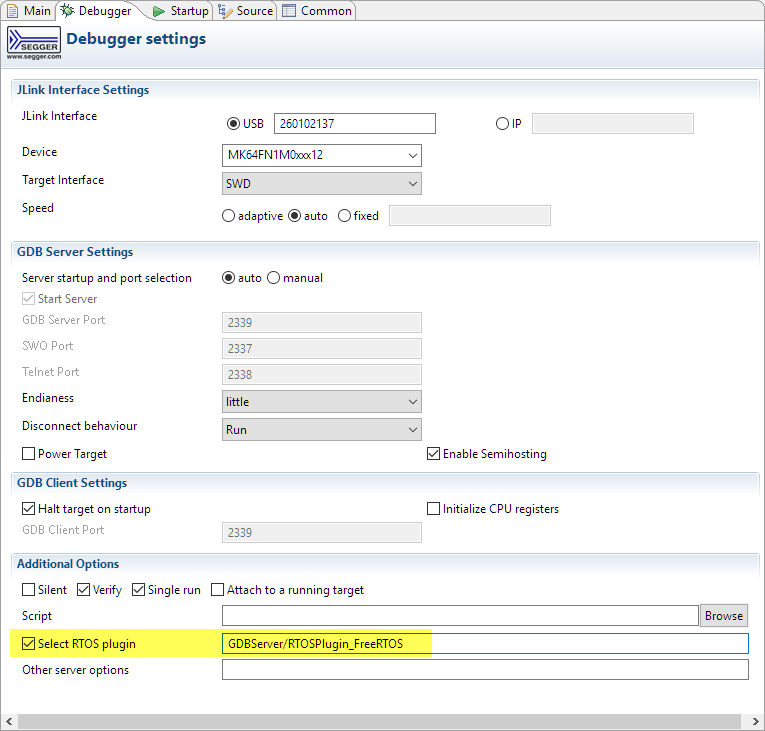
Thread aware debugging needs to be turned on for Segger with the following command
-rtos GDBServer/RTOSPlugin_FreeRTOS
That option can be specified in the launch configuration (GNU ARM (now MCU) Eclipse plugins, e.g. in Kinetis Design Studio 3.2.0):

FreeRTOS Thread Awareness option in Launch Configuration
In MCUXpresso IDE v10.0.2, there is a drop-down setting for this in the debug configuration:
MCUXpresso IDE Segger FreeRTOS Setting
Check in the JLinkServer Eclipse console view if the needed symbols are present in the application:
Loading RTOS plugin: GDBServer/RTOSPlugin_FreeRTOS...
RTOS plugin (v1.0) loaded successfully
RTOS plugin initialized successfully.
Received symbol: pxCurrentTCB (0x2000B084)
Received symbol: pxReadyTasksLists (0x2000B088)
Received symbol: xDelayedTaskList1 (0x2000B0EC)
Received symbol: xDelayedTaskList2 (0x2000B100)
Received symbol: pxDelayedTaskList (0x2000B114)
Received symbol: pxOverflowDelayedTaskList (0x2000B118)
Received symbol: xPendingReadyList (0x2000B11C)
Received symbol: xTasksWaitingTermination (0x2000B130)
Received symbol: xSuspendedTaskList (0x2000B148)
Received symbol: uxCurrentNumberOfTasks (0x2000B15C)
Received symbol: uxTopUsedPriority (0x20000038)
Received symbol: uxTopReadyPriority (0x2000B164)
Received symbol: vPortEnableVFP (0x00016968)
All mandatory symbols successfully loaded.

Segger J-Link checking FreeRTOS Symbols
NXP (LinkServer)

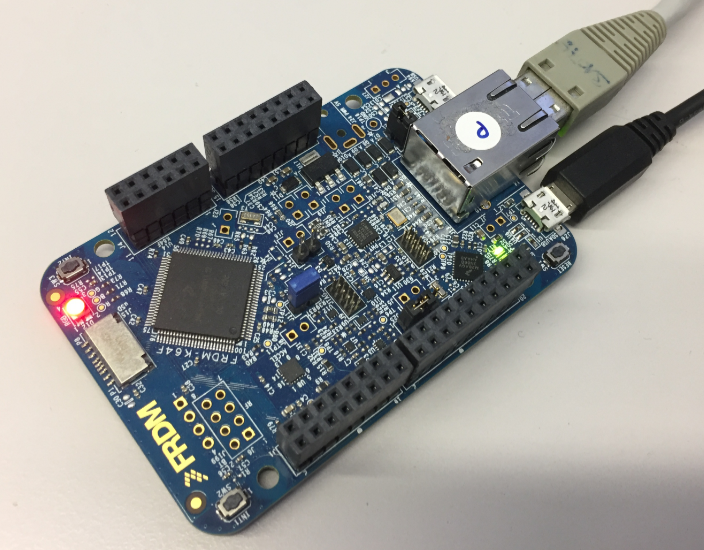
Debugging FRDM-K64F with LinkServer (LPC-Link2)
With MCUXpresso IDE, make sure you connectin in ‘All-Stop’ mode (see MCUXpresso_IDE_FreeRTOS_Debug_Guide.pdf inside the IDE installation folder):

LinkServer in All-Stop Mode for FreeRTOS Thread Awareness
💡 As this setting is configured the first time I connect to the probe, the easiest way to change this is to delete the LinkServer launch configuration and connect/debug again. Note that with MCUXpresso V10.0.2 on using All-Stop mode will interfer with Live Variable view (will not be possible in All-Stop mode)
The above setting is accessible in the launch configuration under ‘Non-stop mode’ under the ‘Main’ sub-tab of the LinkServer debug configuration:

Non-Stop Mode in LPC-Link2 Launch Configuration
Make sure the following debug helpers are enabled:

NXP LinkServer Thread Awareness
With the LinkServer (MCUXpresso IDE) threads are shown like below:
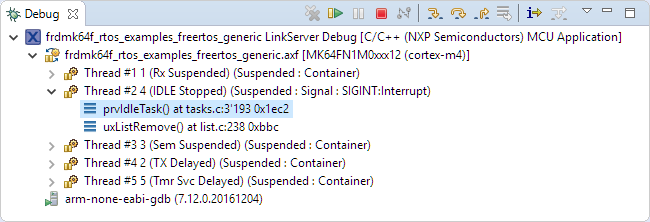
FreeRTOS Thread Awareness with LinkServer
If threads are not shown, increase the Debug Level to 4 in the launch configuration:
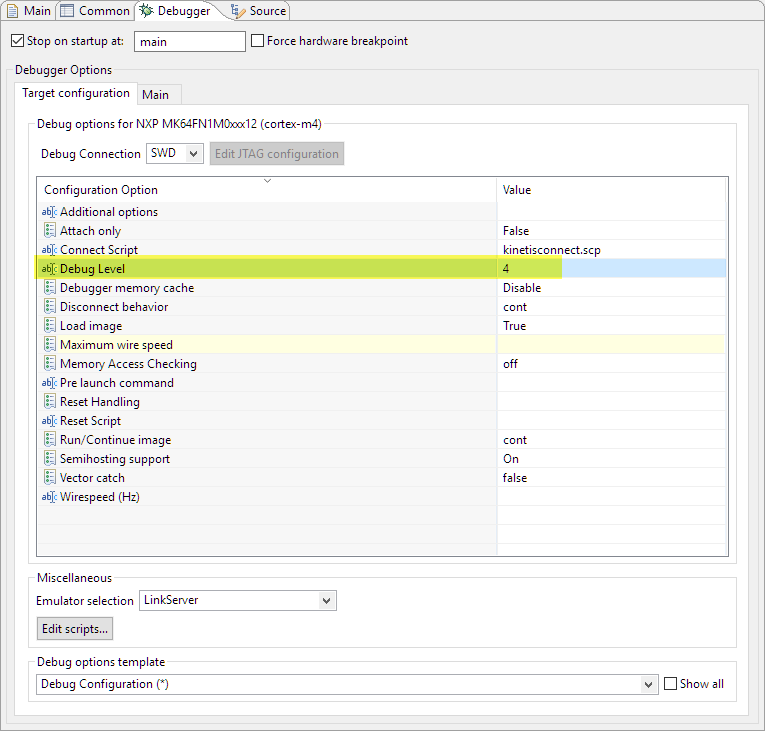
LinkServer Debug Level
💡 I recommend to switch the debug level back to the default of 2, as it produces a lot of output.
Later NXP MCUXpresso version (e.g. 11.4.1) somehow do not have the above dialog box any more. In that case, open the .launch file with a text editor and search for “debug.level” and change that value:

In the Debug messages Console view, check that all the needed symbols are found:
FreeRTOS symbol(s) found:
- "pxReadyTasksLists" 0x200028C0
- "xPendingReadyList" 0x20002950
- "xSuspendedTaskList" 0x20002980
- "xDelayedTaskList1" 0x200028A8
- "xDelayedTaskList2" 0x2000296C
- "pxDelayedTaskList" 0x2000289C
- "pxOverflowDelayedTaskList" 0x2000294C
- "xTasksWaitingTermination" 0x20002924
- "xSchedulerRunning" 0x200028A0
- "uxCurrentNumberOfTasks" 0x20002968
- "pxCurrentTCB" 0x2000293C
- "FreeRTOSDebugConfig" 0x0000474C
FreeRTOS stack backtrace is enabled

LinkServer Debug Messages
Read the MCUXpresso_IDE_FreeRTOS_Debug_Guide.pdf inside the MCUXpresso IDE installation folder.
Make sure you have the following turned on in FreeRTOSConfig.h:
#define configINCLUDE_FREERTOS_TASK_C_ADDITIONS_H    1
#define configUSE_TRACE_FACILITY                     1
Make sure you have “freertos_tasks_c_additions.h” present in your project (You can find a version of it in the NXP SDKs or here on GitHub).
If the FreeRTOSDebugConfig structure is missing (e.g. because of optimizations), make sure it is referenced/used from the appliation, e.g. with the following code in main():
extern uint8_t FreeRTOSDebugConfig[]; int main(void) { if (FreeRTOSDebugConfig[0]==0) { /* just use it, so the linker cannot remove FreeRTOSDebugConfig[] */ for(;;); /* FreeRTOSDebugConfig[0] should always be non-zero, so this should never happen */ } /* other code in main */ }If xTasksWaitingTermination() is missing, check that you have the following enabled in FreeRTOSConfig.h:
#define INCLUDE_vTaskDelete 1OpenOCD
For OpenOCD, see FreeRTOS Thread Debugging with Eclipse and OpenOCD.
Debugging with onboard OpenSDA and OpenOCD
GNU Link Time Optimizations (-lto)
If using the GNU Link Time Optimization, this can inline functions and variable usage, so they are not available any more for the thread awareness. The McuOnEclipse FreeRTOS port has an extra setting (config_LTO_Helper) which prevents symbols for the thread awareness to be optimized. That setting is turned off (no) by default as it can increase code size:
enabling LTO Helper
Stack and Heap?
If everything fails, a good idea is to increase the task stack size and heap size, as some strange errors can happen if tasks overwrite variables of the kernel. There is an stack overflow hook in FreeRTOS, but this will not be able to catch every overflow.
NXP Thread Awareness Plugins
If using the NXP FreeRTOS plugins (see Better FreeRTOS Debugging in Eclipse), check that you have the following settings in FreeRTOSConfig.h (tips from Dave Nadler):
#define configUSE_PORT_OPTIMISED_TASK_SELECTION 0 // Can cause older FreeRTOS Eclipse plug-in to crash otherwise... #define configTASK_RETURN_ADDRESS 0 // place 0 task return address on stack to help FreeRTOS-aware debugger (GDB unwind thread stack) #define configUSE_TRACE_FACILITY 1 // without this, FreeRTOS-aware debug task list misses tasks and shows bogus stack overflowsSee for example:

- http://forum.segger.com/index.php?page=Thread&postID=15403#post15403
- https://sourceforge.net/p/freertos/discussion/382005/thread/e7d139e5/
Check the warning signs of the view, e.g. turn on configUSE_TRACE_FACILITY:

FreeRTOS Task List
The plugin puts diagnostic information into the ‘FreeRTOS_TAD_logs’ folder, located inside the workspace folder:

FreeRTOS_TAD_logs
The log files can give imporant information what is missing or wrong:
"FreeRTOS Task Aware Debugger for GDB" version 1.0.2 (201704101406)
(c) 2016 NXP Semiconductors, Inc.
==================================
11:16:24.795 INFO: [TadModel] DSF session ID 4 has started.
11:16:26.540 INFO: [TadState] TAD state changed: DEBUG_STARTED -> DEBUG_INIT_0 (SUSPENDED, USER_REQUEST)
11:16:27.734 INFO: [TadState] TAD state changed: DEBUG_INIT_0 -> DEBUG_INIT_1 (RESUMED, USER_REQUEST)
11:16:27.806 INFO: [TadState] TAD state changed: DEBUG_INIT_1 -> DEBUG_SUSPENDED (SUSPENDED, BREAKPOINT)
11:17:14.931 INFO: [TadState] TAD state changed: DEBUG_SUSPENDED -> DEBUG_RESUMED (RESUMED, USER_REQUEST)
11:17:16.654 INFO: [TadState] TAD state changed: DEBUG_RESUMED -> READY (SUSPENDED, SIGNAL)
11:17:29.695 INFO: [Benchmark] Loading data for "Task List" has started.
11:17:30.309 INFO: [FreeRTOS] FreeRTOS macro "configGENERATE_RUN_TIME_STATS" is disabled.
11:17:31.288 ERROR: [MemoryReader] Could not get memory block! Invalid address "0x1ffc0008" and/or "0x13ff8" length of a block!
11:17:32.290 INFO: [FreeRTOS] FreeRTOS macro "configUSE_TRACE_FACILITY" is disabled.
11:17:33.291 ERROR: [TaskFactory] Cannot read information from "xDelayedTaskList1".
11:17:33.999 INFO: [Benchmark] Loading data for "Task List" took 4304 ms.
11:18:42.676 INFO: [TadModel] DSF session ID 4 has ended.
In the above case, the a task had been created with 80kByte stack and this caused a problem with that version of the NXP Task aware plugin. Setting the heap to a smaller value below 64kByte worked as a workaround.
Summary
FreeRTOS thread aware debugging depends on debug connection used. In most cases it might fail because some symbols are not present in the application to help the debugger to show the threads. I hope that this article helps you to find and possibly fix any issues.
Happy Threading 🙂

Any suggestions for the following error from the segger gdb output?
Loading RTOS plugin: GDBServer\RTOSPlugin_FreeRTOS…
RTOS plugin (v1.0) loaded successfully
RTOS plugin initialized successfully.
Received symbol: pxCurrentTCB (1FFF14B4)
Received symbol: pxReadyTasksLists (00000000)
ERROR: Mandatory symbol pxReadyTasksLists not found.
Using FreeRTOS9.0 and the latest segger tools on a K20F. It all works fine if I turn of LTO, but I’d rather not. Applications works fine in either case.
LikeLike
It means that the linker somehow has removed pxReadyTasksLists. Are you using the McuOnEclipse FreeRTOS port (as this one has several measures to prevent such linker optimizations)?
LikeLike
We are actually using OPENrtos (FREErtos, no license restrictions but same code) unmodified. What is weird is we hav another project using the same code/FREErtosconfig and it works fine in either case.
LikeLike
Hi Michael,
interestingly, I’m now able to reproduce that same problem:
RTOS plugin (v1.0) loaded successfully

RTOS plugin initialized successfully.

Received symbol: pxCurrentTCB (0x20000130)

Received symbol: pxReadyTasksLists (0x00000000)

ERROR: Mandatory symbol pxReadyTasksLists not found.
I’m investigating what can be done, so stay tuned….
LikeLike
Hi Micheal,
I have now patched FreeRTOS, and now it works for me with Segger FreeRTOS awareness and -lto. Check the files task.c and port.c in the following commit:
https://github.com/ErichStyger/McuOnEclipse_PEx/commit/6a4af8383127913851ca60ddabd148f42634a70a
Basically I have marked some needed variables as non-static, otherwise the linker renames the variables and Segger cannot find them.
I hope this helps,
Erich
LikeLike
Your changes work. Thanks!!
LikeLike
posten on behalf of Dave Nadler:
—————————-
Hi Erich – Perhaps also worth mentioning..
Without the following FreeRTOS configuration settings I had erratic task-aware debugging:
#define configUSE_PORT_OPTIMISED_TASK_SELECTION 0 // Note: 1 causes FreeRTOS Eclipse plug-in to crash…
#define configTASK_RETURN_ADDRESS 0 // place 0 task return address on stack to help FreeRTOS-aware debugger (GDB unwind thread stack)
#define configUSE_TRACE_FACILITY 1 // without this, FreeRTOS-aware debug task list misses tasks and shows bogus stack overflows
See for example:
http://forum.segger.com/index.php?page=Thread&postID=15403#post15403
https://sourceforge.net/p/freertos/discussion/382005/thread/e7d139e5/
Thanks again,
Best Regards, Dave
LikeLike
Pingback: Troubleshooting Tips: Failed Debugging with GDB | MCU on Eclipse
Pingback: Show FreeRTOS Threads in Eclipse Debug View with SEGGER J-Link and NXP S32 Design Studio | MCU on Eclipse
Erich,
I’m using my J-Link with Segger’s FreeRTOS aware debugging to debug an issue with an KDS project for a KL16. My project only has two tasks (in addition to Tmr Svc and IDLE). Debugging seems to work great when I run the application from the debugger. The problem I’m having is when I try to attach the debugger to a running board to troubleshoot an issue. When I do this, only one of my tasks shows up in the Eclipse thread tree. However, if I use the FreeRTOS Task List that is built into KDS, both of my tasks show up. Unfortunately, the Task List doesn’t provide any useful information about where the tasks are currently executing in the code. I’ve made sure all the defines Dave listed above are accounted for in my config. Do you have any idea why the thread tree is missing a task or know how to fix or work around this issue?
Thanks!
Eric
LikeLike
Hi Eric,
It works fine on my side: I can connect/attach to a running application and then halt it, it shows me all threads with the J-Link connection.
Maybe it depends on the version used? I’m using
JLinkARM.dll V6.34b (DLL compiled Aug 13 2018 16:36:16)
If you install the new SEGGER software, it should upgrade the version you have in KDS.
I hope this helps,
Erich
LikeLike
Thanks for the tip, Erich! I updated the J-Link software to 6.34h and also updated the debugger firmware and it seems to have fixed the problem.
LikeLike
Hi Eric,
thanks for confirming that this fixed your problem!
Erich
LikeLike
Hi Erich,
I *think* this is your latest comments on the overflow checking, but I wanted to get your opinion on the FreeRTOS overflow check. If there’s something later, please point me to them.
In FreeRTOSConfig.h, there is the “configCHECK_FOR_STACK_OVERFLOW” which it looks like it should be set to 2 and then add a simple vApplicationStackOverflowHook method to catch the overflow.
Looking at the comments above, it seems like you’re not a great fan of the check but I wanted to ask because a) your comments are over three years old and b) using the stack overflow check helped me to catch and solve a very intermittent bug in my application – which seemed to be when multiple interrupt requests ended up being queued when I halt interrupts to do a Flash erase/write.
When I say “intermittent” it happens every 9 hours or so and doesn’t necessarily take down the system but an extra task (“ied” – which is a surprisingly appropriate name) appears in the task list which leads me to believe the task table is trashed.
I added the check and voila, a stack issue was detected that I could review, add to the stack size and things are working very well now.
I’ll put this on the FreeRTOS and NXP forums, but I thought I’d get your comments first.
Thanx,
myke
LikeLiked by 1 person
Hi Mike,
I’m a great fan of the FreeRTOS Stack Overflow checks, it saved me from many problems :-).
I do use check number 2 too. The check number 1 is not very effective as it only compares the SP at the time of context switch. Option 2 is the way to go as it checks a pattern at the end of the stack area. There is still a chance that your stack overflows without touching this area (e.g. with uninitialized structs or arrays), but chances are rather low.
The only other concern would be performance, but I buy that for better and more secure code.
I hope that clarifies it?
LikeLiked by 1 person
Hi Erich,
I think we’re in agreement on using this – the actual code/task switch timing overhead is quite small but I think it brings in a lot of value. I would say this is a critical feature along with having the TAD options (Task & Queue Lists) to ensure that you FreeRTOS code is good.
I don’t think the cases you cited (unitialized arrays and structures) as being something that would not be caught as the test is for the four words (equal to 0xa5a5a5a5) above the top of the stack, not the top of the stack. Now, in the cases cited, you won’t have overwritten anything beyond the top of the stack, but the stack being blown is detected even though no damage has been done (yet).
Thanx for your time and I’ll post something presently.
myke
LikeLiked by 1 person
Hi myke,
thanks for opening up https://community.nxp.com/t5/Kinetis-Microcontrollers/FreeRTOS-Task-Overflow-Detection/m-p/1262283
I have posted there the use case I mentioned with an overflow not being detected. Such a thing does not happen easily, but as we all know: it happens (and I saw it twice in two different projects). So there are cases where it is not perfect, but this does not reduce the usefulness of stack overflow checks in FreeRTOS at all.
LikeLike