For me the Cortex-Debug Visual Studio extension by marus25 is the standard way to use VSC for embedded development. Another ‘standard’ piece I’m using in many of my projects is the SEGGER RTT.

Outline
RTT is a bidirectional-multi-channel communication protocol which is very fast and can transfer data between the host and the target. Think about a fast UART or data communication over the debug interface or cable. It requires a SEGGER J-Link connection and J-Link compatible probe connected to the target, see https://mcuoneclipse.com/2015/07/07/using-segger-real-time-terminal-rtt-with-eclipse/ for more details about this technology.
RTT Library
To use RTT, you need to add the RTT stubs to your application. See the folder ‘McuLib/SEGGER_RTT’ in my project on GitHub. Make sure you initialize the library with McuRTT_Init():

Then you can print or scan data like from a ‘virtual UART’. E.g. to print data on RTT channel 0 (the default console), you can use:
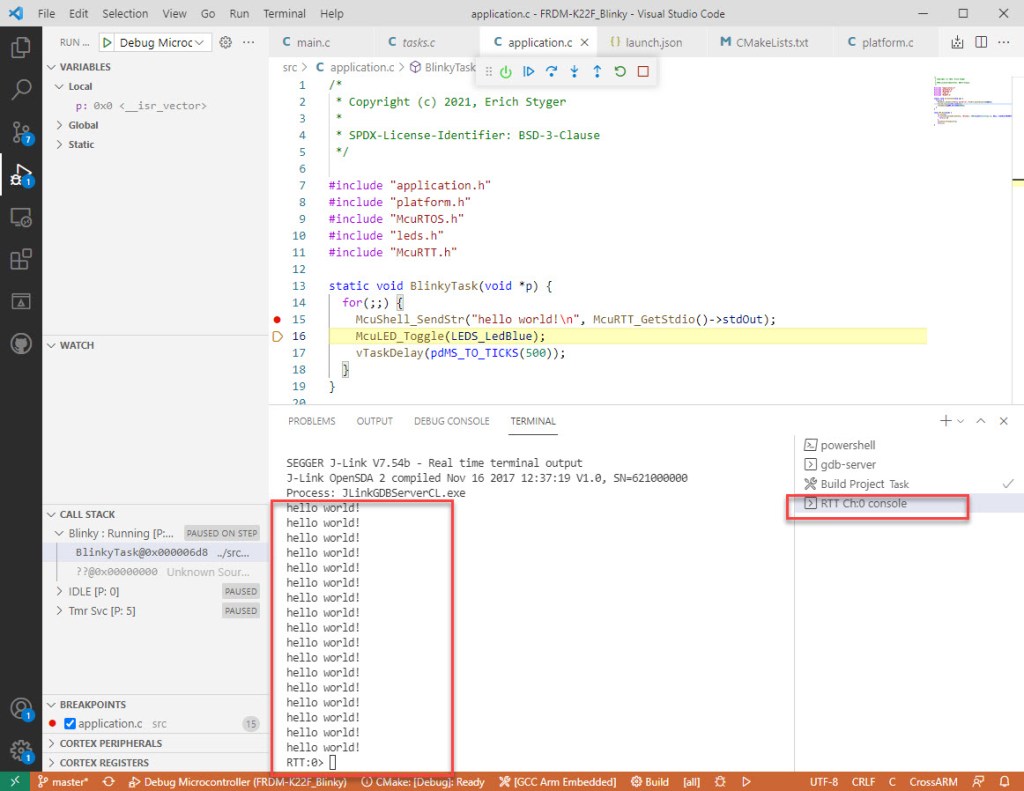
McuShell_SendStr("hello world!\n", McuRTT_GetStdio()->stdOut);With this data gets printed to the RTT console channel and you can use any other RTT (either telnet port or RTT viewer from Segger).

To use RTT within Visual Studio, you need to configure the Launch Configuration.
Launch Configuration
You need to add a “rttConfig” to your launch.json file:

"rttConfig": {
                "enabled": true,
                "address": "auto",
                "decoders": [
                    {
                        "label": "",
                        "port": 0,
                        "type": "console"
                    }
                ]
            }
Usage
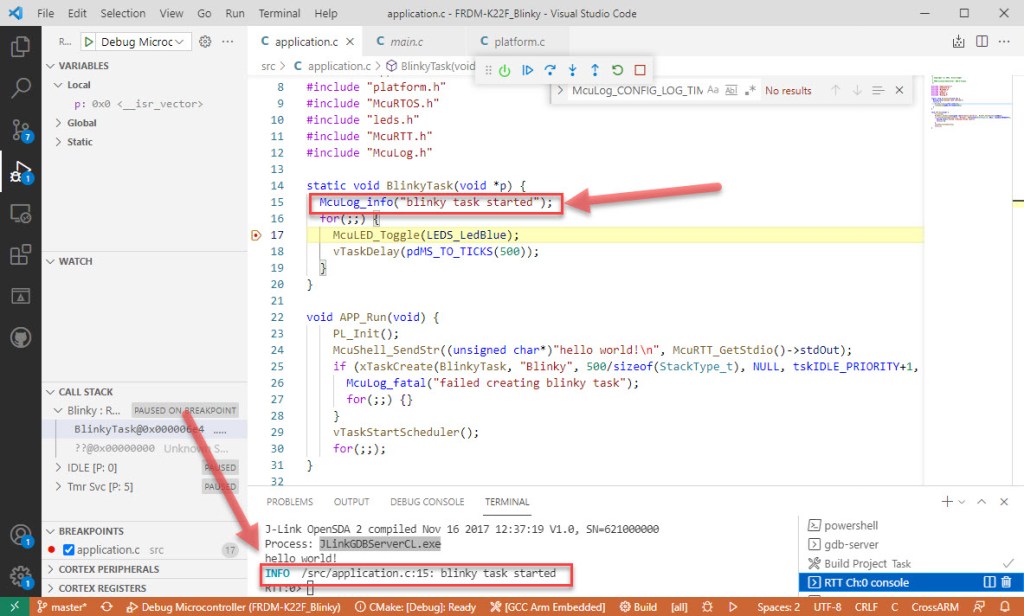
Port 0 is the default console port. If you launch now the debug session, I have now RTT support within Visual Studio Code:

The Visual Studio Code console supports the ANSI terminal color coding as well. Below an example with using the McuLog function:

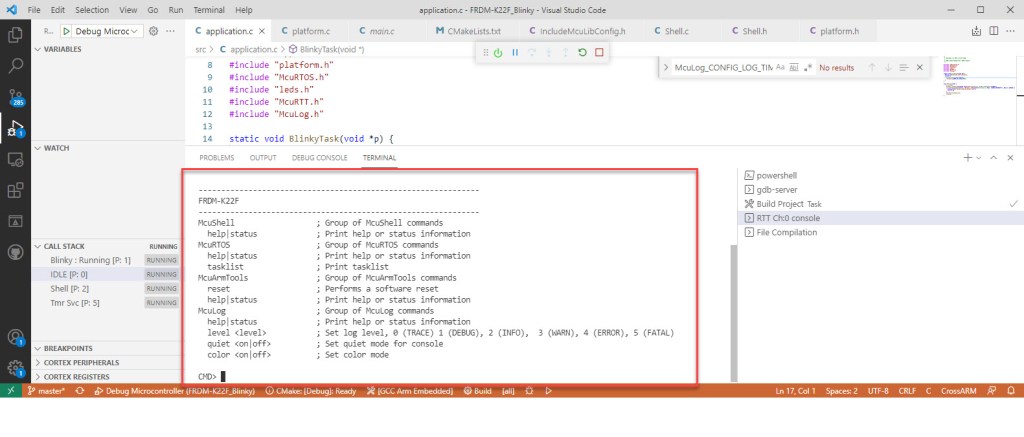
Another usage of RTT is as shell/console interface to the application:

Summary
RTT is very useful: I have a multiple (terminal, binary data, logging) bidirectional data channels to my target(s), and all what I need is a SEGGER debug probe. While the RTT data can be produced or consumed by different clients, it is very useful to have RTT used directly from the Visual Studio Code. I hope you find that as useful as I do.
Happy RTTing 🙂
Links
- Visual Studio Code for C/C++ with ARM Cortex-M: Part 1 – Installation
- Visual Studio Code for C/C++ with ARM Cortex-M: Part 2 – Project
- Visual Studio Code for C/C++ with ARM Cortex-M: Part 3 – Build
- Visual Studio Code for C/C++ with ARM Cortex-M: Part 4 – Debug
- Visual Studio Code for C/C++ with ARM Cortex-M: Part 5 – ToolKit
- Visual Studio Code for C/C++ with ARM Cortex-M: Part 6 – IntelliSense
- Visual Studio Code for C/C++ with ARM Cortex-M: Part 7 – FreeRTOS
- Visual Studio Code for C/C++ with ARM Cortex-M: Part 8 – xPack C/C++ Managed Build Tools
- Visual Studio Code for C/C++ with ARM Cortex-M: Part 9 – RTT
- Visual Studio Code website: https://code.visualstudio.com/
- Using SEGGER RTT: https://mcuoneclipse.com/2015/07/07/using-segger-real-time-terminal-rtt-with-eclipse/
- Discussion about adding RTT to Cortex-Debug: https://github.com/Marus/cortex-debug/issues/456
- McuLog: https://mcuoneclipse.com/2020/06/01/mculog-logging-framework-for-small-embedded-microcontroller-systems/
- Examples on GitHub: https://github.com/ErichStyger/mcuoneclipse/tree/master/Examples/VisualStudioCode

I cant live without RTT! 🙂 seriously its great and makes life so much easier. You can even use it with Tracealyzer streaming mode.
LikeLiked by 1 person
Yes, it is such a great tool. Many developers do not realize that debugging is not only about the probe hardware but about the development tools around it. Tracealyzer is great, so is SystemViewer.
LikeLike
Pingback: Visual Studio Code for C/C++ with ARM Cortex-M: Part 10 – Assembly Stepping | MCU on Eclipse
A very clear and practical guide. The integration of SEGGER RTT with Visual Studio Code using Cortex-Debug is explained in a simple, actionable way.
The config snippet and usage examples make it easy to implement, and the highlight on RTT as a fast alternative to UART via SEGGER J-Link adds strong practical value.
Concise, insightful, and highly useful for embedded developers.
LikeLike