
In “Tutorial: MCUXpresso SDK with Linux, Part 1: Installation and Build with Maked” I used cmake and make to build the SDK application. In this part I’m going to use the command line gdb to debug the application on the board.

Cross-Debugging with GDB
List of this multi-part tutorial:
- Tutorial: MCUXpresso SDK with Linux, Part 1: Installation and Build with Make
- Tutorial: MCUXpresso SDK with Linux, Part 2: Commandline Debugging with GDB
- Tutorial: MCUXpresso SDK with Linux, Part 3: RAM and XiP Code on i.MX RT1064
Outline
In this tutorial I’m going through the steps to install and use the GNU debugger (gdb) from the console to debug the application on the board. I’m running the Ubuntu Linux in a VM on Windows. I’m using the NXP FRDM-K64F board, but the steps are applicable to any other board.

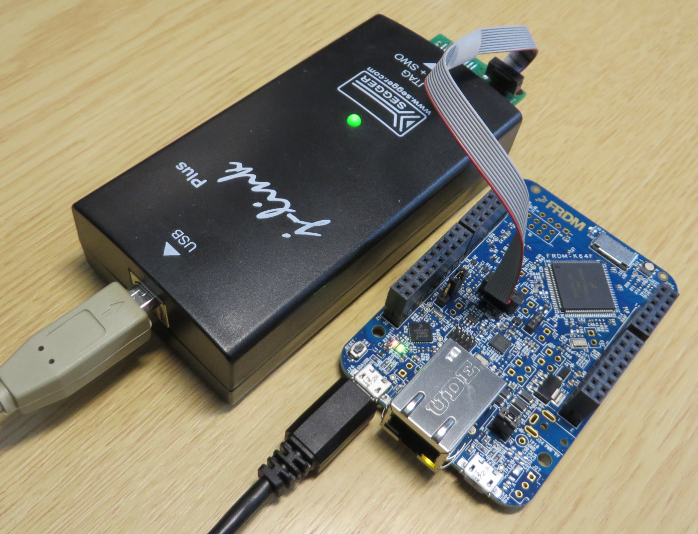
NXP FRDM-K64F
💡 While this tutorial is using gdb and the command line, the Eclipse based MCUXpresso IDE can be used instead too: this way might be easier for most developers as with using Eclipse things are handled automatically.
For an earlier overview about command line debugging with GDB, see “Command Line Programming and Debugging with GDB“.

GDB Debugging Chain
Debug Connections
The board I’m using has a on-board debug circuit (OpenSDA) which can used either as a CMSIS-DAP (with a LPC-Link2), SEGGER J-Link or P&E Multilink. The board has a standard 10pin SWD debug header, so an external debug probe can used too:

Debugging FreeRTOS on NXP FRDM-K64F with P&E Multilink Universal

LPC-Link2 debugging FRDM-K64F
J-Link Hooked Up to recover the K64F
GDB Client
GDB is using a client-server connection: the GDB client is rather generic, while the server part is making the connection to the target and/or implements the connection to the board.
In the case of using Eclipse, the GDB client is integrated with Eclipse:

GDB with GDB Server
But the gdb client in fact is a command line tool like the compiler, and it can be started on the command line too:
$ ~/opt/gcc-arm-none-eabi-8-2018-q4-major/bin/arm-none-eabi-gdb
💡 See “Tutorial: MCUXpresso SDK with Linux, Part 1: Installation and Build with Make” about the GNU and gdb tool installation.
This launches the GDB client which then waits for commands:

Launched GDB
I prefer to run the gdb client in one console window. So for the next parts (server for P&E and SEGGER) I use a different console.
SEGGER J-Link GDB Server
To work with the board using a SEGGER probe, I have to install the J-Link software first. The download is available from https://www.segger.com/downloads/jlink/#J- LinkSoftwareAndDocumentationPack
For my environment I have downloaded the JLink_Linux_V644g_x86_64.deb file. For a RedHat system the .rpm would be the choice to use. To install it:
$ sudo apt install ./JLink_Linux_V644g_x86_64.deb
The files get installed into \opt\bin. I can verify that it works properly with calling the GDB server:
$ /usr/bin/JLinkGDBServer
Which produces something like this:
SEGGER J-Link GDB Server V6.44g Command Line Version

JLinkARM.dll V6.44g (DLL compiled Apr 18 2019 17:15:02)

-----GDB Server start settings-----
GDBInit file:                  none
GDB Server Listening port:     2331
SWO raw output listening port: 2332
Terminal I/O port:             2333
Accept remote connection:      yes
Generate logfile:              off
Verify download:               off
Init regs on start:            off
Silent mode:                   off
Single run mode:               off
Target connection timeout:     0 ms
------J-Link related settings------
J-Link Host interface:         USB
J-Link script:                 none
J-Link settings file:          none
------Target related settings------
Target device:                 Unspecified
Target interface:              JTAG
Target interface speed:        4000kHz
Target endian:                 little

Connecting to J-Link...
Connecting to J-Link failed. Connected correctly?
GDBServer will be closed...
Shutting down...
Could not connect to J-Link.
💡 For how the GDB client and server connection works, see “GDB Client and Server: Unlocking GDB“.
The above output is produced with no J-Link debug probe attached. If using a USB based probe with the VM, make sure the USB port is available to the VM:

Using USB in VirtualBox
With this, the probe is detected:
SEGGER J-Link GDB Server V6.44g Command Line Version

JLinkARM.dll V6.44g (DLL compiled Apr 18 2019 17:15:02)

-----GDB Server start settings-----
GDBInit file:                  none
GDB Server Listening port:     2331
SWO raw output listening port: 2332
Terminal I/O port:             2333
Accept remote connection:      yes
Generate logfile:              off
Verify download:               off
Init regs on start:            off
Silent mode:                   off
Single run mode:               off
Target connection timeout:     0 ms
------J-Link related settings------
J-Link Host interface:         USB
J-Link script:                 none
J-Link settings file:          none
------Target related settings------
Target device:                 Unspecified
Target interface:              JTAG
Target interface speed:        4000kHz
Target endian:                 little

Connecting to J-Link...
J-Link is connected.
Failed to set device (Unspecified). Unknown device selected?ERROR : Failed to set device.

Firmware: J-Link OpenSDA 2 compiled Jun 28 2018 09:44:47
Hardware: V1.00
S/N: 621000000
Checking target voltage...
Target voltage: 3.30 V
Listening on TCP/IP port 2331
Connecting to target...ERROR: Debugger tries to select target interface JTAG.
This interface is not supported by the connected emulator.
Selection will be ignored by the DLL.
ERROR: No CPU core or target device has been selected. Please make sure at least the core J-Link shall connect to, is selected.
ERROR: Could not connect to target.
Target connection failed. GDBServer will be closed...Restoring target state and closing J-Link connection...
Shutting down...
Could not connect to target.
The end of the message indicates that we are trying to connect to a JTAG interface which is not supported. Indeed, the OpenSDA circuit on the FRDM-K64F board only supports SWD. To use SWD, the -if swd option has to be added:
$ /usr/bin/JLinkGDBServer -if swd
In addition to that, the device has to be selected using the -device option:
$ /usr/bin/JLinkGDBServer -if swd -device MK64FN1M0xxx12
💡 The list of devices are available from https://www.segger.com/downloads/supported-devices.php
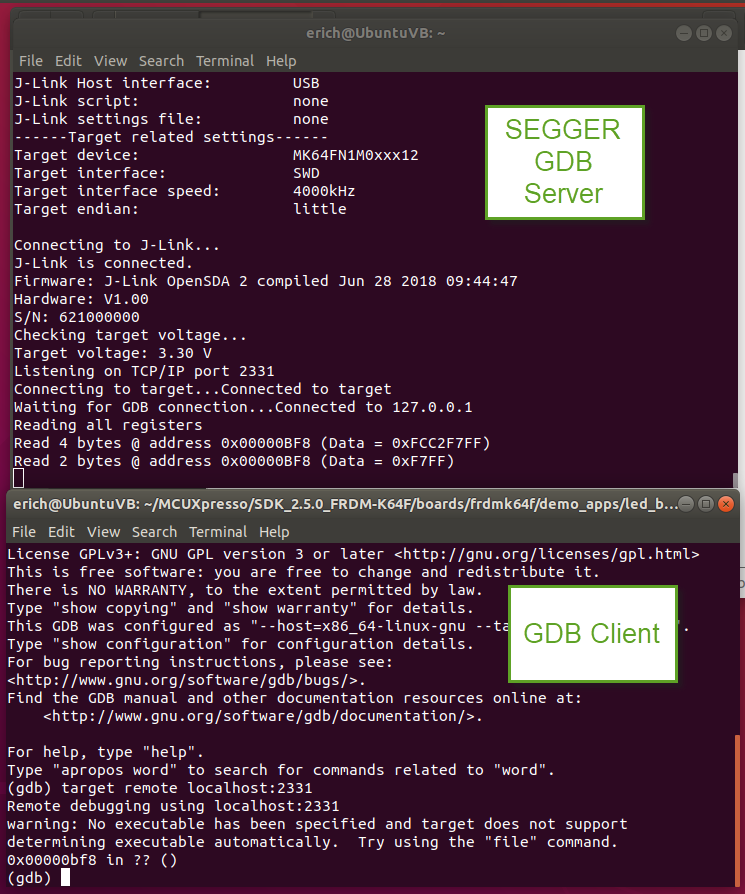
With this, the SEGGER gdb server waits for the client connection:
SEGGER J-Link GDB Server V6.44g Command Line Version

JLinkARM.dll V6.44g (DLL compiled Apr 18 2019 17:15:02)

Command line: -if swd -device MK64FN1M0xxx12
-----GDB Server start settings-----
GDBInit file: none
GDB Server Listening port: 2331
SWO raw output listening port: 2332
Terminal I/O port: 2333
Accept remote connection: yes
Generate logfile: off
Verify download: off
Init regs on start: off
Silent mode: off
Single run mode: off
Target connection timeout: 0 ms
------J-Link related settings------
J-Link Host interface: USB
J-Link script: none
J-Link settings file: none
------Target related settings------
Target device: MK64FN1M0xxx12
Target interface: SWD
Target interface speed: 4000kHz
Target endian: little

Connecting to J-Link...
J-Link is connected.
Firmware: J-Link OpenSDA 2 compiled Jun 28 2018 09:44:47
Hardware: V1.00
S/N: 621000000
Checking target voltage...
Target voltage: 3.30 V
Listening on TCP/IP port 2331
Connecting to target...Connected to target
Waiting for GDB connection...
The SEGGER server is listening on port 2331, so I connect to that port from the gdb client:
(gdb) target remote localhost:2331
GDB Client and Server
From the client, I can reset the target:
(gdb) monitor reset

monitor reset
To load the binary, I use
(gdb) load debug/led_blinky.elf

load binary
followed by loading the symbols (debug information):
(gdb) file debug/led_blinky.elf

loaded symbols
To set a breakpoint on main:
(gdb) b main
and to continue execution:
(gdb) c
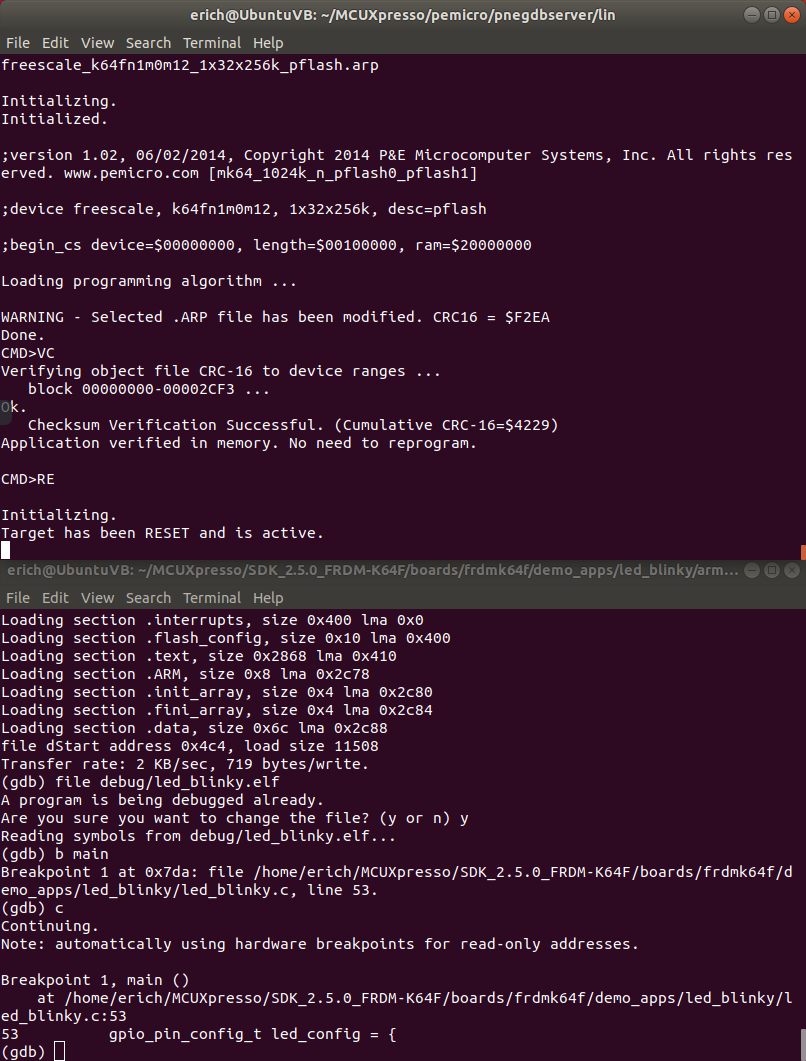
This will hit the breakpoint on main:
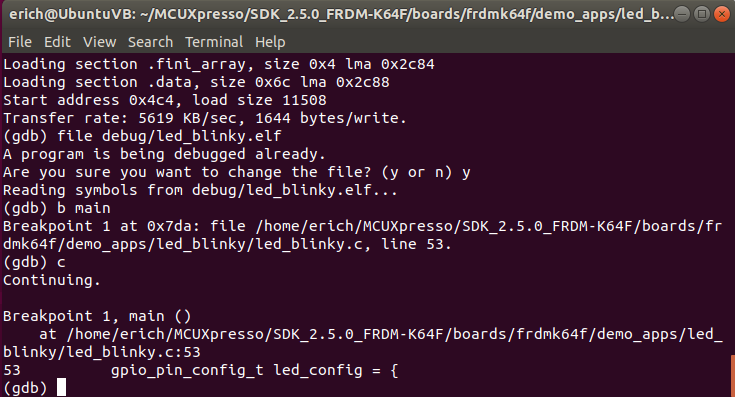
Hit breakpoint on main
GDB has many commands, for example check the following cheat sheets:
- https://darkdust.net/files/GDB%20Cheat%20Sheet.pdf
- http://www.yolinux.com/TUTORIALS/GDB-Commands.html
- https://www.cs.princeton.edu/courses/archive/fall16/cos432/hw2/gdb-refcard.pdf
To quit the gdb debug session:
(gdb) q
PEMicro (P&E)
Everyting said above applies to the P&E (PEMICRO) debug connection too. The P&E debug probes (e.g. Multilink) use their own GDB. That GDB Serve and drivers are integrated in Eclipse (e.g. NXP MCUXpresso IDE)
💡 I recommend to download and install the MCUXpresso IDE for Linux as it comes with the latest P&E plugins and drivers. That way the USB drivers and GDB server don’t need to be installed manually as described below.
Download the P&E Linux drivers from http://www.pemicro.com/opensda/ and unzip the file:
$ gunzip pemicro-other-20181128.zip.tar.gz
untar the archive:
$ tar -xvf pemicro-other-20181128.zip.tar
$ cd pemicro-other-20181128/drivers/libusb_64_32/
untar the drivers:
$ tar -xvf linux_drivers_64bit_58_b181128.tar.gz
Install the drivers
$ cd libusb_64_32
$ sudo ./setup.sh
Now with the USB drivers installed, we need the P&E GDB Server which is inside the P&E Eclipse plugin. The Eclipse plugin is available as direct download from
https://www.pemicro.com/products/product_viewDetails.cfm?product_id=15320151&productTab=1
💡 Again: I recommend to download and install the MCUXpresso IDE for Linux as it comes with the latest P&E plugins.
unzip the jar file (replace the file name with the one you have downloaded):
$ unzip com.pemicro.debug.gdbjtag.pne_3.0.9.201707131553.jar -d pnegdbserver
make the gdb server executable:
$ cd pnegdbserver
$ chmod +x pegdbserver_console
Make sure the P&E Device and driver is available for the Linux VM:
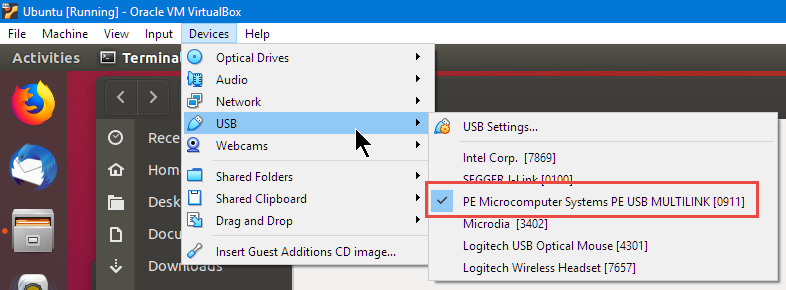
PEMicro USB
The list of supported devices can be displayed with
$ ./pegdbserver_console -devicelist
Then launch the server. Specify -startserver and the -device used. For FRDM-K64F I use
$ ./pegdbserver_console -startserver -device=NXP_K6x_K64FN1M0M12
With this I have the server running:
P&E GDB Server for Arm(R) devices, Version 6.45.00.00
Copyright 2014, P&E Microcomputer Systems Inc, All rights reserved

Loading library /home/erich/MCUXpresso/pemicro/pnegdbserver/lin/gdi/unit_ngs_arm_internal.so ... Done.

Command line arguments: -startserver -device=NXP_K6x_K64FN1M0M12
Device selected is NXP_K6x_K64FN1M0M12
HW Auto-Selected : Interface=USBMULTILINK Port=PEM6B012B   ; USB1 : Multilink Universal FX Rev C (PEM6B012B)
Connecting to target.
P&E Interface detected - Flash Version 10.15
Device is NXP_K6x_K64FN1M0M12.
Mode is In-Circuit Debug.

(C)opyright 2012, P&E Microcomputer Systems, Inc. (www.pemicro.com)
API version is 101

Creating kernel driver for freertos
Server 1 running on 127.0.0.1:7224
Server 2 running on 127.0.0.1:7226
Server 3 running on 127.0.0.1:7228
Server 4 running on 127.0.0.1:7230
Server 5 running on 127.0.0.1:7232
Server 6 running on 127.0.0.1:7234
All Servers Running
Start the gdb client in a different console:
$ ~/opt/gcc-arm-none-eabi-8-2018-q4-major/bin/arm-none-eabi-gdb
The P&E GDB server is listening on port 7224, so I use the following in the gdb client:
(gdb) target remote localhost:7224
From now on, I can use gdb to talk to the target. To reset the target:
(gdb) monitor reset
to load the binary and the symbols, setting a breakpoint on main and run:
(gdb) load debug/led_blinky.elf
(gdb) file debug/led_blinky.elf
(gdb) b main
(gdb) c
Debugging with P&E gdbserver
To terminate the debug session:
(gdb) q
Automation
Instead using the gdb client in interactive mode, I can script it for example to program the application. For example create following script file:
set pagination off
target remote localhost:2331
monitor reset
load debug/led_blinky.elf
quit
gdb script file
Then launch the script file with
$ ~/opt/gcc-arm-none-eabi-8-2018-q4-major/bin/arm-none-eabi-gdb -x gdb_flash.script
Summary
It is possible to use gdb in command line mode on Linux with the NXP MCUXpresso SDK, so this is applicable for a very small setup. It works well for the SEGGER and PEMICRO debug connections, as their driver/installer cares about the USB connection, so using that is fairly easy. Using the gdb command line is very powerful, but is for sure not as intuitive as using an Eclipse IDE as the MCUXpresso IDE, but certainly doable. Using gdb in command line mode on the other side is a good option to do automated testing at least.
Happy debugging 🙂
Links
- Part 1: Tutorial: MCUXpresso SDK with Linux, Part 1: Installation and Build with Maked
- Oracle VirtualBox: https://www.virtualbox.org/
- Ubuntu Linux: https://www.ubuntu.com
- NXP MCUXpresso SDK web site: https://mcuxpresso.nxp.com
- NXP FRDM-K64F Board: https://www.nxp.com/support/developer-resources/evaluation-and-development-boards/freedom-development-boards/mcu-boards/freedom-development-platform-for-kinetis-k64-k63-and-k24-mcus:FRDM-K64F
- GNU Toolchain for ARM Embedded: https://developer.arm.com/tools-and-software/open-source-software/developer-tools/gnu-toolchain/gnu-rm/downloads
- CMake: https://cmake.org/
- MCUXpresso IDE: http://www.nxp.com/mcuxpresso/ide
- J-Link Manual: UM08001
- Command Line Programming and Debugging with GDB
- https://github.com/mbedmicro/pyOCD
- udev rules on Linux: https://github.com/mbedmicro/pyOCD/blob/master/udev/README.md

Pingback: Tutorial: MCUXpresso SDK with Linux, Part 1: Installation and Build with Make | MCU on Eclipse
Pingback: Tutorial: MCUXpresso SDK with Linux, Part 3: RAM and XiP Code on i.MX RT1064 | MCU on Eclipse
Hi Erich, another great post. I currently have OpenOCD set up with Vagrant/VIrtualbox (https://github.com/philmcm/arm-vagrant). Generally works great (with Freedom boards, with LPC-Link2 using Jlink firmware, and with an actual Segger Jlink probe). I’m running virtualbox on Linux with PopOS 18.04 which is a great OS for this type of thing.
What is not working so well is LPC-Link2 using CMSIS-DAP (although CMSIS-DAP works fine on the freedom board). I assume there is some bug in the interaction between Virtual Box and the LPC-Link2 using CMSIS-DAP firmware. I’ve raised this in the NXP forums today and I’m hoping this is something I’ll be able to get working, because this is the preferred configuration for the work I’m doing. I’m also very curious if running MCUXpresso IDE with LPC-Link2 and CMSIS-DAP will work under VirtualBox. I might attempt this sometime from a PC.
BTW, all of the USB manipuations (getting the probe visible through virtual box, getting the udevs set up so you don’t need to use “sudo” is all automatable under Vagrant. For me, it really goes hand-in-hand with Virtualbox.
LikeLike
Hi Phil,
I’m mostly using P&E and SEGGER as their interface is faster and provides more features.
I just tried the new IDE v11 on Ubuntu (with Oracle VM) using the LPC-Link2 as an external probe for the FRDM-K64F, and indeed there might be some kind of problems: I’m running into a timeout.
I’m going to report to NXP, maybe I’m missing something….
LikeLike
Hi Erich, thanks for the info.
I am at the point of USB debugging into VirtualBox (wish me luck). If LPC-Link2 + CMSIS-DAP is problematic under MCUXpresso and VirtualBox (and this is not surprising to me given the issues I had over the past few days with OpenOCD and the same config), ill probably debug the issue with the MCUXpresso configuration. My NXP community post on the issue has not yet been approved by a moderator, but I am hoping that I might be able to socialize my findings with the LPC-Link2 specialists within NXP, and some assistance might be availability when I’m looking more closely into VirtualBox’s USB drivers.
LikeLike
I see your community post is now online: https://community.nxp.com/message/1165135
As for the USB behaviour: I suspect it has something to do with the IDE ‘softloading’ the debug firmware on the LPC-Link2. I have received the hint that loading the firmware (and making it permanent) with lpcscrypt might help. I have not done this yet, but I’ll find out (and potentially write a short article about this for everyone else who might have that problem).
LikeLike
Hi Erich, I *think* i’m using the right mode for the LPC-Link2. I used lpscrypt to load cmsis-dwp firmware and when complete I put jumper JP1 back on. I used the same method when I put Jlink firmware on the LPC-Link2, and it worked fine. Also in my post, the CMSIS-DAP firmware on the LPC-Link2 works fine with OpenOCD, just not with OpenOCD+VirtualBox. That wouldn’t happen if it was using the automatic download mode on the LPC-Link2 (JP1 off)
LikeLike
Did some more testing today and found that the LPC-Link2 with CMSIS-DAP works perfectly with VirtualBox on the Mac. It does not work correctly with VirtualBox on Linux. So I think this is looking very much like a bug in VirtualBox for Linux. So I’ll try to raise a bugtracker with VirtualBox. Thanks Erich.
LikeLike
I gave it a try today too: used LPCScrypt to program the CMSIS-DAP firmware, then kept the JP1 (DFU BOOT) jumper installed, so the board was not softloaded.
But that did not help on my side, so indeed it could be a VMWare problem? Keep me updated 🙂
LikeLike
Hi Erich – I have done more troubleshooting and as a result have raised an issue against the LPC-Link2 firmware (please see https://github.com/ARM-software/CMSIS_5/issues/613). Basically the LPC-Link2 seems to get itself into a knot as a result of the Capabilities Request DAP message when it comes from virtualbox (even though it looks exactly the same, from a USBMON perspective, as the one coming from the host itself). I’m guessing its a subtle timing issue, but we’ll see what the devs have to say. Hopefully it’s fixable.
I have learned many things about CMSIS-DAP through this process, including the fact that the DAPlink development for Kinetis occurs separately (as part of mbed) from the LPC-Link2 CMSIS-DAP firmware (which was basically the reference firmware from the CMSIS-5 work). Also that both these lines basically depend on the Keil MDK USB middleware (although in the mbed development there is an effort to replace with the CMSIS USB code so DAPlink code can compile under GCC). So we have a bit of ground to cover before DAPlink can be considered free software.
I’ll keep you posted on any fix for the LPC-Link2 issue.
LikeLike
Thanks for that upadate!
LikeLike
Hi Erich, I’m just getting started with the Kinetis MCUs, and found your website and tutorials. In this series, on developing with command line tools on Linux, you base the target system on one of the FRDM boards, and use third party debugger tools. My “learning project” is a bare bones KE02 based board, with a 10 pin SWD connector. My thought is to use the SDA processor to drive the SWD connector on my board. Have you tried anything similar?
Thanks for the great tutorials!
LikeLike
Hi Craig,
thank you :-). Is your board a FRDM-KE02 one? If yes,. I recommend to program the OpenSDA as a J-Link (you can load a J-Link firmware on the board). The standard CMSIS-DAP/DAPlink firmware is rather slow and not as powerful as the SEGGER J-Link (or P&E) firmware, so better you change the firmware. If you are having a true ‘bare’ board (maybe you meant this) without an OpenSDA, then I recommend you use a SEGGER J-Link EDU Mini ($20) which is an excellent choice. It can be used for non-commercial/hobby/education work. If you are doing commercial work, it is more than worthwile to buy a J-Link or P&E Multilink.
There is as well the $20 LPCLink2, but I did not manage to get it working in command-line mode under Linux. It works very well with the IDE, so you might consider this too. As another thought: you can script and use the IDE in command line mode too. This is a bit more ‘heavy’, but well supported too.
I hope this helps,
Erich
LikeLike