Working with low power modes can be challenging. It can severely affect debugging capabilities of a microprocessor or microcontroller. I ported a FreeRTOS application using the Tickless Idle Mode to the NXP i.MX RT1064 board, and all of a sudden, the board was unresponsive to any debugger connection. Luckily the board was not really bricked, but it took me while to find a way to recover it. So for when you end up in a situation with a ‘bricked’ i.MX RT1064 board, this article might be helpful for you to recover it.

i.MX RT1064-EVK Board
What I did with using the FreeRTOS tickles idle mode to reduce the power consumption of the board. In that mode, the RTOS calls a hook in which I can put the CPU or board into a low power mode, and it will be woken up by the next interrupt, either the tick interrupt or any other interrupt. The simplest way to do this is using the WFI (Wait For Interrupt) instruction:
/*
** ===================================================================
**     Description :
**         Used in tickless idle mode only, but required in this mode.
**         Hook for the application to enter low power mode.
**     Parameters  :
**         NAME            - DESCRIPTION
**         expectedIdleTicks - expected idle
**                           time, in ticks
**     Returns     : Nothing
** ===================================================================
*/
void McuRTOS_vOnPreSleepProcessing(portTickType expectedIdleTicks)
{
  (void)expectedIdleTicks; /* not used */
  __asm volatile("dsb");
  __asm volatile("wfi"); /* wait for interrupt: the next interrupt will wake us up */
  __asm volatile("isb");
}
That worked, but only until I increased the tick and task frequency. Suddenly I was not able anymore to gain access to the CPU with the debugger :-(.
💡 Update: after doing some more experiments, the behaviour seems to depend on if the board was going through a POR (Power-On Reset) with a following debug access. It still might be possible to enter debug mode if the board did not go through a power cycle.
Not able to connect with the Debugger
The symptoms were that the debug probe was not able to talk to the core, andd it received an invalid or wrong CpuID. In case you might see something similar, here are console outputs in Eclipse for the different debug probes I’m using (LinkServer, P&E and SEGGER):
The LPC-Link2 or ARM DAPLink (on-board default debug interface on the i.MX RT1064-EVK): might report something about a wrong CpuID:
Using memory from core 0 after searching for a good core
connection failed - Ep(03). Invalid ID for processor... Retrying
Using memory from core 0 after searching for a good core
On debug connection reset using system reset
Failed on connect: Ep(03). Invalid ID for processor.
Connected&Reset. Was: NotConnected. DpID: 0BD11477. CpuID: 00000FFF. Info: <None>
Last stub error 0: OK
Last sticky error: 0x0 AIndex: 0
Debug bus selected: MemAp 0
DAP Speed test unexecuted or failed
Debug protocol: SWD. RTCK: Disabled. Vector catch: Disabled.
(100) Target Connection Failed
A Segger J-Link might not find the core in the Coresight setup:
Connecting to J-Link...
J-Link is connected.
Device "MIMXRT1064DVL6A" selected.
Firmware: J-Trace PRO V1 Cortex-M compiled Oct 25 2018 11:48:19
Hardware: V1.00
S/N: 751000175
Feature(s): RDI, FlashBP, FlashDL, JFlash, GDB
Checking target voltage...
Target voltage: 3.30 V
Listening on TCP/IP port 2331
Connecting to target...InitTarget() start
InitTarget()
_TargetHalt: CPU halted
InitTarget() end
Found SW-DP with ID 0x0BD11477
Scanning AP map to find all available APs
AP[1]: Stopped AP scan as end of AP map has been reached
AP[0]: AHB-AP (IDR: 0x04770041)
Iterating through AP map to find AHB-AP to use
AP[0]: Skipped. Invalid implementer code read from CPUIDVal[31:24] = 0xFF
InitTarget() start
InitTarget()
_TargetHalt: CPU halted
InitTarget() end
Found SW-DP with ID 0x0BD11477
Scanning AP map to find all available APs
AP[1]: Stopped AP scan as end of AP map has been reached
AP[0]: AHB-AP (IDR: 0x04770041)
Iterating through AP map to find AHB-AP to use
AP[0]: Core found
AP[0]: AHB-AP ROM base: 0xE00FD000
CPUID register: 0x411FC271. Implementer code: 0x41 (ARM)
Found Cortex-M7 r1p1, Little endian.
FPUnit: 8 code (BP) slots and 0 literal slots
CoreSight components:
ROMTbl[0] @ E00FD000
ROMTbl[0][0]: E00FE000, CID: B105100D, PID: 000BB4C8 ROM Table
ROMTbl[1] @ E00FE000
ROMTbl[1][0]: E00FF000, CID: B105100D, PID: 000BB4C7 ROM Table
ROMTbl[2] @ E00FF000
ROMTbl[2][0]: E000E000, CID: B105E00D, PID: 000BB00C SCS-M7
ROMTbl[2][1]: E0001000, CID: B105E00D, PID: 000BB002 DWT
ROMTbl[2][2]: E0002000, CID: B105E00D, PID: 000BB00E FPB-M7
ROMTbl[2][3]: E0000000, CID: B105E00D, PID: 000BB001 ITM
ROMTbl[1][1]: E0041000, CID: B105900D, PID: 001BB975 ETM-M7
ROMTbl[1][2]: E0042000, CID: B105900D, PID: 004BB906 CTI
ROMTbl[0][1]: E0040000, CID: B105900D, PID: 000BB9A9 TPIU-M7
ROMTbl[0][2]: E0043000, CID: B105F00D, PID: 001BB101 TSG
Cache: Separate I- and D-cache.

I-Cache L1: 32 KB, 512 Sets, 32 Bytes/Line, 2-Way
D-Cache L1: 32 KB, 256 Sets, 32 Bytes/Line, 4-Way
ERROR: Could not find core in Coresight setup
ERROR: Could not connect to target.
Target connection failed. GDBServer will be closed...Restoring target state and closing J-Link connection...
Shutting down...
Could not connect to target.
Please check power, connection and settings.

Server has been shut down.
A P&E Multilink Universal might not be able to download the .ARP file for programming:
Initializing.
Target has been RESET and is active.
CMD>CM C:\nxp\MCUXpressoIDE_10.3.0_2200\ide\plugins\com.pemicro.debug.gdbjtag.pne_3.9.2.201812122206\win32\gdi\P&E\supportFiles_ARM\NXP\iMX\nxp_imxrt1064_1x32x1meg.arp

Initializing.
Initialized.

;version 1.00, 08/29/2018, Copyright 2018 P&E Microcomputer Systems, www.pemicro.com

;device nxp, imxrt1064, 1x32x1meg,

;begin_cs device=$70000000, length=$00400000, ram=$00000000

Loading programming algorithm ...
Error loading .ARP file : C:\nxp\MCUXpressoIDE_10.3.0_2200\ide\plugins\com.pemicro.debug.gdbjtag.pne_3.9.2.201812122206\win32\gdi\P&E\supportFiles_ARM\NXP\iMX\nxp_imxrt1064_1x32x1meg.arp at address 00000000
Error loading programming algorithm - load aborted.
Error occured during Flash programming.
PE-ERROR: Error downloading to the device.
Disconnected from "127.0.0.1" via 127.0.0.1
Disconnected from "127.0.0.1" via 127.0.0.1
Target Disconnected.
In all cases, it means the debugger was not able to get access to the core.
WFI: Wait for Interrupt
In my case, the problem occurred with using ‘WFI’ which is used in tickless idle mode of FreeRTOS. ‘WFI’ is the ‘Wait for Interrupt’ ARM instruction: it will suspend the core and saves power with the next interrupt waking it up and continue execution

WaitForInterrupt
That worked fine for me if the RTOS was not often going into low power mode. But as soon as the core was entering low power mode say with about 100 Hz, the debugger was not able to connect any more. My thinking is that the debugger was able to talk to the core, but not able to finish the sequence to halt until the core again executed again a WFI: or in other words: the debug connection needs more than 10 ms to halt the core. If the core enters low power mode during the connection sequence, the debugger will fail to connect.
This is a problem I have not seen on any other Cortex-M I’m using, and probably because the i.MX RT is executing much faster (600 MHz!) than the others I’m using.
I tried different ways to recover the board (e.g. trying to erase the FLASH from the IDE), but did not work. I tried to use the SEGGER J-Link command line tool to gain access to the core: that did not succeed.
Update:
The i.MX RT1064 has a GPC (General Power Controller).
Calling
CLOCK_SetMode(kCLOCK_ModeRun);
at the start of the application which does
typedef enum _clock_mode_t
{
    kCLOCK_ModeRun = 0U,  /*!< Remain in run mode. */
    kCLOCK_ModeWait = 1U, /*!< Transfer to wait mode. */
    kCLOCK_ModeStop = 2U, /*!< Transfer to stop mode. */
} clock_mode_t;

/*!
 * @brief Setting the low power mode that system will enter on next assertion of dsm_request signal.
 *
 * @param mode  Which mode to enter, see \ref clock_mode_t.
 */
static inline void CLOCK_SetMode(clock_mode_t mode)
{
    CCM->CLPCR = (CCM->CLPCR & ~CCM_CLPCR_LPM_MASK) | CCM_CLPCR_LPM((uint32_t)mode);
}
actually prevents the CPU to enter the WAIT mode, and in this stage the problem does not happen, because simply the WAIT mode is disabled. See https://community.nxp.com/thread/492841#comment-1099054.
By default the CLPCR[LPM] bit is set. Chapter 13.6.3.2.1 says that in that case I have to configure the ‘alternative interrupt controller’ should be enabled. I read it that the NVIC of the ARM core is disabled. That would explain why for example the SysTick does not run any more in my RTOS.
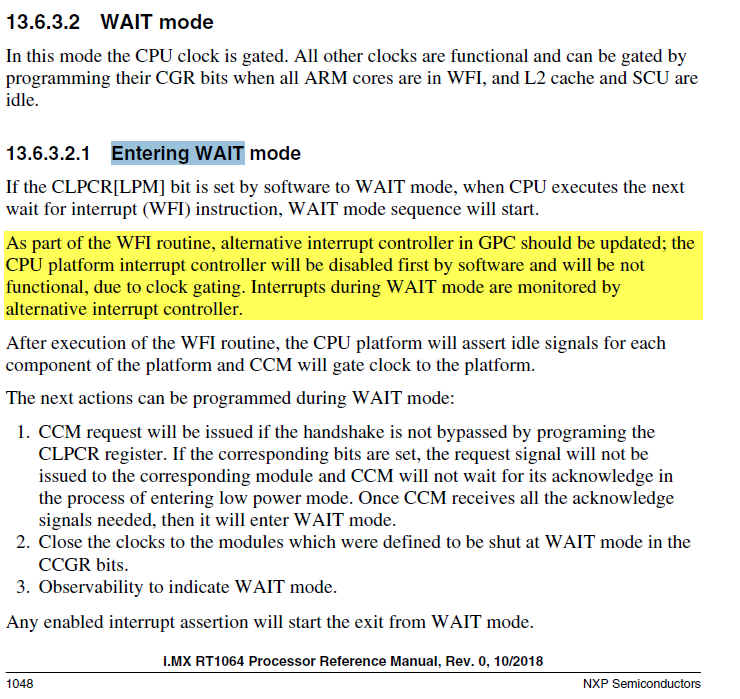
entering wait mode
Recovery
💡 Another (easier) way to recover is the following: 1) make sure no debug connection is active. b) power-on the board, and wait until it goes into WAIT mode (you won’t be able to access it in this state). c) Press the SW02 button on the board for 2 seconds, then release it. d) the board should now restart, and somehow the SW02 press has set the CPU into a state which prevents entering WAIT mode. e) Now I’m able to debug the board again.
So how to regain access with the debugger to the core? The other idea I had was to boot the processor in a different mode from a different memory, preventing it to execute the code with the WFI in it. The NXP i.MX RT1064 offers three different boot modes which can be configured using switches on the board:
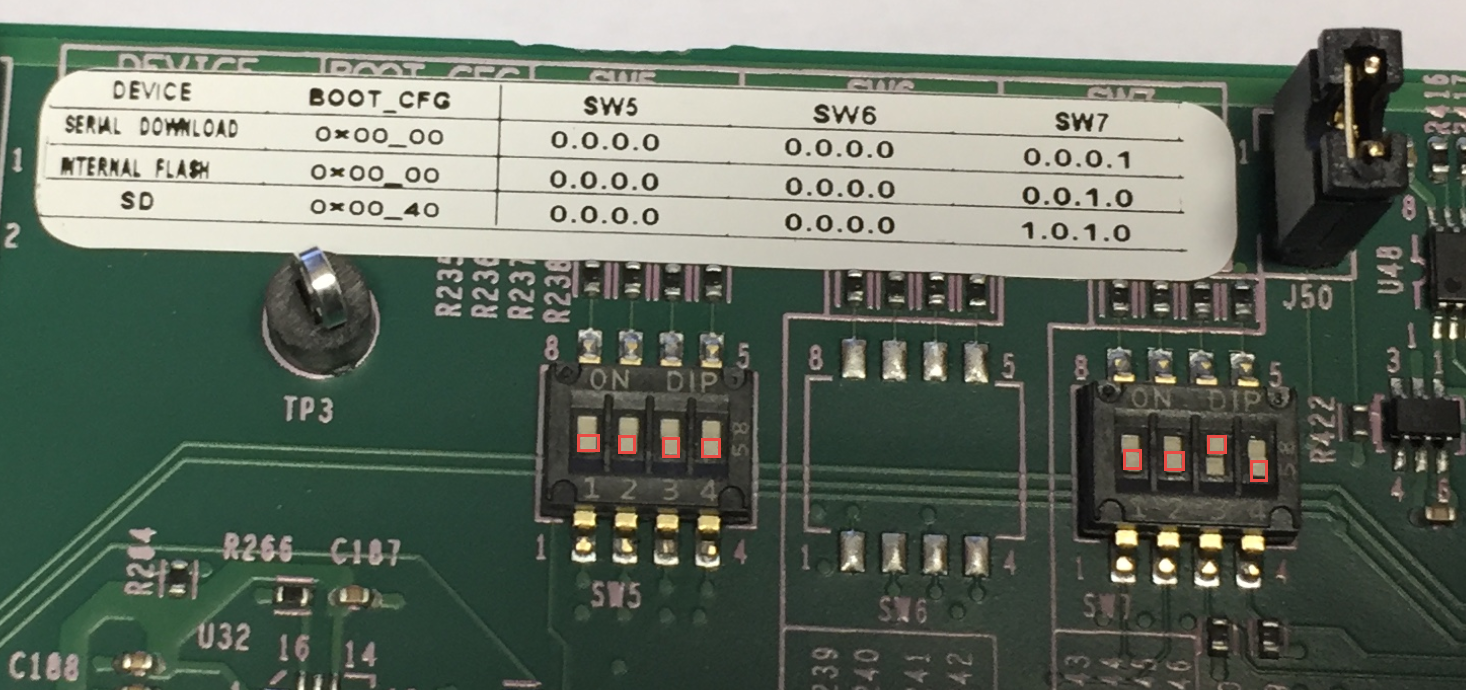
Board Default Boot Configuration
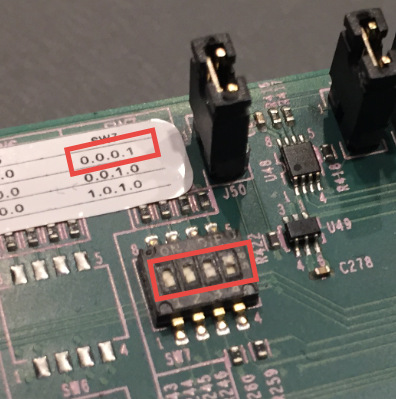
I changed the board boot mode to ‘serial download’ mode (SW7 set to 0001).

SW7 set to serial download
With this the processor is executing the boot ROM code, and I was able to attach with the debugger again.

Attached to boot ROM Code
However, the internal flash memory at 0x7000’0000 was not accessible in this mode, and I was not able to erase it or access it directly.
Boot Utility to the Rescue!
That DIP switch for the ‘Serial Download’ executes a bootloader on the NXP i.MX RT1064. That bootloader communicates over the USB port of the MCU with a special tool on the host which can be used to download new firmware. I have used that approach for other microcontrollers (see “Getting Started: ROM Bootloader on the NXP FRDM-KL03Z Board“), but not yet for the i.MX.
Setting up such a utility and using it is not that simple. What came to the rescue was the ‘NXP Boot Utility‘ of Jay Heng: this tool enabled me in a few steps to regain access to the board.
- Follow the instructions from https://github.com/JayHeng/NXP-MCUBootUtility/
- Boot the board in serial download mode with SW7 set to 0001:
SW7 set to serial download
- The board should enumerate as USB HID device with vID 0x1FC9 and PID 0x0135
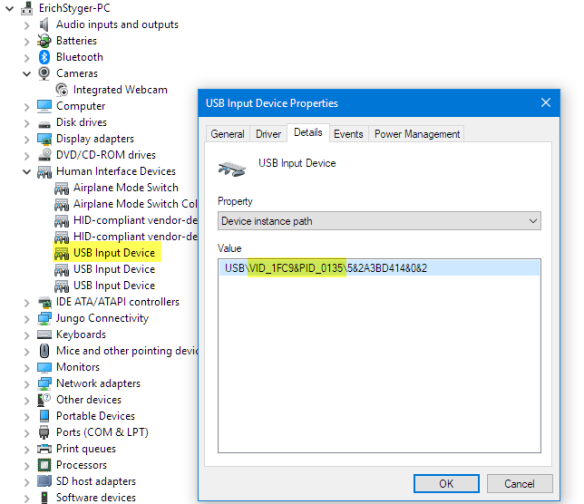
USB HID Device
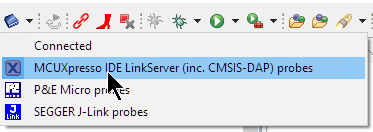
- Start NXP-MCUBootUtility-1.0.0\bin\NXP-MCUBootUtility.exe. Select the device and using USB-HID. It shall list the VID and PID discussed above. If not, check your USB connection.

MCU NXP Boot Utility
- Switch to ‘Master’ mode:
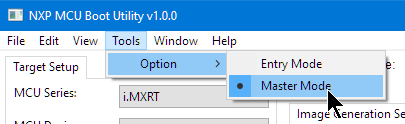
Master Mode
- Disable the ‘One Step’ option (so we have full control over all steps) and connect to the ROM:
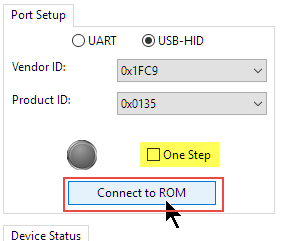
Connect to ROM
- With this we should be connected to the ROM, and you can see the executed host bootloader program (sdphost) commands in a separate console window.
Connected to ROM
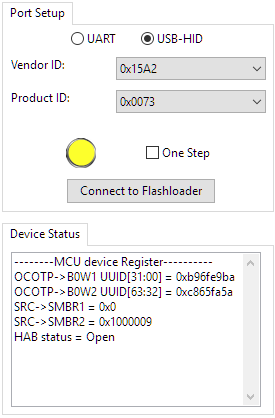
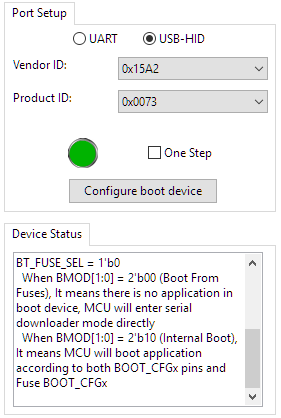
- Next click the ‘Connect to Flashloader’ button, the status shall now be green:

Connected
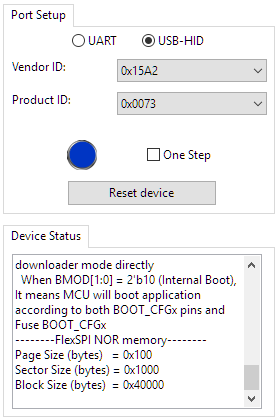
- Press the ‘Configure boot device’ button and the status shall change to blue. Notice the section about the FlexSPI NOR memory configuration in the Device Status. Only with such settings the tool is able to operate properly with the internal FLASH and will use an offset of 0x0 (otherwise you have to specify an offset or address of 0x70000000):

Boot Device Configured
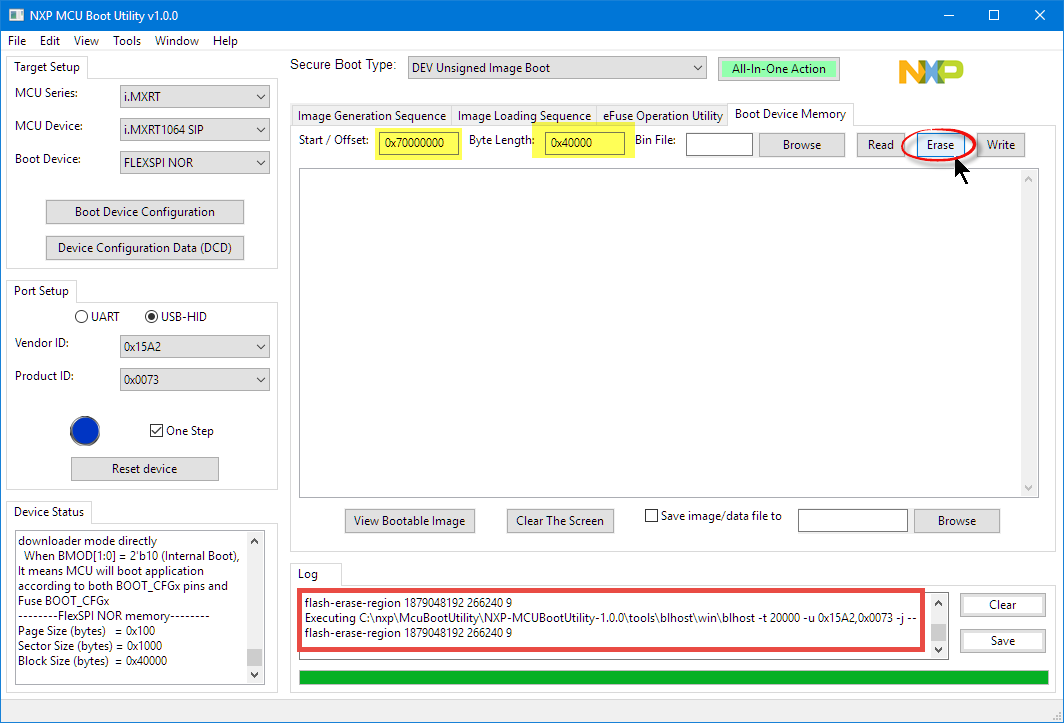
- Go to the ‘Boot Device Memory’ tab. Configure the start address as 0x70000000 with size 0x400000 and press Erase. You can verify the correct command in the Log (if it fails, see trouble shooting section below):

Erasing the flash
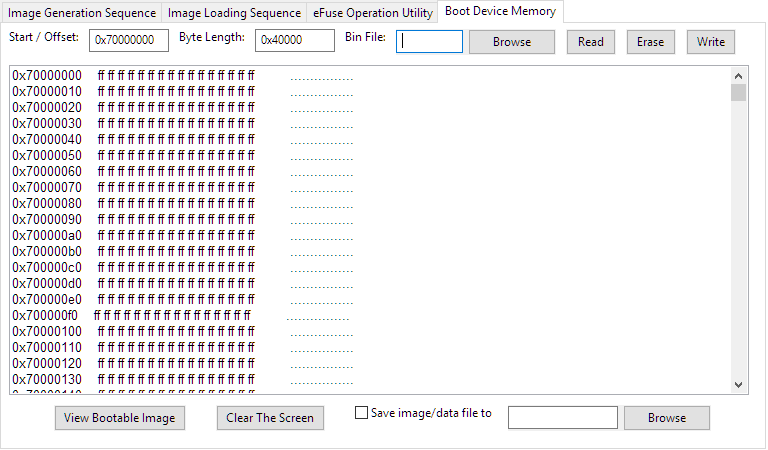
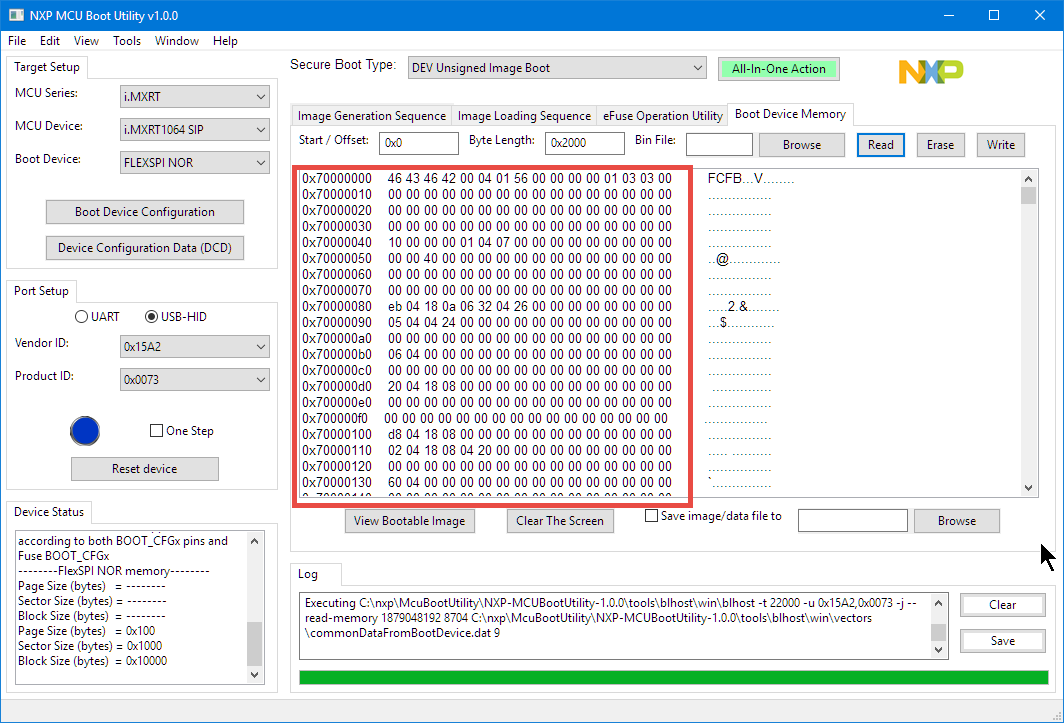
- This now should have erased the memory area specifed. Use the ‘Read’ button to verify this (if this fails, see trouble shooting section below):
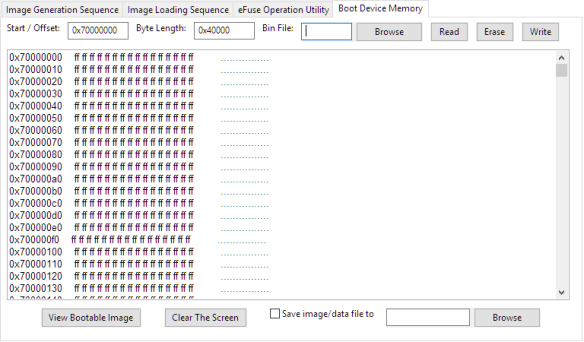
Erased internal flash memory
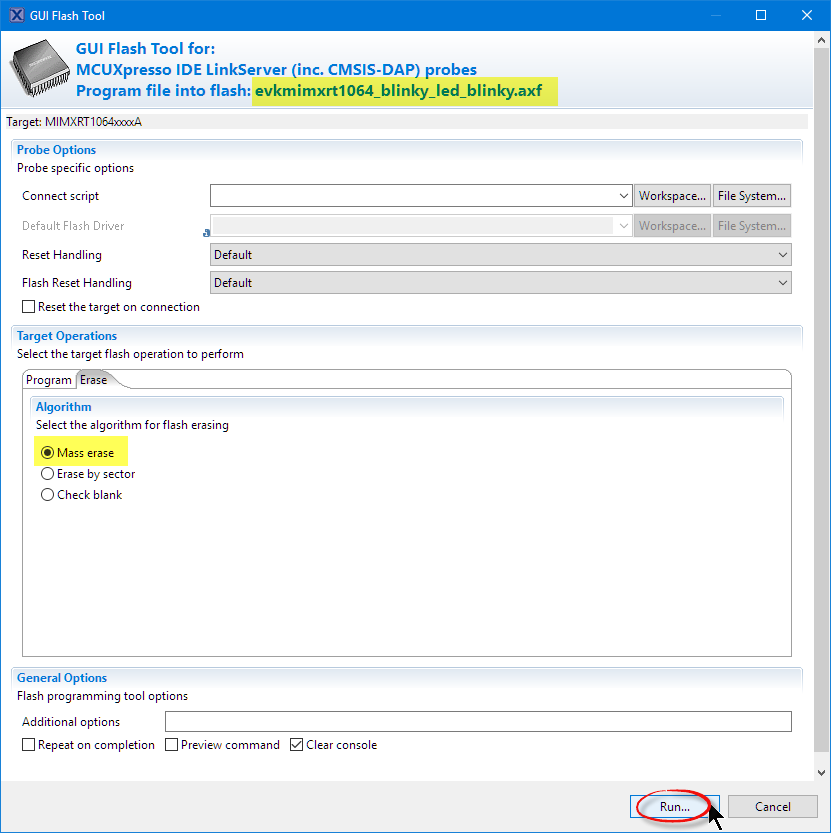
- This has set all the flash memory cells to 0xffff’fffff. What is missing is that the correct Flash descriptor is programmed. This is done with the MCUXpresso IDE. Open the GUI Flash Tool in the MCUXpresso IDE with a working project (e.g. blinky) selected for the RT1064:
GUI Flash Tool
- Then do a mass erase (note that this will do a mass erase *and* program the correct header):

Mass Erase with Flash Header
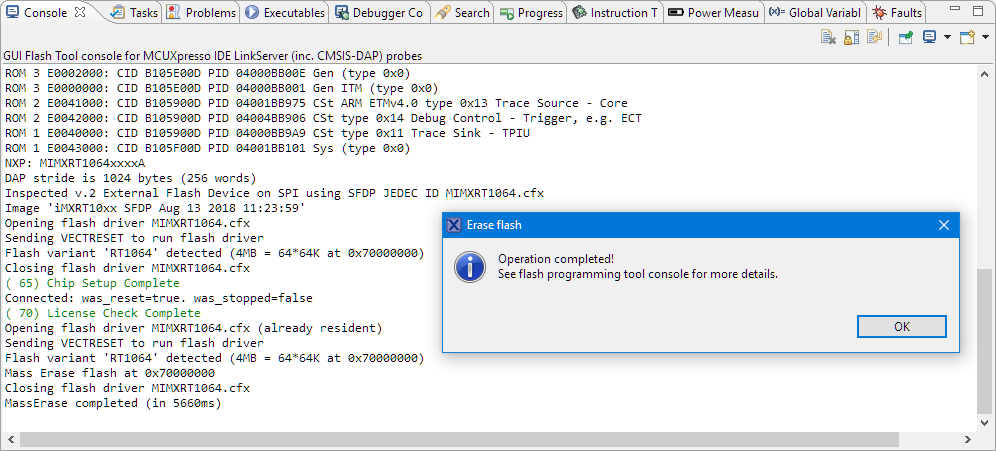
- This should succeed as below:
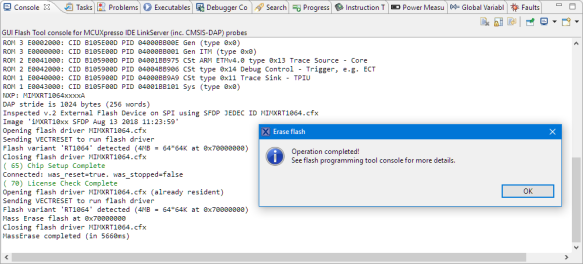
Flash Erase completed
- Checking the flash memory with the Utility should show now that it has the correct header:
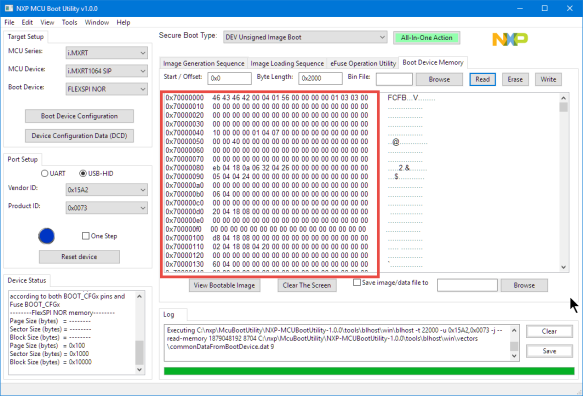
Correct Flash Header Present
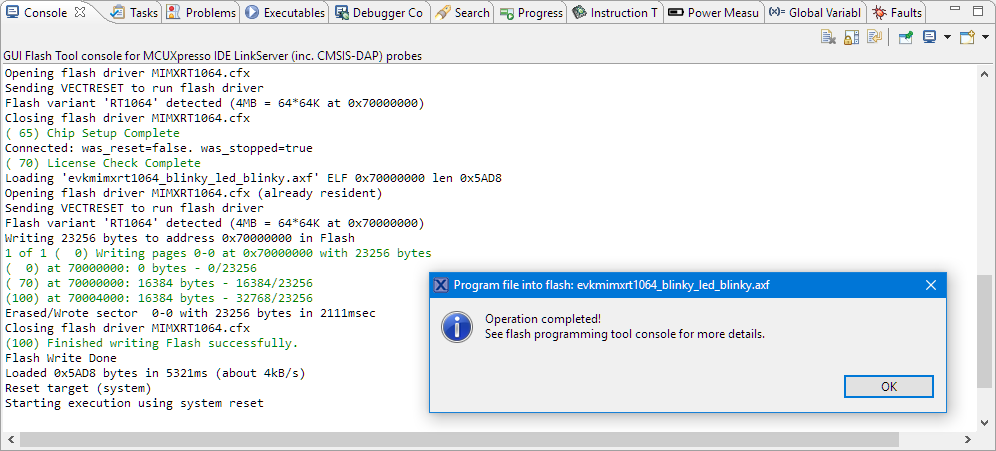
- Now program a ‘known-good’ application (e.g. a blinky) to the MCU using the MCUXpresso GUI Flash programmer:
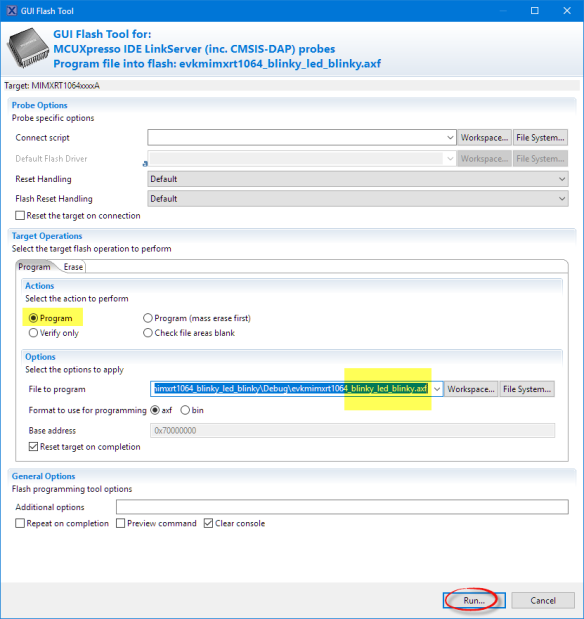
Programming Application
- This should succeed:
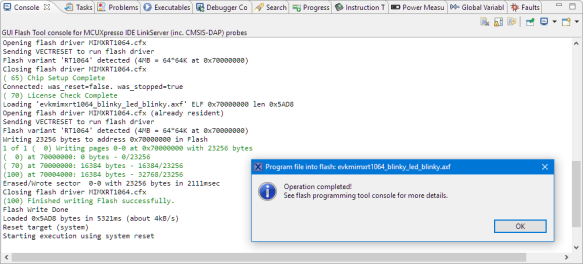
Sucessful Flash Programming
- Now set SW7 back to boot from internal FLASH (SW7: 0010), reset the board, and the programmed application (e.g. blinky) shall run.
- Now the board is recovered again 🙂


Troubleshooting
In some case the Boot Utility seems not to send the correct parameters. You can see this in the log and in the console output as below:
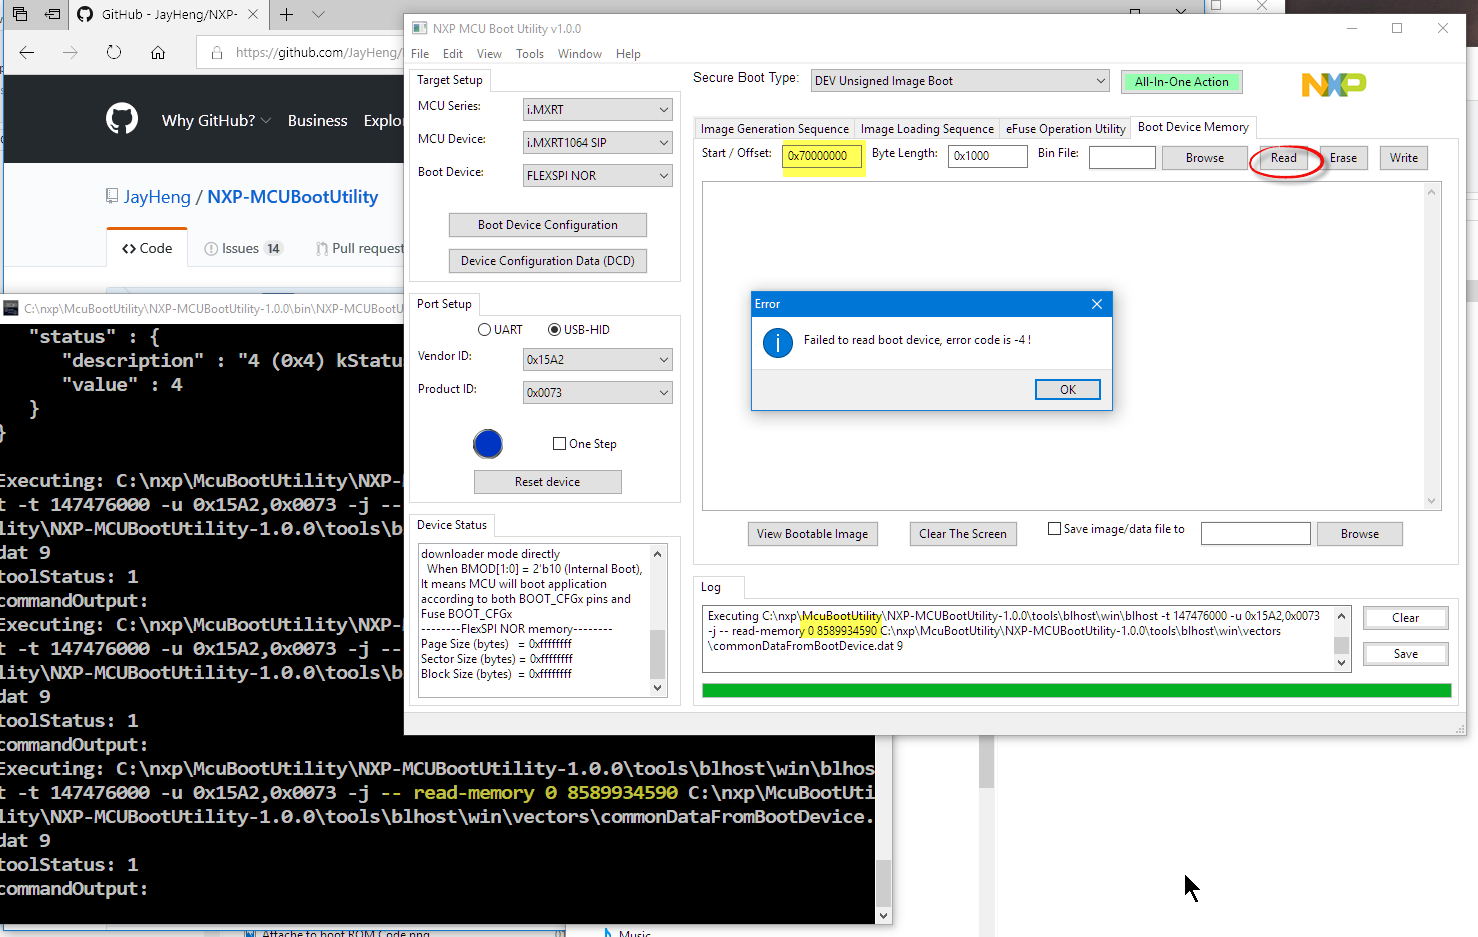
wrong read memory
In that case, copy the command line from the Log, paste it to a System Console, e.g. I used following (while the utility is still running):
C:\nxp\McuBootUtility\NXP-MCUBootUtility-1.0.0\tools\blhost\win\blhost -t 6573000 -u 0x15A2,0x0073 -j -- flash-erase-region 0x70000000 0x40000 9
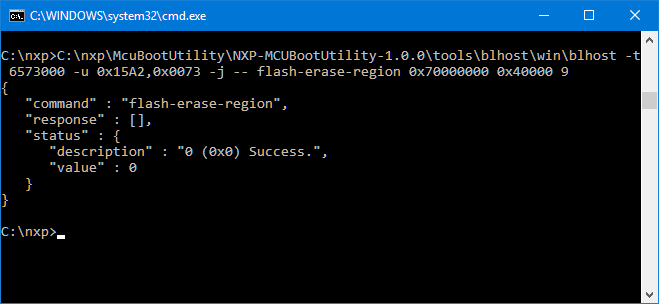
Executing Flash Erase from Cmd.exe
Suggestion: Safety Belt
What I recommend for any other low-power experiments is to add a kind of safety belt code: after power-on the system waits (and blinks) some time to allow me to connect to it before it goes into the ‘danger’ zone with low-power modes:
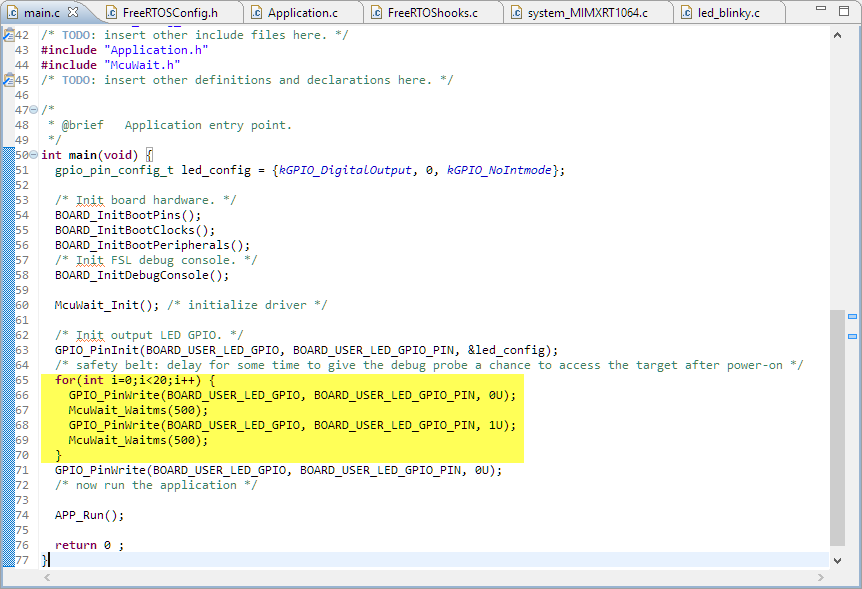
Safety Belt Code
This allows me to catch the target in case of problems. Such a code might be even helpful in production systems, e.g. doing this if a push button is pressed during power-on.
Summary
Dealing with ‘flash-less’ devices can be tricky. While the NXP i.MX RT1064 has an on-chip device, it is really like an internally bonded QSPI flash device. In order to have the CPU booting from it, it requires a well-defined header (Flash description) placed in it. If this header is corrupted, the application misbehaving or if the memory is erased, the debugger might not be able to access the MCU any more. This happened for me with a FreeRTOS application executing the WFI instruction so fast that it was not possible any more to access the MCU. A combination of MCUXpresso IDE, the i.MX RT1064 bootloader (serial loader) and the NXP Boot Utility finally helped me to get ‘back to normal’. In case you ever end up in the same situation, the above steps and descriptions hopefully will help you.
💡 I recommend to have different debug probes (NXP LPC-Link2, Segger J-Link and P&E Multilink) at hand in combination with the NXP MCUXPresso IDE and the MCU Boot Utility.
Happy Debugging 🙂
Links
- First Steps with the NXP i.MX RT1064-EVK Board
- Low Power with FreeRTOS: Tickless Idle Mode
- NXP Boot Utility by Jay Heng: https://github.com/JayHeng/NXP-MCUBootUtility
- Forum discussion about WFI on i.MX RT: https://community.nxp.com/thread/492841#comment-1099054

I normally add a “self destruct” ability. I pick two pins that are safe to play with, something like two inputs from switches or two chip select outputs. On boot I run a short routine that makes one pin an output and toggles it while watching the other pin. If I see they’re connected, I call the IAP routine for bulk erase. Problem solved.
LikeLike
That’s a great idea too!
LikeLike
Hi Erich,
Great post! As usual!
Ivan and others ported NuttX to i.MX RT 10xx family few months ago and now Dave Marples is creating a board to run NuttX powered by i.MX RT 1020 with many features: WiFi/BT, MMC/SD, LCD, Ethernet, etc.
I don’t have a i.MX RT board yet, but soon I will try to get one to jump on the party.
HNY,
Alan
LikeLike
As always, Erich, your post is well researched, detailed, informative and *the* go-to guide for solving these practical problems.
LikeLike
Thanks, I only try to solve practical problems I have, with the hope I can help others too 🙂
LikeLike
HI Erich,
I’ve got a RT1064 EVK also, and I was playing with it last night and maybe bricked it. It was working fine, then all of a sudden it the onboard debug link is never seen by my PC. (and I also power cycled everything, no joy).
I tried the two seconds on sw2, also no help.
What does it take to enable the 10 pin header so I can use my Segger?
Brynn
LikeLike
Hi Brynn,
you have to use that big 20 pin header (see the section ‘External Debugger probes’ in https://mcuoneclipse.com/2018/12/28/first-steps-with-the-nxp-i-mx-rt1064-evk-board/).
Depending on your J-Link, you need an adapter (or at least jumper wires) from the small to the big connector. See the one I have used from Adafruit in https://mcuoneclipse.com/2017/12/16/mcuxpresso-ide-v10-1-0-with-i-mx-rt1052-crossover-processor/
I hope this helps,
Erich
LikeLike
Can I just use a 20 pin cable direct from the J-link to the 2×10 connector without the adapter?
Brynn
LikeLike
Yes, that’s the simplest solution.
LikeLike
Hi Erich,
Back to working on my RT1064, and I am still having problems getting it to debug with anything, including the J-link. The J-link gives a lot of hopeful messages, but in the end it isn’t working. Is there a jumper I need to cut to isolate the onboard LPC link-server like has to be done on the FRDM-k22 boards to enable J-link (really the JTAG connector) debugging?
Brynn
LikeLike
Hi Brynn,
yes, there are isolation jumpers, see ‘External Debug Probes’ in https://mcuoneclipse.com/2018/12/28/first-steps-with-the-nxp-i-mx-rt1064-evk-board/
I hope this helps,
Erich
LikeLike
I have had similar issues when setting up a LPUART with DMA. Something I did causing the debugger to stop working and I could not reconnect with any debugger.
I ended up downloading NXP’s FLASHLOADER for RT1064:
https://www.nxp.com/webapp/sps/download/license.jsp?colCode=FLASHLOADER-RT1064-1.0
You can find this in the Tools&Software tab of NXP’s i.MX RT1064 product page.
1) Unzip the contents.
2) Go to Tools > mfgtools-rel
3) Run MfgTool2
4) Power up the 1064-EVK with Serial Download set (SW7=0.0.0.1)
5) Click Start – process takes about 5 seconds. Green bar and ‘Done’ state message will appear.
6) Power up the 1064-EVK back to Internal Flash (SW7=0.0.1.0)
Doing this allowed me to connect with the debugger again.
There are many non-default options you can use, if you edit cfg.ini
Hope this helps!
LikeLike
Hi Steve,
thanks for sharing! And yes, I have used in several case the mfgtools with the bootloader to recover boards. The problem with these ‘external’ flash memory devices is that the CPU depends on some defined values which can get lost by flash programming or bad behaving programs. Then the last resort seems to boot in the bootloader mode and trying to recover.
LikeLike
Pingback: Tutorial: MCUXpresso SDK with Linux, Part 3: RAM and XiP Code on i.MX RT1064 | MCU on Eclipse
I did struggle with this issue right now. My workaround to fix it was to copy an .axf image (working one) to the file system the board mounts on the computer. For this specific problem, I had to put the board onto the serial download mode.
LikeLike
Thanks for that other solution!
LikeLike
Oh, I’ve found it in the Board’s User Guide for iMXRT1010: “For the MIMXRT1020 EVK Board, J23 is the connector between the USB host and the target processor. Jumper to serial downloader mode to use stable DAP-Link debugger function. If developer wants to make OpenSDA going to the bootloader mode, and press SW5 when power on. Meanwhile, the OpenSDA supports drag/drop feature for U-Disk. First, use the seral downloader mode and drag/drop the image file to U-Disk. Then select QSPI Flash as boot device and reset the Board, the image will run.” (Gosh, they need an editor there… but we got the gist anyway)
LikeLike
Yes, exactly, you have found it 🙂
LikeLiked by 1 person
That’s intriguing. Where did you get that idea from? Once you’ve copied the axf file onto the mounted device, what do you do?
LikeLike
Hi, All
Have similar issue, tried to follow Boot Utility to the Rescue session, but the USB-HID is found not same ViD and PID as shown and the Boot Utility doesn’t recognise MCU device as iMXRT1064 SIP. The device manager shows the device as
Other devices WebUSB: CMSIS-DAP with a warning sign
Any advice please?
Thanks
Ping
LikeLike
Hi Ping,
check the DIP switch/jumper settings. If it boots as CMSIS-DAP, then the board has not booted in bootloader update mode.
LikeLike
Hi Erich,
Today I bricked my i.MXRT1064 demo board not because of WFI but because of a bad USB stack parameter (bad struct pointer).
I used the NXP-MCUBootUtility as you explained above.
Many thanks for this excellent post (as always).
Nicolas
LikeLike
Hi Nicolas,
great to hear, and great that you were able to unbrick your board 🙂
Erich
LikeLike