With Eclipse as IDE it is very easy to debug an application on a board. Still sometimes it is useful to get one level down and control the GDB server directly.

Monitor Flash Download
In Command Line Programming and Debugging with GDB I have used a GDB client and server for command line debugging. There is an easy way to combine this approach with Eclipse: have Eclipse do the gdb server launching and still use the Eclipse debug console to control the target as needed. This can be very useful during bootloader development, for example to load a binary or PIC (Position Independent Code) fragment into RAM.
The steps below are using the NXP MCUXpresso IDE 10.2 with the SEGGER J-Link V6.40, but can work the same or very similar for any Eclipse-GDB combination.
First, make sure you have a connected to the target (e.g. with an attach or during a normal debug session).
If needed, make a connection to the remote target:
target remote localhost:2331

connecting to target
Next I make sure the debug monitor knows my target device:
monitor device MK64FN1M0XXX12
Because the GDB Debugger console does not report everything back, it makes sense to have a check in the console for the debug server to see what is going on:

Device Selected
To halt and reset the device:
monitor reset

Monitor Reset
Select the device for the flash programming:
monitor flash device = MK64FN1M0XXX12
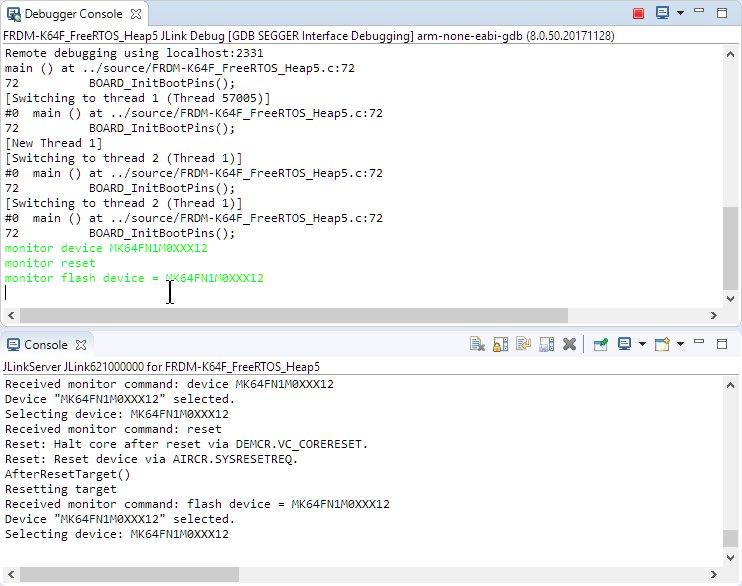
Monitor Flash Device
To turn on flash downloading:
monitor flash download = 1
Monitor Flash Download
And finally to flash the binary to the microcontroller:
load Debug/MK64FN1M0xxx12_Project.axf 0x8000

Loaded Binary
The offset at the end (0x8000) is an offset used where to load the binary. In my above case the binary is linked to address 0x0000’0000 compiled as PIC (Position Independent Code), and that way I can load it to a different address. I find that useful especially dealing with boot loaders.
Happy Monitoring 🙂
