This is the second part describing how to use DevContainer for embedded applications with VS Code.
In Optimizing Embedded Development with VS Code and DevContainer I use VS Code with a docker ‘development’ container. The container is created with a recipe to install the development tools and SDK. With VS Code and DevContainer I have the same developer experience as I would develop locally on the host.
One thing not addressed in that earlier article is debugging. Using USB debug probes like a SEGGER J-Link or NXP MCU-Link is a challenge inside a container. This applies to any other debug probe as well.
The solution is to transform an USB based debug probe into one with a network connection:

In this article, I show how to do this.
Outline
From a Docker container, one can easily use a networking connection to the host. It can also communicate with other containers, or the internet. A connection is easily possible with anything that uses TCP/IP. Using USB (non-IP) based debug probes is a challenge, especially using Windows as the host OS.
That problem does not exist if you are using a networking debug probe. For example see Debugging ARM Cores with IP based Debug Probes and Eclipse. But such debug probes are expensive, costing around $1000.

In this article I’ll show one can use an USB based debug probe from a development container with VS Code. It means making a USB based probe accessible through the network.
I’m using in this article the LPC55S16-EVK from NXP with an on-board NXP LinkServer debug probe:

Solution
The solution is to use a normal USB based debug probe like a networking probe:

The concept is to use the remote gdb server mode with the cortex-debug (marus25.cortex-debug) VS Code debug extension. The the concepts are explained in Remote Board Debugging: J-Link Remote Server with Eclipse and Remote Debugging with USB based JTAG/SWD Debug Probes.
NXP LinkServer Debugging with Remote GDB Server
With a NXP LinkServer based debug probe, start the GDB server on the host in a console for your target:
linkserver gdbserver --keep-alive LPC55S16:LPCXpresso55S16
The ‘gdbserver‘ command line option starts LinkServer in gdb server mode, listening by default on port 3333. The --keep-alive keeps it running after a disconnect. Then it waits for a connection:

From the running container, I can use host.docker.internal to get the IP of the host OS.
A typical launch configuration for LinkServer and remote debugging looks like this:
{
  "name": "LinkServer cortex-debug remote",
  "type": "cortex-debug",
  "request": "launch",
  "servertype": "external",
  "gdbTarget": "host.docker.internal:3333",
  "cwd": "${workspaceFolder}",
  "executable": "${command:cmake.launchTargetPath}",
  "armToolchainPath": null,
  "postLaunchCommands": [
     "monitor semihosting enable"
    ],
  "runToEntryPoint": "main",
  "rtos": "FreeRTOS",
  "svdFile": "./sdk/device/LPC55S16.svd",
},
For information, below is how the gdb server responds on a connection:
c:\tmp>linkserver gdbserver --keep-alive LPC55S16:LPCXpresso55S16
INFO: Exact match for LPC55S16:LPCXpresso55S16 found
INFO: Selected device LPC55S16:LPCXpresso55S16
INFO: Getting available probes
INFO: Selected probe #1 ORAWBQIQ (LPC-LINK2 CMSIS-DAP V5.460)
GDB server listening on port 3333 in debug mode (core cm33)
Semihosting server listening on port 4444 (core cm33)
INFO: [stub (3333)] Ns: LinkServer RedlinkMulti Driver v24.12 (Dec 18 2024 18:34:07 - crt_emu_cm_redlink.exe build 869)
INFO: Connected to core cm33
INFO: [stub (3333)] Pc: (  0) Reading remote configuration
INFO: [stub (3333)] Wc(03). No cache support.
INFO: [stub (3333)] Nc: Found generic directory XML file in C:\Users\ERICHS~1.N00\AppData\Local\Temp\tmpirfqukp7\crt_directory.xml
Pc: (  5) Remote configuration complete
INFO: [stub (3333)] Nc: Reconnected to existing LinkServer process.
INFO: [stub (3333)] Nc: Probe Firmware: LPC-LINK2 CMSIS-DAP V5.460 (NXP Semiconductors)
Nc: Serial Number:  ORAWBQIQ
Nc: VID:PID:  1FC9:0090
Nc: USB Path: \\?\hid#vid_1fc9&pid_0090&mi_00#7&7e77c7e&0&0000#{4d1e55b2-f16f-11cf-88cb-001111000030}
....
Pb: 1 of 1 (  0) Writing sectors 0-91 at 0x00000000 with 46852 bytes
Ps: (  0) at 00000000: 0 bytes - 0/46852
INFO: [stub (3333)] Ps: (100) at 00000000: 47104 bytes - 47104/46852
Nc: Sectors written: 0, unchanged: 92, total: 92
Nc: Closing flash driver LPC551x.cfx
INFO: [stub (3333)] Pb: (100) Finished writing Flash successfully.
Nc: Starting execution using system reset and halt target with a stall address
INFO: [stub (3333)] Nc: Retask read watchpoint 1 at 0x50000040 to use for boot ROM stall
INFO: [stub (3333)] Nc: Boot ROM stalled accessing address 0x50000040 (restoring watchpoint 1)
INFO: [stub (3333)] Nc: Using memory from core 0 after searching for a good core
INFO: [stub (3333)] Pc: ( 30) Emulator Connected
INFO: [stub (3333)] Pc: ( 40) Debug Halt
INFO: [stub (3333)] Pc: ( 50) CPU ID
INFO: [stub (3333)] Nc: debug interface type      = CoreSight DP (DAP DP ID 6BA02477) over SWD TAP 0
Nc: processor type            = Cortex-M33 (CPU ID 00000D21) on DAP AP 0
Nc: number of h/w breakpoints = 8
Nc: number of flash patches   = 0
Nc: number of h/w watchpoints = 4
Nc: Starting execution using system reset and halt target with a stall address
INFO: [stub (3333)] Nc: Retask read watchpoint 1 at 0x50000040 to use for boot ROM stall
INFO: [stub (3333)] Nc: Boot ROM stalled accessing address 0x50000040 (restoring watchpoint 1)
With this, I’m debugging 🙂

SEGGER JLink Debugging with JLink Remote Server
If using a J-Link, then I can use JLinkRemoteServerCL without tunnel server (see https://mcuoneclipse.com/2017/02/05/remote-board-debugging-j-link-remote-server-with-eclipse/ if you are interested in tunneling).
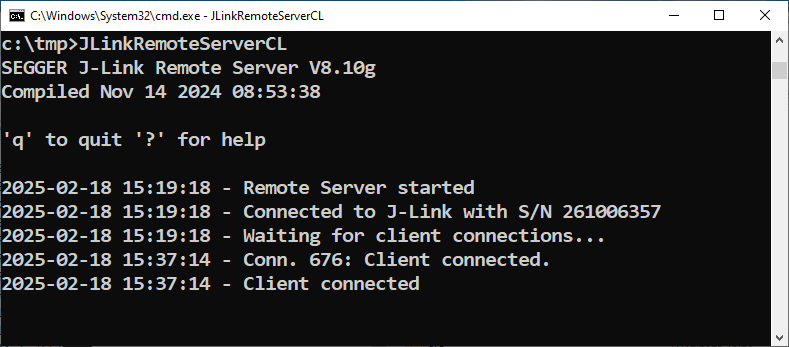
JLinkRemoteServerCL
Then it waits for a connection:

A debug remote configuration for J-Link looks like this:
{
  "name": "J-Link cortex-debug JLinkRemoteServerCL",
  "type": "cortex-debug",
  "request": "launch",
  "serverpath": null,
  "servertype": "jlink",
  "ipAddress": "192.168.65.254", // IP of "host.docker.internal", // run JLinkRemoteServerCL on host
  "cwd": "${workspaceFolder}",
  "executable": "${command:cmake.launchTargetPath}",
  "armToolchainPath": null,
  "device": "LPC55S16",
  "interface": "swd",
  "runToEntryPoint": "main", //"main" or "ResetISR"
  "postLaunchCommands": [
    "monitor semihosting enable",
    "monitor semihosting ioclient 1", // 1: telnet (port 2333); 2: gdb; 3: both telnet and gdbclient output
    ],
  "rtos": "FreeRTOS",
  "svdFile": "./sdk/device/LPC55S16.svd",
},
💡 Note that I have to specify the IP address directly. Ping host.docker.internal from the container to get the address.
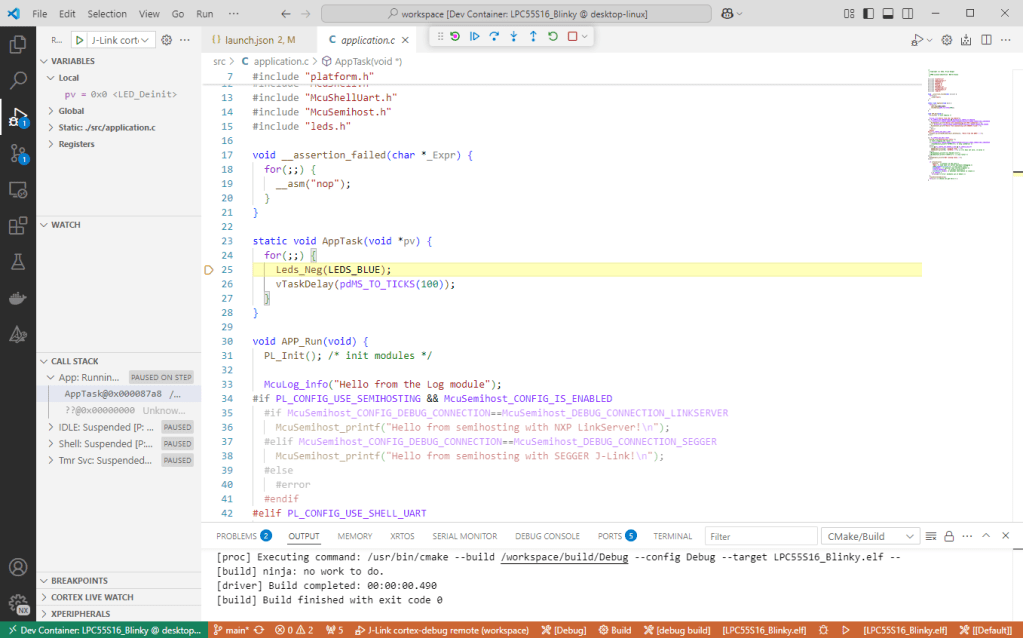
When debugging, it gets connected to the server:

and I’m debugging 🙂

SEGGER JLink Debugging with Remote GDB Server
The other way is to use a traditional GDB server. Start the server on the host with:
JLinkGDBServerCL -device LPC55S16 -if SWD
This starts the server and it waits on port 2331:

My debug configuration looks like this:
{
   "name": "J-Link cortex-debug gdbServer",
   "type": "cortex-debug",
   "request": "launch",
   "serverpath": null,
   "servertype": "external",
   "gdbTarget": "host.docker.internal:2331", // start server with JLinkGDBServerCL -device LPC55S16 -if SWD
   "cwd": "${workspaceFolder}",
   "executable": "${command:cmake.launchTargetPath}",
   "armToolchainPath": null,
   "device": "LPC55S16",
   "interface": "swd",
   "runToEntryPoint": "main", //"main" or "ResetISR"
   "postLaunchCommands": [
     "monitor semihosting enable",
     "monitor semihosting ioclient 1", // 1: telnet (port 2333); 2: gdb; 3: both telnet and gdbclient output
       ],
   "rtos": "FreeRTOS",
   "svdFile": "./sdk/device/LPC55S16.svd",
 },
Summary
Using a TCP/IP connection I can use normal USB based debug probes with VS Code and DevContainer. All what I need is to start the server on the host, and I can debug:

My target and debug probe do not have to be connected physically with the host using this approach. The probe and target can be in a remote test farm. I don’t have to use a PC machine for this. The GDB server could be running, for example, on a Raspberry Pi SBC.
If you can spend the money, I recommend adding a TCP/IP based debug probe to your arsenal of tools. That way you even don’t need to run a remote GDB server. Instead you can connect directly to the debug probe.
Happy debugging 🙂
Links
- Project and files on GitHub: https://github.com/ErichStyger/MCUXpresso_LPC55S16_CI_CD
- Optimizing Embedded Development with VS Code and DevContainer
- NXP MCU-Link: https://www.nxp.com/design/design-center/software/development-software/mcuxpresso-software-and-tools-/mcu-link-debug-probe:MCU-LINK
- SEGGER J-Link: https://www.segger.com/products/debug-probes/j-link/
- Remote Board Debugging: J-Link Remote Server with Eclipse
- Remote Debugging with USB based JTAG/SWD Debug Probes
- LinkServer for Microcontrollers

Another option is to tunnel USB traffic through IP using usbipd:
https://learn.microsoft.com/en-us/windows/wsl/connect-usb
LikeLike
Yes, I tried that. Does work fine for normal devices like a USB mouse or keyboard. But failed with debug probes which could disconnect and reconnect. Was not able to get it reconnected after such an event, so I had to abandon that approach.
LikeLike
It is mostly useful for UART over USB (CDC-ACM) ans is used like this by Espressif in their ESP-IDF.
LikeLike
It is mostly useful for UART over USB (CDC-ACM) and is used like this in Espressif’s ESP-IDF.
LikeLike
Yes, the USB-CDC e.g. with the ESP32 (including FTDI) is very ‘basic’ interface compared to the USB (sometimes custom) drivers for a debug probe.
LikeLike
This is a very useful note, thank you! Have you been able to get access to SWO data using the standalone LinkServer application? It seems well integrated with MCUXpresso Eclipse IDE, but I can’t find any documentation on how the IDE obtains the SWO data from LinkServer while gdbserver is running.
LikeLike
Hi Stephen,
I’ll have to recheck this. I believe currently SWO is directly handled by LinkServer internally and not exposed by other means. I think I had filed a feature request to have an IP port in LinkServer to get that data, but I believe that has not been implemented yet. I’ll have to follow up on this.
LikeLike