
For systematic debugging, an engineer needs a debug probe. For the Raspberry Pi Pico (RP2040) device there are plenty of debug options with VS Code.
In this article I show different options, from professional tools to DIY solutions and the settings in VS Code I’m using.
VS Code Extension
I’m using Cortex-Debug extension from marus25 which is versatile and supports many embedded features including FreeRTOS, SEGGER RTT and multi-core debug. It works with many debug probes, including J-Link and CMSIS-DAP based ones.

Debug Adapter
Unfortunately, the Raspberry Pi foundation decided not to use the standard 10pin SWD/JTAG connector, but a simple header with 3 wires (GND, clock and data). I put the standard 10pin connector on my boards, but if you have only the 3 pins available, you can use an adapter like the one from Adafruit:


J-Link Debug Probes
The SEGGER J-Link comes with many utilities and excellent support for the RP2040. Students love the J-Link EDU Mini (only for hobby or educational use) because it tiny and they can carry it easily with the board.
I prefer the J-Link because it is a professional tool and it works for many vendors out of the box, imho opinion worth the price.
Note that you can turn your J-Link into a debug probe for OpenOCD, see https://wiki.segger.com/OpenOCD#Restoring_the_USB_driver.
RP2040-based Debug Probes
With OpenOCD one can use a RP2040 as a debug probe, there are plenty of options for this. This is usually the least-expensive option: all you need is a RP2040 pico board and some wires, so around $5.
The Raspberry Pi Foundation provides its own probe and firmware: https://github.com/raspberrypi/picoprobe
I recommend the ‘yet-another-pico-probe’ firmware which I’m using: https://github.com/rgrr/yapicoprobe
You can use a breadboard with some wires, see Picoprobe: Using the Raspberry Pi Pico as Debug Probe.

Or you can build your own circuit: Open Source picoLink: Raspberry Pi RP2040 CMSIS-DAP Debug Probe

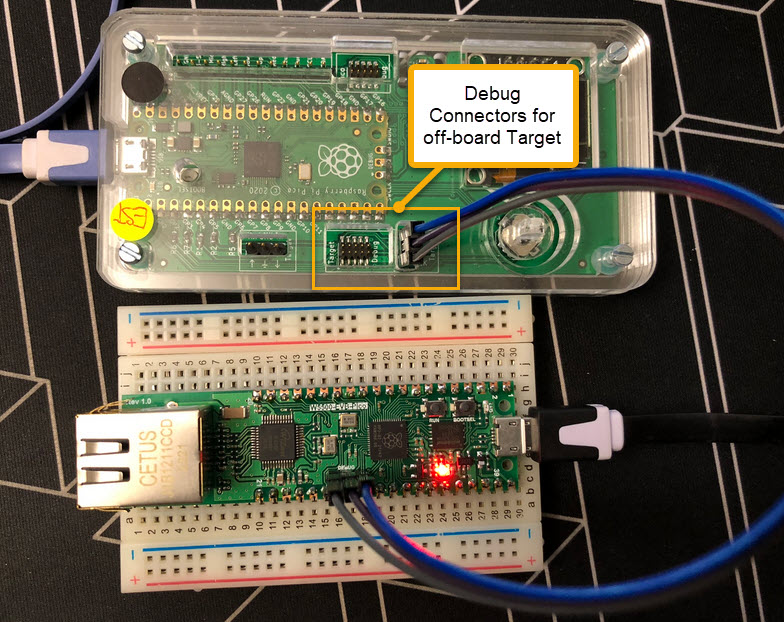
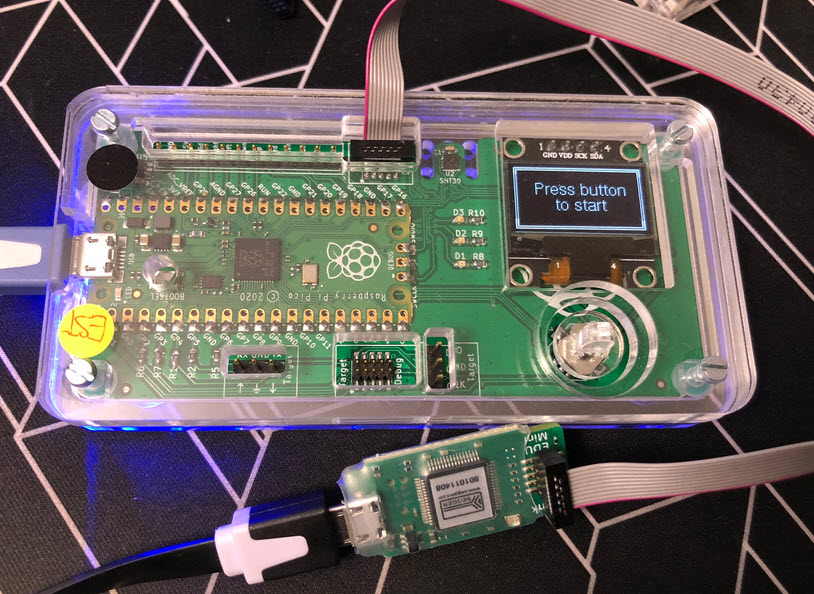
On some of my classroom boards I have added the circuit so the board can debug another RP2040, both with the standard 10pin cable and the non-standard 3pin connection:
MCU-Link
If you don’t own a J-Link and you don’t want to build a DIY probe with wires, then I can recommend using the NXP MCU-Link. Because the debug probe is enumerating as CMSIS-DAP debug probe, it can be used for the RP2040 too, and costs around $13 (e.g. Mouser)

From NXP there is the MCU-Link Pro (around $50) which includes power measurement and can be turned into a J-Link debug probe (for NXP devices) too.

VS Code Launch.json
Below is my current version of the launch.json for RP204 and J-Link and OpenOCD, both with semihosting enabled:
{
    "version": "0.2.0",
    "configurations": [
        { // see https://github.com/Marus/cortex-debug/blob/master/debug_attributes.md
            "name": "TSM_PicoW_Blinky J-Link Cortex-Debug",
            "type": "cortex-debug",
            "request": "launch",
            "servertype": "jlink",
            "serverpath": "${env:PICO_SEGGER_PATH}/JLinkGDBServerCL.exe", // or: set in global json: cortex-debug.JLinkGDBServerPath
            "cwd": "${workspaceRoot}",
            "executable": "${command:cmake.launchTargetPath}",
            "armToolchainPath": "${env:PICO_TOOLCHAIN_PATH}",  // needed for the gdb
            "device": "RP2040_M0_0",
            "interface": "swd",
            "serialNumber": "", // add J-Link serial number if having multiple attached the same time.
            "runToEntryPoint": "main", // "_reset_handler" or for example "main"
            "postLaunchCommands": [
                "monitor semihosting enable",
                "monitor semihosting ioclient 3", // 1: telnet (port 2333); 2: gdb; 3: both telnet and gdbclient output
            ],
            "postRestartCommands": [],
            "postResetCommands": [],
             "rtos": "FreeRTOS",
            "svdFile": "${env:PICO_SDK_PATH}/src/rp2040/hardware_regs/rp2040.svd",
            "rttConfig": {
                "enabled": false,
                "address": "auto",
                "decoders": [
                    {
                        "label": "",
                        "port": 0,
                        "type": "console"
                    }
                ]
            },
            "showDevDebugOutput": "none",
        },

        { // see https://github.com/Marus/cortex-debug/blob/master/debug_attributes.md
            "name": "AEMBS_pico_Game CMSIS-DAP Cortex-Debug",
            "type": "cortex-debug",
            "request": "launch",
            "servertype": "openocd",
            "serverpath": "openocd.exe", // or: set in global json: cortex-debug.JLinkGDBServerPath
            "serverArgs": [
                "-c adapter speed 5000",
                "-c set USE_CORE 0", // TIMER stops, see https://github.com/raspberrypi/picoprobe/issues/45
            ],
            "cwd": "${workspaceRoot}",
            "executable": "${command:cmake.launchTargetPath}",
            "armToolchainPath": "${env:PICO_TOOLCHAIN_PATH}",  // needed for the gdb
            "device": "RP2040",
            "configFiles": [
                "interface\\cmsis-dap.cfg",
                "target\\rp2040.cfg"
            ],
            "runToEntryPoint": "main", // "_reset_handler" or for example "main"
            "postLaunchCommands": [
                "monitor arm semihosting enable",
            ],
            "postRestartCommands": [],
            "postResetCommands": [],
            "rtos": "FreeRTOS",
            "svdFile": "${env:PICO_SDK_PATH}/src/rp2040/hardware_regs/rp2040.svd",
            "rttConfig": {
                "enabled": false,
                "address": "auto",
                "decoders": [
                    {
                        "label": "",
                        "port": 0,
                        "type": "console"
                    }
                ]
            },
            "showDevDebugOutput": "none",
        },
    ]
}
With this, I can debug with a J-Link or a CMSIS-DAP based debug probe in VS Code:

Summary
For the RP2040, I have plenty of choices and options to debug the device. I prefer to have different options and probes at hand, because sometimes one probe cannot do everything.
This is just a selection of debug probes which I use for the RP2040, and of course there are many other choices.
Happy probing 🙂
Links
- Cortex-Debug by marus25: https://marketplace.visualstudio.com/items?itemName=marus25.cortex-debug
- OpenOCD: https://openocd.org/
- SEGGER: https://www.segger.com
- MCU-Link: OpenOCD with MCU-Link
- Adafruit Adapter: https://www.adafruit.com/product/2094
- PicoProbe firmware: https://github.com/raspberrypi/picoprobe

Hi,
a little improvment for the launch.json file.
Use ‘svdPath’ instrad of ‘svdFile’.
Then is the other PeripheralViewer (from the Embedded Tools Extension from Microsoft) working and with this view you can search the the register you are looking for.
svdPath:
This is for ‘XPERIPHERALS’ window provided by ‘mcu-debug.peripheral-viewer’ and ‘Embedded Tools’ Extension from Microsoft. It can be a simple file name. For ‘mcu-debug.peripheral-viewer’ or more based on a CMSIS pack or deviceName. See ‘mcu-debug.peripheral-viewer’ for format
BR
Alex
LikeLike
Hi Alex,
thanks for that input! I did not read carefully enough the description, so your suggestion makes sense.
It is only that the XPeriveral view works perfectly, but the Microsoft Peripheral View only hangs (at least for the RP2040.svd), and only shows ‘Embedded registers are loading…’. So are you saying the Microsoft view is working for you? I’m using Cortex-Debug v1.12.1 with Microsoft Embedded Tools v0.7.0.
LikeLike
Hi Erich,
Yes, it was working.
A colleague gave me that tip this tip last week and than it worked.
I didn’t know that there is another view available.
I am on vacation this week, so i cannot test it again.
Last week, we also discovered that live watch is also now available with cortex-debug.
“liveWatch” for the launch.json.
For the settings.json there is also a setting for it like “livewatchmaxrefreshrate”.
It should be over 200ms/250m, otherwise there is a problem with vscode. See the tooltip for more information.
LikeLike
Hi Alex, thanks!
Not sure if the problem is part of the Cortex-Debug or part of Microsoft extension. I continue to use “svdFile” instead of “svdPath”, otherwise I’m not able debug the RP2040.
LikeLike