
Using IP (Ethernet) based debug probes is a very handy thing: I don’t have to be directly connected to the debug probe (e.g. with the USB cable). This article explains how to use an IP-based Segger or P&E probe with the Eclipse based MCUXpresso IDE.

LAN Based Debugging
I’m using Ethernet/IP-based debug probes to attach to boards which are not physically close to my host computer (e.g. located on the roof or in the basement of a building). Another case is if the board is on a robot or moving machine: then I can attach the probe to a wireless access point and don’t need any cable connection.
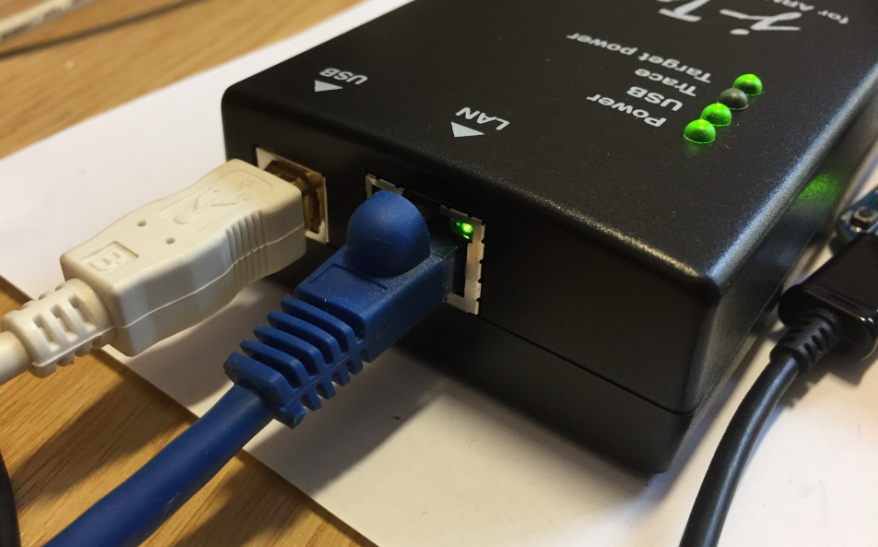
LAN Port on Debug Probe
Ethernet/IP-based another room (such as in the basement). Additionally I can attach such a probe to a WiFi/Wireless access point. Such LAN based debug probes usually still have a USB port which is used both for (local) debugging and as power supply to the debug probe.
In this article I’m using IP-based probes from Segger and P&E with MCUXpresso IDE 10.1.
Typically Eclipse might not be able to find a IP based debug probe (but it will find the ones attached through USB), so in order to connect to an IP based one I have to enter the IP address into the debug/launch configuration. However, the NXP MCUXpresso IDE has a feature included (configurable in the workspace settings) to discover attached IP based probes. For Segger it can be turned on here:

MCUXpresso IDE Segger J-Link IP probes discovery setting
For P&E it it will do this automatically, additional settings are here:

PEMicro Discovery Options
Segger
I’m using the Segger J-Link Flasher and Segger J-Trace Pro for my Ethernet based debugging.
In the MCUXpresso IDE create first a launch configuration. The easiest way is to first debug the board locally with a USB based debug probe connection.
The next thing is to find out the IP address of the debug probe. For this I use the J-Link Configuration utility which scans all IP-based probes in the local network:

IP Address in J-Link Configuration Tool
Next, open the debug configuration and enter the IP address found:

IP Address in MCUXpresso IDE Debug Configuration
All the other settings can stay as configured for a USB based debug configuration.
💡 Segger offers a remote server for non-IP based debug probes, see “Remote Board Debugging: J-Link Remote Server with Eclipse“
That’s it: with this I can debug my target board using that IP address.
P&E
I’m using the P&E Cyclone FX and P&E TraceLink for Ethernet based debugging.
The P&E Cyclone FX programmer shows the IP address on the touch display of the probe:

IP Address on Cyclone Fx
💡 for the P&E Tracelink (which does not have a LCD display) there is the TraceLink IP Setup Utility from P&E which is used to configure the debug probe IP address.
I recommend to start with a working USB connection based debug configuration. To enable the IP connection inside the MCUXpresso IDE debugger launch configuration:

PEMicro IP Settings
That’s it! With this I can debug using that IP address.
Summary
Using IP-based/networking debug probes are very useful to debug targets not physically close to the host system. Using Eclipse (MCUXpresso IDE in this case) allows me to use it like a USB attached probe: basically all what I need to know is the IP address and set that up in the debug configuration, and I’m ready to debug my application using the network. The downside is that these IP-based probes are more expensive than the USB based ones, but having one around to work in a more unusual environment is very much worth the extra price.
Happy Networking 🙂

Imho the effect is zero.
An oscilloscope is more needed than remote debugging.
LikeLike
A remote oscilloscope would be very useful too.
LikeLike
Pingback: Remote Debugging with USB based JTAG/SWD Debug Probes | MCU on Eclipse