
It seems to me that not many developers use hardware trace? ARM indicates that maybe only <5% of developers are using trace. Too bad! Why are all the ARM Cortex microcontroller vendors putting a powerful hardware (and complicated!) trace engine into their devices, if only few developers are using it? Seems like a waste of silicon and an unnecessary price adder? Well, hardware trace can be a life saver: Because only with hardware trace the most complicated bugs and problems can be solved. And maybe because only the best are using it ;-).
In this article I proudly present my research how to get instruction trace out of the ARM Cortex-M4 microcontroller on a NXP TWR-K64F120M board with a Segger J-Trace for ARM:

J-TRACE tracing NXP TWR-K64F Board
Trace or No Trace
Maybe few engineers are using hardware trace because most don’t know about it? Or because it requires a decent hardware probe to capture the trace date to get reasonable results for high-speed targets? Or because ARM for whatever reason has implemented the hardware trace in their devices in a way which is hard to understand, and the documentation about it is distributed all over the place and hard to understand and read? As for myself, I have found it very difficult to gather all the needed information to get trace out of the NXP TWR-K64F120M board. But as always with difficult things: have learned a lot new things that way :-).
I have used occasionally hardware trace with the Freescale CodeWarrior for MCU 10.x, and it worked very well. Then this was replaced by the Kinetis Design Studio and it did not had hardware trace included. Because most of my boards anyway did not had a trace port, and I used it occasionally only, this was not a big deal for me. And it seems it was the same for most users of CodeWarrior: apart of a few voices in the communities, there was no outcry about hardware trace not supported in Kinetis Design Studio.
However, recently I have faced issues with DMA and interrupts where hardware trace is an effective tool to get enough data out of the system to understand what is going on and to narrow down the problem. A trial-and-error approach is otherwise all what remains. I have now solved my problem with the help of ETM trace and a Segger J-Trace. But it took me a while to get into the topic of hardware instruction trace and to have my Kinetis configured to get all the data I needed.
Outline
In this article I describe what I had to do to get ETM (Embedded Trace Macrocell) instruction trace out of an NXP TWR-K64F120M board. In “First Steps with Ozone and the Segger J-Link Trace Pro” I used the Segger Ozone to trace an STM Cortex-M which was included as demo board with the Segger J-Trace for ARM Cortex-M processors.
But my real use case is a NXP Kinetis K64F. After a journey through internet discussion forums and the ARM documentation about the CoreSight trace implementation, I’m finally able to build an image with open source GNU tools (NXP Kinetis Design Studio V3.2.0) and getting trace out of it with the Segger Ozone debugger:

Instruction Trace in SEGGER Ozone
💡 I have used the Segger Ozone Debugger because the Kinetis Design Studio does not support hardware trace. See above note. I used Ozone ‘only’ to get the trace data, everything else (project, build) is still done in Eclipse (KDS).
ARM CoreSight
Understanding trace means reading the ARM CoreSight information on Arm.com. Unfortunately that documentation is more oriented for silicon engineers, and not much for software engineers. The documentation is full of acronyms which are hard to remember.

ARM CoreSight Blocks
I hope I got them right, as there seems to be no consistent and reasonable-to-understand (at least to me) description from either the different vendors (NXP, STM, TI, …, they all refer to the ARM documentation) and from ARM (their information is written more for silicon designers and not for software engineers).
The most important blocks I have identified are:
- ITM: Instrumented Trace Macrocell, hardware block which allows tracing using software instrumentation, e.g. writing to special ports to send trace messages out. A common usage is sending text messages over SWO, see “Tutorial: Using Single Wire Output SWO with ARM Cortex-M and Eclipse“. Another usage is generating messages for interrupt entry/exit and for periodical program counter (PC) sampling.
- ETM: Embedded Trace Macrocell, hardware unit responsible to generate hardware instruction trace.
- ETB: Embedded Trace Buffer, instead of sending trace out on physical pins, this unit is responsible for storing trace messages in internal RAM. The trace then can be retrieved with normal memory access e.g. with a SWD or JTAG debug unit.
- DWT: Data Watchpoint and Trace, hardware unit responsible for generating trace for data access.
- TPIU: Trace Port Interface Unit, hardware responsible
- SWO: Single Wire Output, hardware pin which is able to send ITM and DWT trace messages to the outside.
- SWV: Single Wire Viewer, trace protocol and format generated by the ITM. This includes character/serial encoding for UART, interrupt entry/exit messages and PC sampling.
- ATB: Advanced Trace Bus, trace bus protocol used by ARM to internally send trace messages over the trace bus.
- SWD: Single Wire Debug, debug interface with reduced pin count (data and clock).
These acronyms will be used later in this article as we have to configure them to get trace out.
Hardware Trace Probe
While it is possible to get trace using ETB and a RAM buffer plus a normal JTAG/SWD debugger, this won’t work well for faster trace data. For this, a probe with hardware trace is needed. Such a probe is the Segger J-Trace (see “First Steps with Ozone and the Segger J-Link Trace Pro“).
I recommend to use the LAN port and to use the USB port to power the trace unit. I could use the on-probe memory to capture the trace, but only the probe LAN port is able to stream the data fast enough to the host PC.
J-TRACE tracing NXP TWR-K64F Board over the LAN Port
Debug Connector
In order to get trace out, there needs to be the necessary pins available on the debug connector. The SWO pin (see “Tutorial: Using Single Wire Output SWO with ARM Cortex-M and Eclipse“) is available on the small 2×5 debug header. For the extra trace pins, the 2×10 header is necessary for the extra pins:

2×10 Debug Header on NXP TWR-K64F120M Board
The schematics shows the location of the trace pins:

NXP TWR-K64F120M JTAG and Trace connector (Source: NXP TWR-K64F120M Schematics)
These trace pins are not available on Cortex-M0(+). And they are not available on many boards because the pins are used for other things like GPIO. It seems to me that rarely board designers are willing to spend the needed pins for hardware trace. And the problem gets bigger with the lower pin counts: which board designer is willing to sacrifice up to 5 pins for hardware trace on a device with say 48 pins or less? The other issue is that because the data rate and clocks on the trace pins can be very high, they need special layout considerations too, so chances are low that the board designer is willing to spend the extra effort to give the software developer the trace he needs. Maybe software has no bugs? ;-).
Pins and Trace
As shown in the schematics, the trace pins (CLKOUT, D0-D3) are shared with normal GPIO pins (PTE0-PTE). As a board designer I have to make sure the pins are not used for anything else. Additionally I need to be careful that the clock and data lines of trace are as short as possible and are not influenced by noise.
I need to configure the pins for trace, I have to ‘mux’ them properly, see “Tutorial: Muxing with the New NXP Pins Tool“), plus I have to configure the ARM trace blocks to get the trace out to the trace pins:
- Configure the GPIO pins for ETM trace
- Enable ETM/ETF/TPIU/ETB to get trace out of the pins
Configure for Trace
The two steps I have implemented in the following function:
/* Kinetis has two trace sources (ITM, ETM) and 3 output options (ETM, ETB and SWO)
 * The following is possible:
 * no trace
 * ETM to TPIU (with ITM)
 * ETM to ETB, ITM to SWO
 * ETM to TPIU, ITM to ETB
 * Note: Using ETM and ETB  with SWO cannot co-exist, as using the same data channel.
 */
#define KINETIS_TRACE_ETM_ENABLE   (1<<0)
#define KINETIS_TRACE_ITM_ENABLE   (1<<1)
#define KINETIS_TRACE_ITM_ETM_MASK (KINETIS_TRACE_ITM_ENABLE|KINETIS_TRACE_ETM_ENABLE)

void KinetisTrace_Init(void) {
  KinetisTrace_ConfigureGPIO();
  KinetisTrace_EnableTrace(KINETIS_TRACE_ETM_ENABLE|KINETIS_TRACE_ITM_ENABLE);
}
The first one configures the GPIO pins, the second enables either ETM or ITM, or both.
GPIO for Trace
The following function configures the 5 pins on the K64F microcontroller (see schematics):
- Turns on the clock gates for the port
- Enable the debug trace clock in the SIM_SOPT2
- Muxes the pins for trace functionality and high drive strength
To illustrate the different settings, I’m showing them in the EmbSysReg View.
The first step is to turn on the clock gate for the port(s) used by the trace pins. On the TWR-K64F the Port E is used by the trace pins:
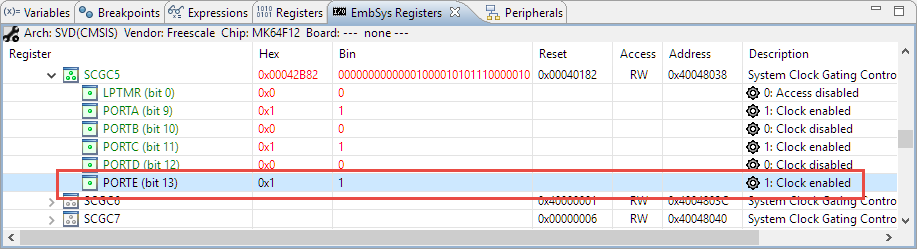
Port E Clock Enable Bit
Step 2 is to turn on the trace clock inside the SOPT2 register:

Trace Clock Selector Bit
Step 3 is to mux the pins for tracing (Mux Alternative Function 5) and configure it for High Drive Strength (DSE, needed for signal quality to the trace port):

Trace Pin Configuration
Below is everything implemented in a single function:
static void KinetisTrace_ConfigureGPIO(void) {
  uint32_t value;
  /* On the TWR-K64F, the following pins are are available on the JTAG/Trace connector:
   * PTE0: TRACE_CLKOUT
   * PTE4: TRACE_D0
   * PTE3: TRACE_D1
   * PTE2: TRACE_D2
   * PTE1: TRACE_D3
   */
  #define PORT_PCR_DSE_ENABLE       (1<<6)  /* Port Configuration Register, Drive Strength Enable (DSE) bit */
  #define PORT_PCR_MUX_ALTERNATE_5  (5<<8) /* Port Configuration Register, Alternate 5 function (mux as trace pin) */
  #define PORT_PCR_CONFIG_FOR_TRACE (PORT_PCR_DSE_ENABLE|PORT_PCR_DSE_ENABLE|PORT_PCR_MUX_ALTERNATE_5) /* for trace, mux it with function 5 and high drive strength */

  /* check and enable clocking of PORTE */
  value = SIM_SCGC5; /* read SIM_SCGC5 at 0x40048038 */
  if ((value & (1<<13)) == 0) { /* Bit13 in SCGC5 is the PortE clock gate control bit. Clock not already enabled? */
    SIM_SCGC5 |= (1<<13);    /* Enabling clock gate for Port E */
  }
  value = SIM_SOPT2; /* SIM_SOPT2 at 0x40048004 */
  if ((value&(1<<12))==0) { /* Bit 12 enables the trace clock. Is the debug trace clock not already enabled? */
    SIM_SOPT2 |= (1<<12); /* Debug trace clock select = Core/system clock */
  }
  /* Trace data (PTE1-4) and clock pin (PTE0), high drive strength */
  PORTE_PCR0 = PORT_PCR_CONFIG_FOR_TRACE; /* PTE0, PORTE_PCR0 at 0x4004D000, trace clock pin, high drive strength */
  PORTE_PCR1 = PORT_PCR_CONFIG_FOR_TRACE; /* PTE1, PORTE_PCR1 at 0x4004D004, trace data pin, high drive strength */
  PORTE_PCR2 = PORT_PCR_CONFIG_FOR_TRACE; /* PTE2, PORTE_PCR3 at 0x4004D008, trace data pin, high drive strength */
  PORTE_PCR3 = PORT_PCR_CONFIG_FOR_TRACE; /* PTE3, PORTE_PCR3 at 0x4004D00C, trace data pin, high drive strength */
  PORTE_PCR4 = PORT_PCR_CONFIG_FOR_TRACE; /* PTE4, PORTE_PCR4 at 0x4004D010, trace data pin, high drive strength */
}
Hardware Configuration for Trace
After having configured the GPIO pins, now it is about the ARM ETF/ETM/ITM configuration, with the following steps:
- Configure the ETF (Embedded Trace FIFO) and Funnel register
- Enable the ETM and/or ITM path in the MCM (Miscellaneous Control Module) Counter Control (CC) Register
The only information about the Funnel register I have found on http://infocenter.arm.com/help/index.jsp?topic=/com.arm.doc.ddi0314h/Babhdcjb.html. With trial-and-error I have found that that bit 0 corresponds to ETM and bit 1 is for ITM:

Next I need to enable the trace paths in the MCM module. There are two bits in the ETB Counter Control Register which are LOW active (a 0 enables the path, a 1 disables it!):
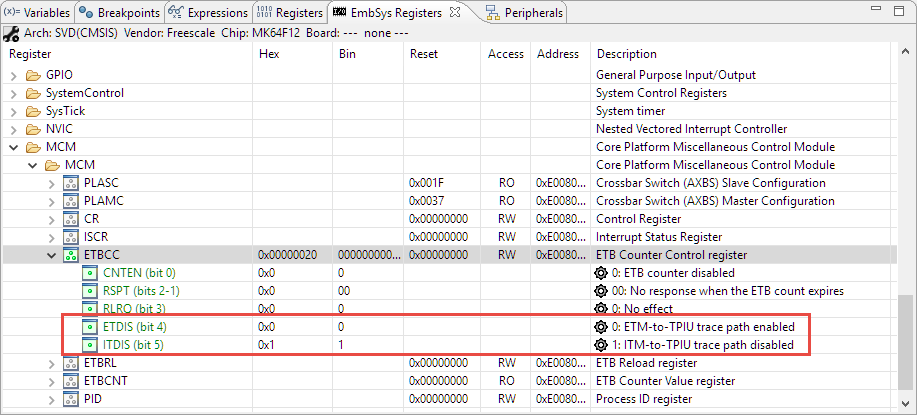
ETB Counter Control Register
Below is everything described above implemented. I have added
static void KinetisTrace_EnableTrace(uint32_t mask) {
  uint32_t value;

  /* setup of ETF (Embedded Trace FIFO) funnel */
  value = ETF_FCR; /* read ETF (Embedded Trace FIFO) Funnel Control Register at 0xE0043000 */
  if ((value&KINETIS_TRACE_ITM_ETM_MASK)!=mask) { /* Check if we need to change it */
    value &= ~KINETIS_TRACE_ITM_ETM_MASK; /* clear bits */
    value |= mask; /* enable bits */
    ETF_FCR = value; /* write ETF Funnel Control Register at 0xE0043000 */
  }
  /* MCM: Core Platform Miscellaneous Control Module:
   * bit 4 (ETDIS): ETM-To-TPIU Disable, 0: path enabled, 1: path disabled
   * bit 5 (ITDIS): ITM-To-TPIU Disable, 0: path enabled, 1: path disabled
   **/
  value = MCM_ETBCC; /* get ETBCC bits (address 0xE0080014) */
  value &= ~(KINETIS_TRACE_ITM_ETM_MASK<<4); /* clear bits */
  value |= ((~mask)&KINETIS_TRACE_ITM_ETM_MASK)<<4; /* build with invert bits: 0 enables the path */
  MCM_ETBCC = value; /* store back value to ETBCC (at 0xE0080014) */
  /* debug output only: show what we are tracing */
  value = (value>>4)&KINETIS_TRACE_ITM_ETM_MASK;
  if (value==0x0) { /* both bits cleared */
    msg("Kinetis: ITM and ETM routed to TPIU");
  } else if (value==0x1) { /* only ITM bit cleared */
    msg("Kinetis: ITM routed to TPIU");
  } else if (value == 0x2) { /* only ETM bit cleared */
    msg("Kinetis: ETM routed to TPIU");
  } else { /* 0x3, both bits set, both paths disabled */
    msg("Kinetis: routing to TPIU disabled");
  }
}
This completes the pin and trace configuration needed to get trace with the J-Trace and the Ozone debugger.
Capture Trace with J-Trace
I call KinetisTrace_Init() as part of my system initialization. If you want to have a look, check out my project on GitHub (https://github.com/ErichStyger/mcuoneclipse/tree/master/Examples/KDS/TWR-K64F120M/TWR-K64F120M_Demo). I build it with the Eclipse based Kinetis Design Studio and then load it with the Ozone (.jdebug) project file present in the project root folder. With the above setup, I’m able to get the instruction trace 🙂

Instruction Trace in SEGGER Ozone
Summary
Getting instruction trace out of an ARM Cortex-M4 is probably not the simplest thing in the world. I had to configure both the GPIO pins plus the trace module to be able to get instruction trace with the Segger J-Trace probe.
In case you don’t own a trace probe, there is a cool way to get trace data with a general purpose logic analyzer, then have a read http://essentialscrap.com/tips/arm_trace/theory.html which presents a way to decode the trace data with the sigroc data deocder (cool stuff!).
The sources (KinetisTrace.h, KinetisTrace.c) are available on GitHub: https://github.com/ErichStyger/mcuoneclipse/tree/master/Examples/KDS/TWR-K64F120M/TWR-K64F120M_Demo
Happy Tracing 🙂
Links
- Segger J-Trace Pro for ARM Cortes-M: https://www.segger.com/jtrace-pro-cortex-m.html
- ARM CoreSight ETM-M4 description: http://infocenter.arm.com/help/topic/com.arm.doc.ddi0440c/DDI0440C_etm_m4_r0p1_trm.pdf
- Community discussion about ETM on Kinetis: https://community.nxp.com/thread/349983 and https://community.nxp.com/thread/300553
- ETM on Freescale Tower Boards: https://community.nxp.com/thread/349983
- Cortex-M Debug Adapters: http://infocenter.arm.com/help/topic/com.arm.doc.faqs/attached/13634/cortex_debug_connectors.pdf
- J-Trace and Ozone tutorial video: https://www.youtube.com/watch?v=hl7WdxnD9k0
- Segger Ozone: https://www.segger.com/ozone.html
- Introduction to Trace on ARM: http://www.sase.com.ar/2013/files/2013/09/SASE2013-ARM_Trace.pdf
- Tracing on STM32 Discovery: http://essentialscrap.com/tips/arm_trace/theory.html
- Sigrok protocol decoder: http://sigrok.org/wiki/Protocol_decoder_HOWTO

Thank you for a great description. I’ve always wanted to get it to work but I always run into an issue and don’t end up using it.
Could you please explain cases when a trace is the only/best/fastest way to figure out your problem? I don’t know when it is worth the effort to get it setup.
I have used it in the past for Linux os debugging with the green hill debugger.
Thanks,
Abid.
LikeLike
Basically, trace provides you a full history what happened. So it is extremely helpful for cases where a sequence of interrupts or events lead to a problem.
For example I had a problem where critical sections where not working properly (see https://mcuoneclipse.com/2014/01/26/entercritical-and-exitcritical-why-things-are-failing-badly/). Only in a particluar sequence of interrupts and very timing sensitive the problem occurred. With hardware instruction trace I was able to have things recorded up to the point where the system caused the fault, so I had the sequence of instructions leading to the problem point. Going back the sequence of instructions I saw what was happening, and very soon I spotted that problem. With normal debugging such a problem would be very hard to find.
I would say that maybe 95% of the bugs can be found with normal debugging. But for the rest of the problems hardware trace can be extremely helpful. But it requires practice, and still debugging the hard-to-find problems needs experience and good tools. And good tools can save your from days of debugging in the dark.
LikeLike
Great article – and good question you ask – how do we manage now days without trace capability?.
I’ve used trace extensively when it was part of expensive emulator/debuggers before the days of JTAG. In those days there was scarce hardware resources, think 1 system 10 sw engineers booking time on it 18hrs a day. Expensive projects!!.
Since 2000 the style of embedded systems code development has changed to have plentiful low cost hardware available, and I’ve fought in projects for each embedded sw developer to have their own development system. This has allowed sw developers to test more thoroughly their code base, and layer it, and overall improve project time to completion.
Now there are software driver specialist in interfacing to the hardware with a desire to abstract the hardware layer. One such project is an embedded USB – https://github.com/felis/UHS30 with one option at the hardware level for kinetis series FS host. We do have puzzles at times as to what is the interaction between hw and dma and have to try some options and read the manuals.
For a lot of projects, linux based, the hardware is abstracted away. So now for a fan controller shelf for a low manufacturing run 7′ telecom subassembly, its just as low cost to make it a linux with ethernet/usb as Cortex-M4
The software supplied by silicon vendors also demonstrate how to access drivers, and combined with source code management like GIT make it easier to manage the quality and track from a working driver to when it fails, and provide a bug fix.
So those 5% of sw engineers using it are probably critical to getting a working base system.
Still if the trace interface was easily available for a low cost for early stages of debugging drivers I think more people would use it. As an expensive $option (not least because of the cost of developing the software to extract and display the trace) it remains the province of a productivity tool for budgeting into new projects.
Of course if the good GDB angels work some open source magic, then its cost to the rest of us will fall to that of the components.
Thanks for the excellent article, I need to try and make those pins available in my next hardware board in case I need them later :).
LikeLike
Thanks 🙂 ! I have used expensive trace hardware units for devices which had only a very minimal hardware debug capability (BDM, Background Debug Mode) compared to the ARM CoreSight debug block. And it was used with full emulation system and/or bondout version of the chips. These days inexpensive boards are available and make things much easier. I agree with you with the hardware abstracted away, the developer probably does not care about trace. Still it would be useful as information provider for profilinig and coverage. And I’m surprised how few developers on embedded are using profiling and coverage information.
I think because not many seem to use trace these days, coverage in the tools like Eclipse and GDB is rather minimal: the GDB angels work on the items they need the most, and that’s basically ‘normal’ debugging. But this opens up a door for the good tool vendors our there to provide something as a differenciator.
LikeLike
I had previously thought that Trace Debug using the ETM would be Plug and Play like JTAG or SWD, I think its safe to say this article would have avoided disappointment for me. The JTAG adapter has dropped significantly in price over the years but I expect trace tools won’t be super cheap any time soon due to hardware cost and low volume production. Would be awesome if there was a way to graphically view Instruction trace data.
LikeLike
At least for me, it was definitely not plug&play. Probably because many more users are using JTAG/SWD, the vendors have made it easy for all of us. The good thing with SWD/JTAG is that these pins are available on the boards, so broadly supported. I have found that only few NXP boards and from other vendors have the trace pins available. E.g. all the FRDM boards from NXP which are very popular do not have the trace pins available.
CodeWarrior had a graphical view of the trace timeline view (see https://mcuoneclipse.com/2013/04/07/first-steps-with-the-pe-tracelink/). I would love to see a graphical view like the Segger SystemView with the function trace in there too.
LikeLiked by 1 person
From the recent NXP press release, can we expect “trace” to be reintroduced into the KDS replacement next year?
“The MCUXpresso IDE merges the best of the popular LPCXpresso and Kinetis Design Studio IDEs into one easy-to-use integrated development environment for Kinetis and LPC MCUs. The MCUXpresso IDE offers basic editing, compiling and debugging features with the addition of MCU-specific debugging views, code trace and profiling, multicore debugging, and more. Full-featured, free and low-cost professional editions will be available with debug connections to support Freedom, Tower, LPCXpresso boards and custom hardware platforms.”
“The MCUXpresso IDE will be available March 2017 in full-featured free (code size unlimited) and affordable professional editions.”
LikeLike
FYI, we have a tutorial about using instruction trace with MCUXpresso IDE now on the nxp.com site. You will have to register/log in to access, but that’s a one-time thing:
https://www.nxp.com/design/training/advanced-debugging-with-mcuxpresso-ide-part-4-instruction-trace:TIP-ADVANCED-DEBUG-MCUXPRESSO-IDE-4
LikeLiked by 1 person
You hit the issue on the head for us: Our EEs only lay out the 10 pin header on all our boards: Combination of pins, board space, and connector cost (on many boards they use the pogo-pin Tag-Connect system which as developers we hate but manufacturing likes). I’ve tried to convince them to at least put the full 20pin on at least Rev A boards if the pins are available and maybe switch to the 10 pin tag-connect only when we get to a board rev that we’re confident is going to production but so far we haven’t had success.
LikeLike
Hi Luciano,
yes, I made the same mistake as most of the evaluation boards only have 10 pins, so adding the trace pins for a hardware oriented engineer does not make sense. For the software development access to trace is the only way to solve complex problems in a reasonable time frame.
LikeLike
While I agree with the sentiment that trace is definetly under-used, there often is a lot of work involved in getting it implemented.
Especially if you aren’t running the top-of-the-line MCU and have a much smaller derivative that doesn’t even have the hardware pins routed to pin packages. In that case you’re basically stuck with either porting your code to an evaluation board or using some type of SWD/JTAG trace. But information on that is incredibly scarce.
LikeLike
Pingback: What is “Realtime Debugging”? | MCU on Eclipse
Pingback: ARM SWO Performance Counters | MCU on Eclipse
Pingback: Faster FreeRTOS Percepio Tracealyzer Streaming with Segger RTT | MCU on Eclipse
great article , as I try to trace with jlink, found article in segger site that you should write script called JLinkScript and loaded in segger setting before haveing trace!!!! its hard to write down scriptes when there is no great document about it!!!
LikeLike
thank you, good to hear that this was useful for you. I agree: it requires lots of information to get trace going, that’s exactly why I had to write this article. As well for myself to document things for the next time 😉
LikeLike
Hi, great information! I just wanted to know if we can read the traces in ETB without additional hardware. Consider there are two processors running 2 programs. Can I use ETB to collect trace of program 1, and program 2 simply reads from the ETB? I am having a hard time finding a Cortex-M device with ETB. Any ideas? Thanks!
LikeLike
Hi, thanks! Yes, as long as program2 has access and the priviledges to read that ETB data. If ETB is implemented depends on the device. Most M3, M4, M4 have it implemented, but not every device (probably to save costs), so you have to check your device reference manual. I know that the NXP LPC18xx/43xx and to my knowledge all NXP Kinetis parts with a Cortex-M4 implement it (for example I have used the NXP K64F128 with ETB).
The NXP MCUXpresso IDE reference manual is great source of that kind of information too.
LikeLike
Thanks a lot. This is great information.
LikeLike
Hi, I’m trying to enable the ETM instruction trace on STM32F411VE, I’ve configured GPIO and
ETM as below
DBGMCU->CR |= DBGMCU_CR_TRACE_IOEN; /* enable trace io */
DBGMCU->CR |= (3u<DEMCR |= CoreDebug_DEMCR_TRCENA_Msk; /* enable TPIU */
ETF_BASE_PTR->FCR |= 3u; /* funnel ETM and ITM outputs */
ETM_BASE_PTR->LAR = 0xC5ACCE55; /* unlock ETM registers */
ETM_BASE_PTR->CR &= ~(1u); /* exit power down of ETM */
For some reason, I’m did not observe any activity on trace pins, can you please input you idea on what I might be doing wrong?
LikeLike
It could be that you have not properly configured the trace output pins: check your device configuration/reference manual how to mux them for trace output.
Additionally you need to have the ETM clocked, see the example code on https://github.com/ErichStyger/mcuoneclipse/blob/master/Examples/KDS/TWR-K64F120M/TWR-K64F120M_Demo/Sources/KinetisTrace.c
LikeLike
Hi, can you please give some pointers on how can I enable the ETM-To-TPIU path to write the ETB trace to a region in RAM. I can then use the RAM buffer within my application. Instead of using GPIO pins, I would like it to write to a location in RAM.
Thank you.
LikeLike
I believe the latest MCUXpresso SDK examples do have an example for it.
LikeLike
Thanks for the reply. I looked at the examples. I did not find what I am looking for.
1. With MCUXpresso IDE I can read the partial ETB traces.
2. I would like to have streaming traces using the IDE or just with any other tool like openocd
(I am aware Jlink trace pro can be used for streaming traces from ETM, however I just have Jlink edu mini)
Thank you
LikeLike
I think OpenOCD is not capable enough to do trace streaming?
Not sure what you mean with ‘partial ETB traces’?
As for the J-Link EDU mini: the difference is that the J-Link trace pro has support for the trace pins, so can directly use the hardware.
LikeLike
In order to get the traces from the ETB, I currently have to stop in debug mode and download the contents of ETB. Also, I miss some traces as ETB will be overwritten. I would like to get the complete trace of a program.
LikeLike
Hi,
I’ve configured PTA6 of my k20F microcontroller muxed as TRACE_CLKOUT in order to output the FlexBus clock. I’ve discovered that when i run my code in debug mode ( I’m using a PE micro ) the FlexBus clock outputs to PTA6 pin. When I run my code in free run (no debug involved) the clock is not output to PTA6.
I would like to know if there is a way to output the selected clock to PTA6 even without being in debug mode.
Many Thanks,
Edoardo
LikeLike
Hi Edorado,
yes, debug probes for example enable the DWT block for debugging. So you need to do the same, see for example the code for the cycle counter: https://mcuoneclipse.com/2017/01/30/cycle-counting-on-arm-cortex-m-with-dwt/
LikeLike