Remote debugging an embedded target is very useful: I don’t need a direct debug probe or USB cable connection. Instead, I’m using a network connection (wired or even wireless) over TCP/IP to talk to the debug probe and target. That way I can place the debug probe and target system away from my desk.
In Debugging ARM Cores with IP based Debug Probes and Eclipse I have used IP-based debug probes. This is a logical path, but expensive.
In Remote Debugging with USB based JTAG/SWD Debug Probes I showed how normal USB based debug probes can be used. This approach uses a remote host machine (e.g. desktop machine or notebook). This approach is still expensive, not scalable and the host machine needs a lot of space too.
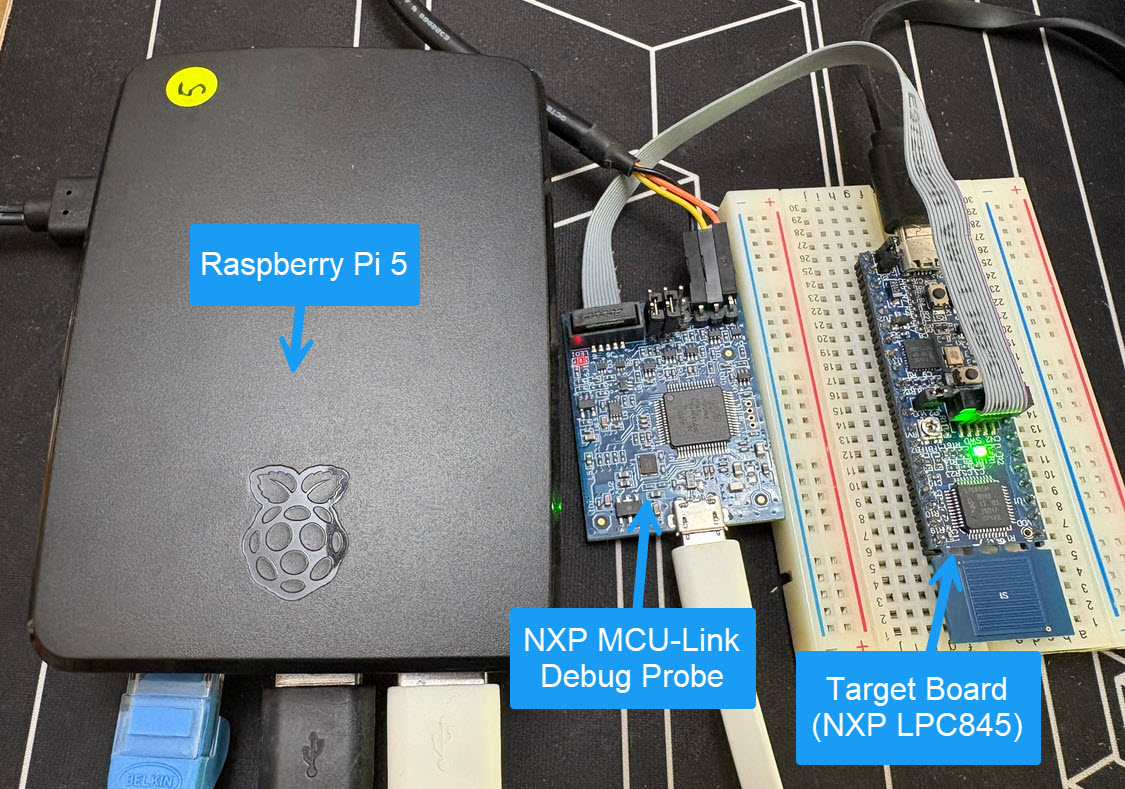
So what if I use a Raspberry Pi instead? The RPi is small, inexpensive and ideal for such a task. Additionally, I can easily use it to build a test or debug farm. In this article, I show the use of the Raspberry Pi for remote debugging. A sub $20 or embedded target debug probe can be employed.
Outline
In this article I’ll show how an inexpensive Raspberry Pi is used as debug probe host. The Raspberry Pi joined with a CMSIS-DAP debug probe. Debugging and programming an embedded target is remote, making it possible to use the setup in a test farm. Another use case is to allow remote debugging ins space constraint environments. Additionally, because the Raspberry Pi includes WiFi support, I can have a ‘wireless’ debug probe.
I’ll show the necessary hardware and software setup and how to attach the debug probe. Using command line commands, I show how remote debugging is used with a remote gdb server. Finally, the necessary setup to use Visual Studio Code for remote debugging is presented.
Hardware and Software
For my setup I’m using the following on the Raspberry Pi:
- Raspberry Pi Model 5 (but any older model like 3 or 4 can be used)
- OpenOCD GDB Server 0.12.0-1+rpt1
- or (recommended): pyOCD 0.36.0
- NXP MCU-Link CMSIS-DAP debug probe
- NXP LPC845-BRK as target board
While OpenOCD works, it has been very slow for my use cases. Instead, I recommend using pyOCD.
The proposed approach works both for an external NXP MCU-Link debug probe, as well for OB (on-board) MCU-Link probes, for example with a NXP FRDM-MCXN236:

In this article, I’m going to use the LPC845, which is a rather old device. I’m also going to use the MCN236, which is a new one.
Installation: gdb, OpenOCD & pyOCD
On the Rasperry Pi, make sure the necessary tools are installed. Depending on your needs, I recommend gdb. You might also need OpenOCD or pyOCD.
GNU Debugger
Install GDB multi-arch:
$ sudo apt install gdb
OpenOCD
Install OpenOCD:
$ sudo apt install openocd
pyOCD
pyOCD uses Python, so make sure to create first a virtual environment:
$ python3 -m venv ./venv
Installation is the easiest way using pip:
$ ./venv/bin/python3 -m pip install -U pyocd
Now you need the necessary CPU packages installed. To check if a package is installed, use for example:
$ ./venv/bin/pyocd pack find MCXN236
To install packs for a target:
$ ./venv/bin/pyocd pack install lpc845 mcxn236 k22
The above installs all the necessary files for LPC845, Kinetis K22 and MCXN236. Adjust for your target system.
MCU-Link
Connect the NXP MCU-Link debug probe to one of the USB ports of the Raspberry Pi.

Checking the log with
$ dmesg | tail
should show something like this:
[10444.124042] usb 1-2: New USB device found, idVendor=1fc9, idProduct=0143, bcdDevice= 3.03
[10444.124047] usb 1-2: New USB device strings: Mfr=1, Product=2, SerialNumber=3
[10444.124050] usb 1-2: Product: MCU-LINK (r0FF) CMSIS-DAP V3.156
[10444.124052] usb 1-2: Manufacturer: NXP Semiconductors
[10444.124055] usb 1-2: SerialNumber: 35KW0CFW45YWG
[10444.262929] hid-generic 0003:1FC9:0143.0007: hiddev96,hidraw0: USB HID v1.00 Device [NXP Semiconductors MCU-LINK (r0FF) CMSIS-DAP V3.156] on usb-xhci-hcd.0-2/input1
[10444.263590] cdc_acm 1-2:1.2: ttyACM0: USB ACM device
It means that the MCU-Link has been properly enumerated as CMSIS-DAP debug probe. Additionally I have now a serial-2-USB interface (ttyACM0).
ttyACM0
The /dev/ttyACM0 has been created for the serial (RX, TX, GND) connection on the MCU-Link debug probe:
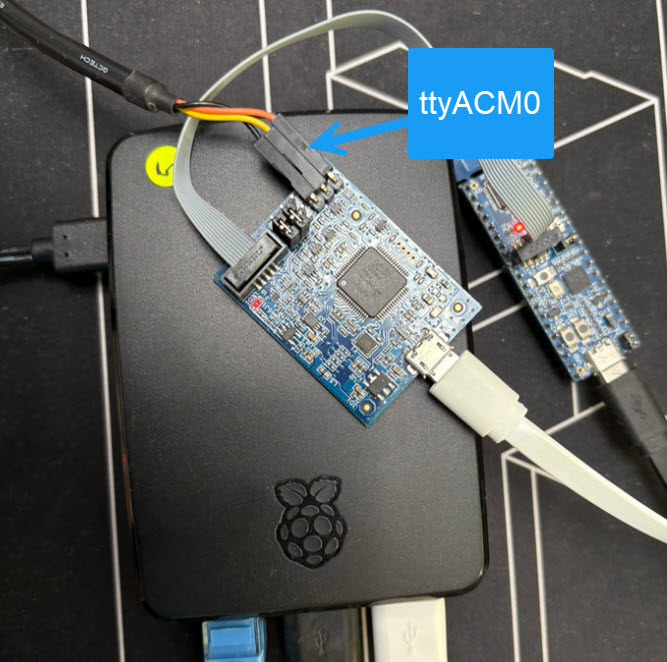
I can use that serial interface for example as UART connection to a target board. This can be useful for test automation. Or I can use it as a serial connection to an addition host machine or test automation infrastructure.
I can use it with any terminal program. For example with the Python pySerial/miniterm:
$ python -m serial.tools.miniterm /dev/ttyACM0 115200 --echo
The above opens a terminal connection using ttyACM0, 115200 baud and local echo.
It works the same way with on-board debug probes offering one or more virtual COM ports.
GDB Server (OpenOCD)
Next, I’m going to start the OpenOCD gdb server on the Rasperry Pi with:
$ openocd -f ./lpc845-brk.cfg -c "bindto 0.0.0.0"
This starts OpenOCD with the settings for my target board (LPC845-BRK). The ‘bindto’ is necessary to allow connections from outside.
The output on the console will be something like this:
Open On-Chip Debugger 0.12.0
Licensed under GNU GPL v2
For bug reports, read
        http://openocd.org/doc/doxygen/bugs.html
cortex_m reset_config sysresetreq

Info : Listening on port 6666 for tcl connections
Info : Listening on port 4444 for telnet connections
Info : Using CMSIS-DAPv2 interface with VID:PID=0x1fc9:0x0143, serial=35KW0CFW45YWG
Info : CMSIS-DAP: SWD supported
Info : CMSIS-DAP: JTAG supported
Info : CMSIS-DAP: SWO-UART supported
Info : CMSIS-DAP: Atomic commands supported
Info : CMSIS-DAP: Test domain timer supported
Info : CMSIS-DAP: UART via USB COM port supported
Info : CMSIS-DAP: FW Version = 2.1.1
Info : CMSIS-DAP: Serial# = 35KW0CFW45YWG
Info : CMSIS-DAP: Interface Initialised (SWD)
Info : SWCLK/TCK = 0 SWDIO/TMS = 1 TDI = 0 TDO = 0 nTRST = 0 nRESET = 1
Info : CMSIS-DAP: Interface ready
Info : clock speed 10 kHz
Info : SWD DPIDR 0x0bc11477
Info : [lpc84x.cpu] Cortex-M0+ r0p1 processor detected
Info : [lpc84x.cpu] target has 4 breakpoints, 2 watchpoints
Info : starting gdb server for lpc84x.cpu on 3333
Info : Listening on port 3333 for gdb connections
The last line tells that the server is waiting for connections on port 3333.
GDB Client with OpenOCD
If you are using pyOCD, you can skip this and the following section.
Next, we are going to connect a GDB (command line) client to the server on port 3333. With this I can test if everything is working.
For this I start gdb with
$ gdb
then connect to the remote target (replace localhost with name or IP of your Raspy)
(gdb) target remote localhost:3333
halting the target:
(gdb) monitor halt
loading the binary
(gdb) load lpc845_red.elf
reset and run the application
(gdb) monitor reset
This can be automated:
# call script file with
#  gdb -x <script>

# connect to remote target
target remote localhost:3333

# halt the target
monitor halt

# flash application file
load lpc845_green.elf

# reset target
monitor reset

# detach from target
detach

# exit gdb
quit
call it with
$ gdb -x gdb_script.txt
Using pyOCD
With pyOCD we are going to use the virtual environment we have created previously.
To program a binary:
$ ./venv/bin/pyocd flash -t lpc845 lpc845_green.elf
Or for a binary for the FRDM-MCXN236:
$ ./venv/bin/pyocd flash -t mcxn236 FRDM-MCXN236_Blinky.elf
In a similar way, I can erase the flash of the chip:
./venv/bin/pyocd erase --chip -t mcxn236 FRDM-MCXN236_Blinky.elf
To get help about a command:
$ ./venv/bin/pyocd flash --help
Launching a gdb server for the LPC845:
$ ./venv/bin/pyocd gdbserver -t lpc845 --persist --allow-remote
In a similar way, the command line for the MCXN236:
$ ./venv/bin/pyocd gdbserver -t mcxn236 --persist --allow-remote
To program a binary using gdb, I can use the following script (gdb_script_pyocd.txt):
# Usage:
#  gdb <elf-file> -x <script>

# connect to remote target
target remote localhost:3333

# halt the target
monitor halt

# flash application file
load

# reset target
monitor reset

# detach from target
detach

# exit gdb
quit
Change ‘localhost’ to the name of your remote machine, and call it like this:
$ gdb lpc845_blue.elf -x gdb_script_pyocd.txt
To to the same thing for the FRDM-MCXN236, I use
$ gdb FRDM-MCXN236_Blinky.elf -x gdb_script_pyocd.txt
With this, I have a remote client-server connection with GDB and can do command line debugging. For more about this topic, see Command Line Programming and Debugging with GDB.
Multiple Probes
It is not unusual to have multiple boards and debug probes attached. The next command lists the attached probes:
$ ./venv/bin/pyocd list --probes
This shows something like this:
  #   Probe/Board                                                        Unique ID       Target
--------------------------------------------------------------------------------------------------------
  0   NXP Semiconductors MCU-LINK (r0FF) CMSIS-DAP V3.156                35KW0CFW45YWG   n/a

  1   NXP Semiconductors MCU-LINK FRDM-MCXN236 (r0E7) CMSIS-DAP V3.130   DUHMBUWYNA3ZF   mcxn236vdft
      NXP                                                                FRDM-MCXN236
To explicitly select a debug probe, I can use the -u option with its ID or serial number:
$ ./venv/bin/pyocd flash -t mcxn236 -u DUHMBUWYNA3ZF FRDM-MCXN236_Blinky.elf
Remote Debugging with VS Code
So far I have used command line tools. But of course the same can be used with an IDE like VS Code.
What I need is
- The gdb server running on the Rasperry Pi (see above)
- Connect to it using its IP or host host name
If using the NXP debug extension, I can use the following in the launch.config
"gdbServerTargetRemote": "eee-04887.simple.eee.intern:3333",

Summary
I can use a Raspberry Pi in combination with the NXP MCU-Link CMSIS-DAP debug probe for remote debugging. I’m using this approach with OpenOCD or pyOCD (recommended). The concept involves attaching the debug probe and/or target probe to the Raspberry Pi. The run a GDB server on it and connect to it with a gdb client from a remote host machine. The gdb client on the host can be just gdb (command line mode) or an IDE like VS Code.
That way I have remote debugging capabilities. Because the Raspberry Pi offers both wired and wireless connection, I can have a wireless debug probe. This is great for test farms, test or debugging automation. Additionally, I do have a virtual COM to the embedded target system available through the debug probe.
Happy remoting 🙂
Links
- Debugging ARM Cores with IP based Debug Probes and Eclipse
- Remote Debugging with USB based JTAG/SWD Debug Probes
- Command Line Programming and Debugging with GDB
- OpenOCD with MCU-Link
- New MCU-Link Debug Probe from NXP
- NXP MCU-Link: https://www.nxp.com/design/design-center/software/development-software/mcuxpresso-software-and-tools-/mcu-link-debug-probe:MCU-LINK
- Using NXP i.MX RT685 with pyOCD: Device Support and Debugging Configuration
- Debugging Embedded Targets with pyOCD and Eclipse

Hi Erich! Did one of your posts cover where to get the OpenOCD configuration, or how to create it? I’m new to OpenOCD. I found the k60.cfg configuration that it comes with and that seemed to work for a K22DX256 but I’m still trying to figure out how to get it to work with a K02FN64.
LikeLike
The K02FN64 is very similar to the K22FN512, so that one should work too. I don’t have my K64FN64 at hand right now, so I cannot try it.
LikeLike
I looked a little closer and k60.cfg and k40.cfg just set the name and then reference kx.cfg. Is kx.cfg applicable to all of the Kinetis parts?
LikeLike
Yes, kx.cfg should be applicable for all Kinetis parts.
LikeLike