The gnuplot is a versatile and powerful tool to plot and visualize all kind of data. I wish there would be a plugin for it in Eclipse. But as this is not (yet?) the case, here is how I’m using it with gdb and Eclipse, using the MCUXpresso IDE as example.

Gnuplot with Eclipse
Outline
The NXP MCUXpresso IDE already comes with good visualization plugins, but not as powerful as gnuplot. So have explored ways how to use gnuplot from Eclipse, and this is what this article is about. For this article I’m using the following:
- MCUXpresso IDE V11.1.0 with GNU gdb (GNU Tools for Arm Embedded Processors 8-2019-q3-update) 8.3.0.20190703-git
- GNU gnuplot Version 5.2 patchlevel 8
- GNU awk version 3.1.6
- GNU sed version 4.2.1
Instead using a manual way to export data (see “Dump my Device Memory“)
How does it work? I’m using a modified approach which I inherited from http://sourceware.org/gdb/wiki/PlottingFromGDB. The idea is to use gdb scripting to export data, manipulate it with awk and sed and then show it with gnuplot. That process works with on any host, but for Windows (10 64bit in my case) I had to tweak it.
Installation
- Install gnuplot from http://www.gnuplot.info/ and install it. Gnuplot is a very powerful package to plot data.
- Download awk from http://gnuwin32.sourceforge.net/packages/gawk.htm. With this tool records/line in a file can be searched and processed.
- Download sed from http://gnuwin32.sourceforge.net/packages/sed.htm. The sed (stream editor) is used to search and replace strings.
The gnuplot, awk and sed needs to be present in the PATH. Instead adding them to the path, for the MCUXpresso IDE I can place the binaries into the IDE buildtools bin folder:
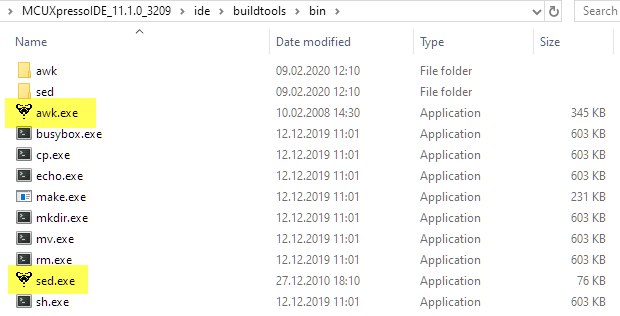
awk and sed in MCUXpresso IDE
Because I’m using gnuplot independently, I have put it into the PATH.
GDB Script
The gdb script has the following content (you can find the script on GitHub too):
# plot1d.gdb
#
# Copyright (C) 2008 Florian Lorenzen
#
# Plot an expression that expands to {x1, x2, ..., xN}, i. e.
# N numbers using gnuplot.
#
# This file is for the GNU debugger 6.x.
#
# It writes temporary files named __plot1d.dump, __plot1d.dat, __plot1d.gp, so
# you should not have files of the same name in the working directory.
#
# It requires sed, awk, and gnuplot available in the $PATH.

# plot1d_opt_range
#
# Plot the points of  passing  as plot options using
#  in the set yrange command.
define plot1d_opt_range
  shell rm -f __plot1d.dump __plot1d.dat __plot1d.gp
  set logging file __plot1d.dump
  set logging on
  output $arg0
  set logging off
  shell awk "/~/ {print $0}" < __plot1d.dump | sed -r "s/~\""|,|\{|\}|\""//g" > __plot1d.dat
  shell echo set title "$arg0"; set yrange $arg2; plot "__plot1d.dat" with lines > __plot1d.gp
  shell gnuplot --persist __plot1d.gp
#  shell rm -f __plot1d.dump __plot1d.dat __plot1d.gp
end

# plot1d
#
# Just plot the points of .
define plot1d
  plot1d_opt_range $arg0 "" [*:*]
end

# plot1d_opt
#
# Plot the points of  passing  to the
# plot command after the datafile. So, one can pass
# "with lines" here.
define plot1d_opt
  plot1d_opt_range $arg0 $arg1 [*:*]
end
Place that file into your project root or put it into the .gdbinit. I prefer to have it in the project root so I can have different ones for each project:

plot1d.gdb in project root
Using it
Debug the application and suspend (halt) the debugger. Switch to the Debugger Console and issue the following gdb command to load the script, needed for each debug session:
source plot1d.gdb

gdb source command
To show the data, use the following command in the gdb debugger console. The example uses an array of integers, and the name of the array is ‘array’ 🙂
plot1d array
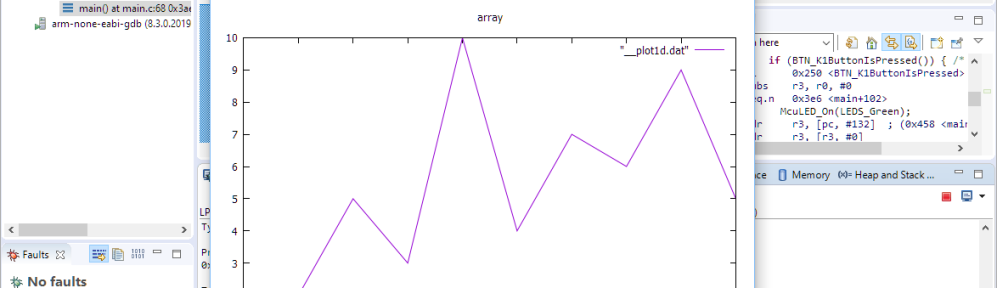
This prints the data on the console and shows the gnuplot window:
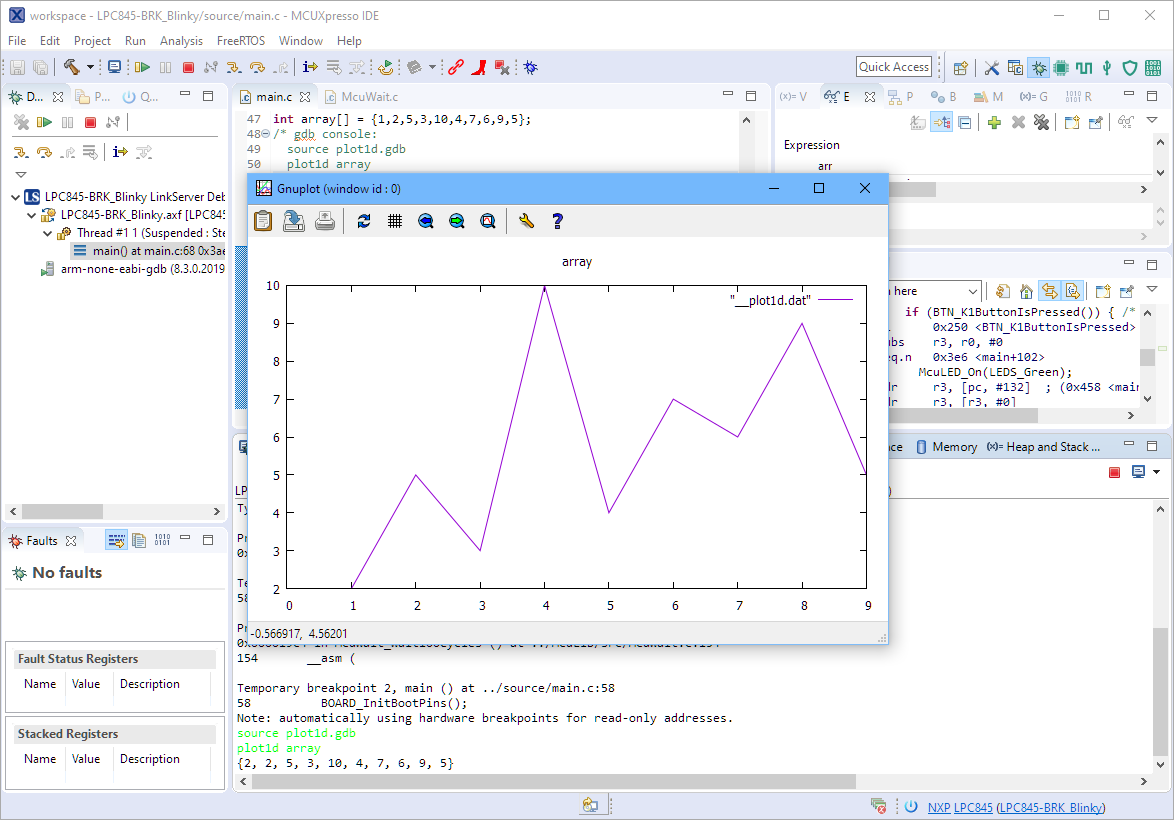
Gnuplot with Eclipse
From the gnuplot window I can inspect the data, export it or otherwise process it. Close the gnuplot window to continue debugging.
How it works
The ‘source’ command loads a script which is used to export and process the data. The ‘plot1d’ script calls the ‘plot1d_opt_range’ script:
define plot1d_opt_range
  shell rm -f __plot1d.dump __plot1d.dat __plot1d.gp
  set logging file __plot1d.dump
  set logging on
  output $arg0
  set logging off
  shell awk "/~/ {print $0}" < __plot1d.dump | sed -r "s/~\""|,|\{|\}|\""//g" > __plot1d.dat
  shell echo set title "$arg0"; set yrange $arg2; plot "__plot1d.dat" with lines > __plot1d.gp
  shell gnuplot --persist __plot1d.gp
  shell rm -f __plot1d.dump __plot1d.dat __plot1d.gp
end
💡 I have disable the original ‘extra option’ feature from the original script as it did work very well for me.
The following removes the temporary files if they are still present (make sure you are not having any valid files with such names):
shell rm -f __plot1d.dump __plot1d.dat __plot1d.gp
The .dump file is a dump file from gdb, the .dat file is the result manipulating the data from that dump file, and finally the .gp is the gnuplot script file which is used to visualize the data.
Assuming our array contains the following data:
{1, 2, 5, 3, 10, 4, 7, 6, 9, 5}
The following gdb script lines will log the values of the array to the dump file:
set logging file __plot1d.dump
set logging on
output $arg0
set logging off
$arg0 is the array name (variable) we are interested in. On challenge I faced was that gdb writes the following to the dump file:
108^done
(gdb)
~"{1"
~", 2"
~", 5"
~", 3"
~", 10"
~", 4"
~", 7"
~", 6"
~", 9"
~", 5"
~"}"
109^done
(gdb)
The GNU awk is used to filter that data. With
shell awk "/~/ {print $0}" < __plot1d.dump
it filters all lines which have a “~” present and printes the whold line ($0). So it gives this:
~"{1"
~", 2"
~", 5"
~", 3"
~", 10"
~", 4"
~", 7"
~", 6"
~", 9"
~", 5"
~"}"
The GNU awk is used to search-and-replace things. It uses the following format
"s/<search-pattern>/<replace-with>/g"
With this, the following
sed "s/~\""//g"
will search for ~” (notice that the double-quote has to be escaped with \””) and replace it with ‘nothing’. The result is:
{1"
, 2"
, 5"
, 3"
, 10"
, 4"
, 7"
, 6"
, 9"
, 5"
}"
To ‘or’ different patterns with extended regular expressions using ‘|’, I have to use the -r option:
sed -r "s/~\""|,|\{|\}|\""//g"
The above searches for
~"
,
{
}
and replaces it with ‘nothing’ and results in:
1
2
5
3
10
4
7
6
9
5
Exactly what is needed as input for gnuplot :-). The following combines awk and sed:
shell awk "/~/ {print $0}" < __plot1d.dump | sed -r "s/~\""|,|\{|\}|\""//g" > __plot1d.dat
Next a script file for gnuplot is created:
shell echo set title "$arg0"; set yrange $arg2; plot "__plot1d.dat" with lines > __plot1d.gp
The resulting file looks like this:
set title "array"; set yrange [*:*]; plot "__plot1d.dat" with lines
It sets the graph title with the name of the variable, specifies the y-range, and finally plots the data file ‘with lines’.
💡 Consult the gnuplot manual for more advanced plotting options.
The gnuplot tool gets called with the –persist option to keep the windows open:
shell gnuplot --persist __plot1d.gp

gnuplot
Finally, the temporary files get removed:
shell rm -f __plot1d.dump __plot1d.dat __plot1d.gp
💡 for script debugging, comment the above line so you can inspect the generated files.
Summary
While a gnuplot Eclipse plugin would be perfect, I still can use the gnuplot tool with Eclipse and gdb. It helps me to export and visualize data which is especially helpful for sensor or scientific data. I hope you find it useful too.
Happy Plotting 🙂
Links
- GNU gnuplot home page: http://www.gnuplot.info/
- Introduction to gnuplot (in German): https://www.tu-chemnitz.de/urz/archiv/kursunterlagen/gnuplot/gnuplot.html
- GNU awk homepage: http://gnuwin32.sourceforge.net/packages/gawk.htm
- GNU sed homepage: http://gnuwin32.sourceforge.net/packages/sed.htm
- GDB script file on GitHub: https://github.com/ErichStyger/mcuoneclipse/blob/master/Examples/MCUXpresso/LPC845-BRK/LPC845-BRK_Blinky/plot1d.gdb
- Visualizing data with MCUXpresso: Visualizing Global Variables while Target is Running with Eclipse and MCUXpresso IDE

Very cool use of GDB! Rather than wrestle with awk and sed for transforming output, I usually find it easier to write a tiny python script which uses standard regex syntax.
LikeLike
For simpler cases awk and sed are great. I have found that in a class room environment python is more challenging with different versions floating around, while awk and sed are installed on Linux and easy to get for Windows.
LikeLike
Nice!
Maybe you want to try the following single sed command instead your awk/sed combination:
sed -rn ‘s/~[^0-9]+([0-9]+)”/\1/p’
(this only works for an array of numbers)
LikeLike
thank you (still learning sed)
LikeLike
Erich,
NXP sent out an email today about a new version of FreeMaster.
I had never used the old version but I look and saw that you wrote a tutorial about it several years ago.
Do you think that FreeMaster would be a viable way to visualize the data arrays that I’m trying to work with?
Thanks,
Greg
LikeLike
Hi Greg,
interesting, I have not received such an email. I have used the old version, but not much after I have discovered the SEGGER J-Scope and SEGGER SystemViewer. I saw that FreeMaster is now part of the MCUXpresso SDK, so I have to check it out if time permits.
Thanks,
Erich
LikeLike
Pingback: Dumping Variables and Arrays with GDB in Eclipse | MCU on Eclipse
Hello thank you for help and if somebody challanges the max array size limitation here is a solution. Include to GDB script before line “set logging on” these lines:
set max-value-size unlimited
set print elements 0
set print repeats 0
set pagination off
Enjoy
LikeLike
Hi Miroslav,
thanks for sharing, did not think about using that, indeed nice solution!
LikeLike