
Mostly unnoticed (at least for myself), SEGGER has enabled some of the J-Link debug probes to support the CMSIS-DAP debug protocol.

This greatly enhances the use of J-Link debug probes for CMSIS-DAP based tools.
Outline
Probably most developers do not care about what is used in the debug chain, as long as it is fast and it works.CMSIS-DAP has been originally developed by mbed and ARM. Basically it is a protocol definition (over USB) between the debugger (e.g. gdb with OpenOCD) and a debug probe.

What makes things confusing is that ARM named the firmware running on the debug probe as well ‘CMSIS-DAP’. Later on the ARM open source firmware was named DAPLink.
At the University of Lucerne we are doing research around debugging which uses the CMSIS-DAP protocol. With this, possibly any CMSIS-DAP ‘compatible’ probe could be used with debuggers supporting that protocol.
Boot as CMSIS-DAP Probe
Switching to CMSIS-DAP mode is not supported for all J-Link probes, but is supported for the J-Link EDU we use:

💡 According to a forum question only probe hardware of the latest generation can be configured for CMSIS-DAP.
To switch between the modes, run the JLinkConfig utility and use the ‘Boot mode’ configuration drop-down:

If the probe does not support CMSIS-DAP, then there is no such Boot mode option.
After that, it shall enumerate as USB HID device with VID 0x1366 and device IDE 0x1008:

NXP MCUXpresso IDE
💡 Using the J-Link in CMSIS-DAP mode with the MCUXpresso IDE is not officially supported and should be considered as experimental.
To use the J-Link with the LinkServer debug connection inside the NXP MCUXpresso IDE, the above vendor ID (0x1366) and Device ID (0x1008) have to be known to the IDE.
For this, open with a text editor the file <IDE Installation path>/ide/binaries/Scripts/probetable.csv:
and add the following line with the VID/DID at the start of the group with “CMSIS-DAP”:
0x1366, 0x1008, 1024, 1, 1, 0, 0, 0, "CMSIS-DAP", 0xFF00, 0, -1

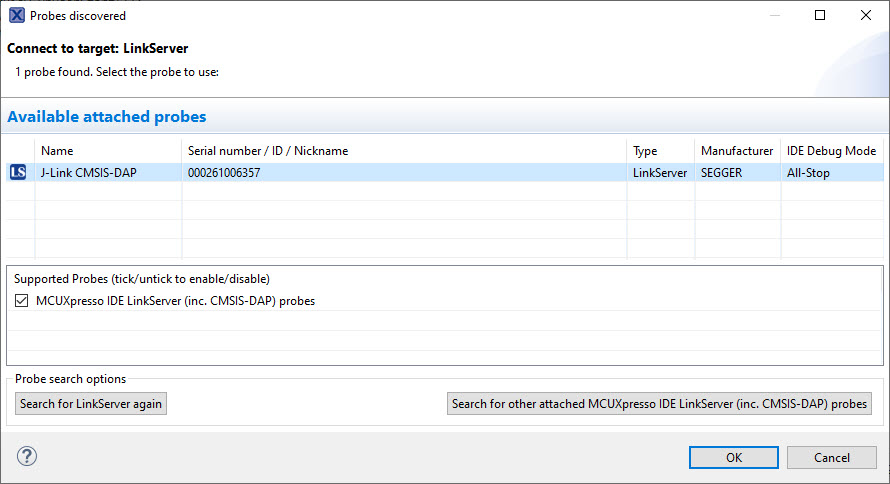
With this, start the IDE. With using the LinkServer connection, the J-Link shows up as CMSIS-DAP debug probe:
Debugging works well with the targets tested, including FreeRTOS thread-awareness:

Summary
It is possible to switch certain J-Link debug probes into CMSIS-DAP protocol mode. This can be very convenient if the debugger or external tool requires CMSIS-DAP. That way the J-Link debug probes can be used in a universal way.
With adding the USB IDs to the MCUXpresso configuration file, they are recognized by the LinkServer connection as CMSIS-DAP debug probes, and can be used like any other probe.
Using the approach presented here, one can use CMSIS-DAP based probes without the need for installing OpenOCD or PyOCD. It enables the J-Link to be a fast CMSIS-DAP, but the same time I loose remote server support, or RTT (unless the debugger would do it off-the-probe).
Support for J-Link CMSIS-DAP probes in the MCUXpresso IDE is not officially supported, and there is not much information about it on the SEGGER site. So consider this as experimental and use it at your own risk. But that’s what research is about ;-).
I hope you find this article useful for your own research.
Happy DAPing:-)
Links
- MCUXpresso IDE: https://mcuoneclipse.com/2023/01/25/nxp-mcuxpresso-ide-11-7-0/
- SEGGER: https://www.segger.com/
- SEGGER and CMSIS-DAP: https://www.segger.com/news/segger-j-link-now-supports-cmsis-dap/
- SEGGER Wiki: https://wiki.segger.com/J-Link_Software_CMSIS-DAP

This is cool. I wish DAPLink, PyOCD and other similar debuggers separated the connection between the host and the debugger so that it could be USB or WiFi or serial or anything else.
LikeLike
Hi Harjit,
actually, they do support this kind of things in some way, at least between the gdb client (gdb, eclipse or visual studio code) and the gdb server (e.g. J-Link, OpenOCD or PyOCD). The communication between the client and the server is over TCP, so as long you have have some kind of TCP translation between the client and the server, that works fine. But you are correct: there is no such thing between the server and the debug probe, and most probes use either Ethernet (wired or WiFi) or USB for that kind of connection.
LikeLike