
We all should know it: dynamic memory usage can be dangerous. There can be memory fragmentation, use-after-free, out-of-memory and memory leaks. While I do prefer static memory allocation for embedded systems, using a dynamic memory allocation in some applications is not avoidable or just makes sense.
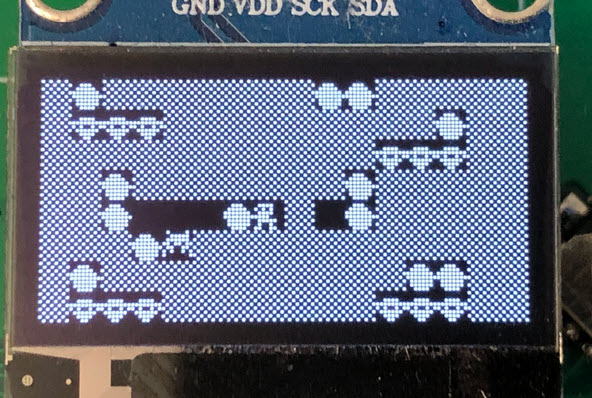
In one of my lecture modules we develop a ‘Boulder’ game, where the player has to collect underground diamonds and avoid moving monsters:

I’ll show you have FreeRTOS memory usage can be tracked and monitored.
Outline
The game uses lots of animated and moving ‘sprites’ which get dynamically created and destroyed. The game is used to teach many aspects of embedded systems (interrupts, reentrancy, threads, semaphore, mutex, events, …) and runs with FreeRTOS:
One challenge with such a dynamic application is a correct memory management. In this article I show you how FreeRTOS can be instrumented to monitor Heap events with SystemView:

Eclipse Heap View
Students already can see and monitor the heap memory usage in Eclipse using the NXP MCUXpresso IDE:

But this only shows the current state of the allocated blocks, in a ‘static’ way. What we need is who allocated the block, and when it was released. We can get this with SystemView, with the help of an extended and instrumented FreeRTOS.
SystemView
Students use as well the Segger SystemView to record and monitor the task execution. When I downloaded and installed the latest Version v3.50a, I noticed a new ‘Heap’ view in it:

There is some documentation about this new view, and the API documentation is very minimal. And there is no guidance how to use it for example with FreeRTOS. Over this long weekend I decided to upgrade to FreeRTOS 202212.01 (V10.5.1) and to implement heap memory monitoring.
FreeRTOS V10.5.1 and SystemView V3.50a
Using SystemView requires patching FreeRTOS to use the SystemView hooks for heap monitoring and heap event generation. I have updated both the McuLib and Processor Expert ports (see links at the end of the article).
The events are turned on by default, but can be turned off with a configuration setting:
#define configUSE_SEGGER_SYSTEM_VIEWER_HEAP_EVENTS (0) /* 0: disabled heap events */
To have SystemView recording and monitoring the heap events, we need to instrument the application. I have instrumented and extended the FreeRTOS Kernel to keep track of all heap events, included the ones from the kernel.
Register Heap
The heap needs to be registered first. You can register any number of heaps. Below is the FreeRTOS heap implementation which calls SEGGER_SYSVIEW_HeapDefine():
#if configUSE_SEGGER_SYSTEM_VIEWER_HOOKS
  SEGGER_SYSVIEW_HeapDefine(ucHeap, ucHeap, sizeof(ucHeap), sizeof(BlockLink_t));
#endif
The first parameter is a ‘heap identifier’, followed by a pointer to the memory itself, the size and the internal memory block overhead. That overhead is used to calculate the free and used space of the heap. This creates a ‘Define Heap’ event:

💡 Attentive readers will notice the wrong detail message. This already has been reported to Segger, so I expect this to be fixed in a next version of SystemView.
The recorded event is shown as well in the ‘Heap’ view:

With this, the SystemView knows about the heap and its size, and it can be tracked. Note that it is possible to have multiple heaps defined.
Resource ID
To have a name for the heap, I can set a name for a resource, using SEGGER_SYSVIEW_NameResource():
#if configUSE_SEGGER_SYSTEM_VIEWER_HOOKS /* << EST */
  SEGGER_SYSVIEW_HeapDefine(ucHeap, ucHeap, sizeof(ucHeap), sizeof(BlockLink_t));
  SEGGER_SYSVIEW_NameResource((uint32_t)ucHeap, "heap4");
#endif
With this, the resource shows up with a symbolic name:

Memory Allocation
Each block or memory allocation is tracked with a call to SEGGER_SYSVIEW_HeapAlloc(): FreeRTOS-Trace defines the traceMALLOC() macro, but this one is not sufficient for the SystemView events.
#if configUSE_SEGGER_SYSTEM_VIEWER_HOOKS
  SEGGER_SYSVIEW_HeapAlloc(ucHeap, pvReturn, xWantedSize);
#else
  traceMALLOC( pvReturn, xWantedSize );
#endif
This creates ‘Allocate Memory’ events which are shown in the event log:

It knows about the context (e.g. task) where the allocation happens. The events are shown in the Heap view as below:

The really cool thing is that I can filter for the events (unfortunately, I cannot sort the columns). It keeps track of the allocation, free and used sizes, including peak usage which is great.
Memory Free
In a similar way, freeing of memory is tracked with SEGGER_SYSVIEW_HeapFree():
#if configUSE_SEGGER_SYSTEM_VIEWER_HOOKS
  SEGGER_SYSVIEW_HeapFree(ucHeap, pv);
#else
  traceFREE( pv, pxLink->xBlockSize );
#endif
The event is shown in a similar way:

De-allocation events are shown with a non-solid red icon. Memory blocks which have been allocated and released later are shown with a non-solid green icon.

Memory which is still allocated is displayed with a solid green icon:

This makes it really easy to spot memory leaks in the Heap or general events view.
Tagging Memory
Another useful feature is the ability to tag the memory. Basically I can assign a number to a memory block which then can be used for filtering:

This is accomplished using the following which is part of the FreeRTOS pvPortMallocExt():
void SEGGER_SYSVIEW_HeapAllocEx(void* pHeap, void* pUserData, unsigned int UserDataLen, unsigned int Tag);
For example I can use a list of different memory types as an enumeration:
typedef enum SYSVIEW_HeapTag_e {
  SYSVIEW_HEAP_TAG_TIMAGE,
  SYSVIEW_HEAP_TAG_IMAGE,
  SYSVIEW_HEAP_TAG_PIXELS,
  SYSVIEW_HEAP_TAG_SPRITE,
  SYSVIEW_HEAP_TAG_SPRITE_IMAGE,
} SYSVIEW_HeapTag_e;
And then use the tag with pvPortMallocExt():
SpriteImage_t *Sprite_NewImageFromROM(const PIMAGE image) {
  SpriteImage_t *p;
  PIMAGE i;

  /* create new sprite image */
  p = pvPortMallocExt(sizeof(SpriteImage_t), SYSVIEW_HEAP_TAG_SPRITE_IMAGE);
  assert(p!=NULL);
  /* create the image in RAM. PIMAGE is pointing to ROM data */
  i = pvPortMallocExt(sizeof(TIMAGE), SYSVIEW_HEAP_TAG_TIMAGE);
  assert(i!=NULL);
  i->pixmap = pvPortMallocExt(image->size, SYSVIEW_HEAP_TAG_IMAGE);
  assert(i->pixmap!=NULL);
  memcpy((void*)i->pixmap, image->pixmap, image->size);
  i->size = image->size;
  i->height = image->height;
  i->width = image->width;
  i->name = NULL; /* don't care */
  p->image = i;
  p->next = p; /* circular */
  p->prev = p; /* circular */
  return p;
}
With this, the different blocks are tagged and I can filter them:

Summary
Dynamic memory usage can be challenging, but it is now easy to instrument FreeRTOS to report memory events and have it visualized in SystemView. That makes it easy to track who is allocating memory, and if it is properly freed again. It is very helpful as well to get the peak memory usage, to adjust the heap memory allocated.
For this, I have extended the FreeRTOS port to take advantage of additional instrumentation, to keep track of memory allocation and de-allocation. The port and implementation for FreeRTOS 10.5.1 can be found on GitHub (see links below).
The API allows to track multiple heaps in parallel. For the moment it I have it implemented for the FreeRTOS heap versions. If time permits, I’ll have it extended to the C/C++ Standard Library too.
Happy memorizing 🙂
Links
- Segger SystemView: https://www.segger.com/products/development-tools/systemview/
- FreeRTOS 202212.01 download: https://github.com/FreeRTOS/FreeRTOS-Kernel/releases/tag/V10.5.1
- McuLib FreeRTOS port on GitHub: https://github.com/ErichStyger/McuOnEclipseLibrary/tree/master/lib/FreeRTOS
- Processor Expert components on GitHub: https://github.com/ErichStyger/McuOnEclipse_PEx

This is useful as we have started using SystemView and abandoned Tracealyzer.
LikeLike
I’m still using both. Each tool has its pros and cons. I like the graphical (chart) views of heap and custom data in Tracealyzer.
LikeLike
I agree, but Tracelyzers pricing model is unacceptable for us. We now do our own custom data logging.
LikeLike
Of course, in embedded, dynamic memory is a verboten which is one of the reasons why C++ isn’t used. OTOH, if you have to use it, this isn’t a bad setup so that a person can verify that you don’t have memory leaks.
LikeLike
Using C++ does not mean you are using dynamic memory by default. It all depends how and what you are using. For example using static classes is perfectly fine.
In contrast, you might already use dynamic memory if using a printf() (depending on the library). So it is not necessarily the fault of the language, but what libraries are used.
LikeLike
True that. The problem is in one of paying attention. Lots of modern programmers don’t do that so it’s important to know exactly what your (and your libraries) code is doing. C++ is fine (even a good thing) as long as you know what the underlying things are doing and don’t do the things your used to as a desktop programmer.
LikeLike
Hmmm…. I use C++ and FreeRTOS and no dynamic memory.
LikeLike
Graphical views of heap and custom data can in fact be useful.
It’s on our list for Systemview.
One of the nice things about Systemview is our friendly licensing.
Free for educational and non commercial use. No hassles, download and go!
And BTW: Thanks Erich, for giving our heap management a spin with this project
and extending the FreeRTOS port.
LikeLiked by 1 person
The sooner the better 🙂
LikeLike