“As an engineer, you should ask for the best tools available. Spending money for better tools can make the difference between finding a problem quickly, or wasting days or weeks, and ultimately failing a project.” (unknown)
I had to learn it the hard way: some ‘hard-to-find-problems’ sometimes only can be found with some amount of luck, or with using a good trace solution. CodeWarrior already supports trace, such as using the MTB on the Cortex-M0+. But with this I’m limited to the on-chip trace buffer or on-chip RAM, which is better than nothing. But to solve the real hard problems, a bit of more power and memory is needed. And here where the P&E Tracelink comes into play: with 128 MByte trace buffer it would allow me to record a lot more trace data :-).
P&E Tracelink Package
It arrived a couple of weeks ago, but now as I had such a ‘hard-to-find-problem’, it was finally time to get my hands on it. The P&E Tracelink comes in a box with 9V Power Supply, all needed cables, CD and the Tracelink unit itself:
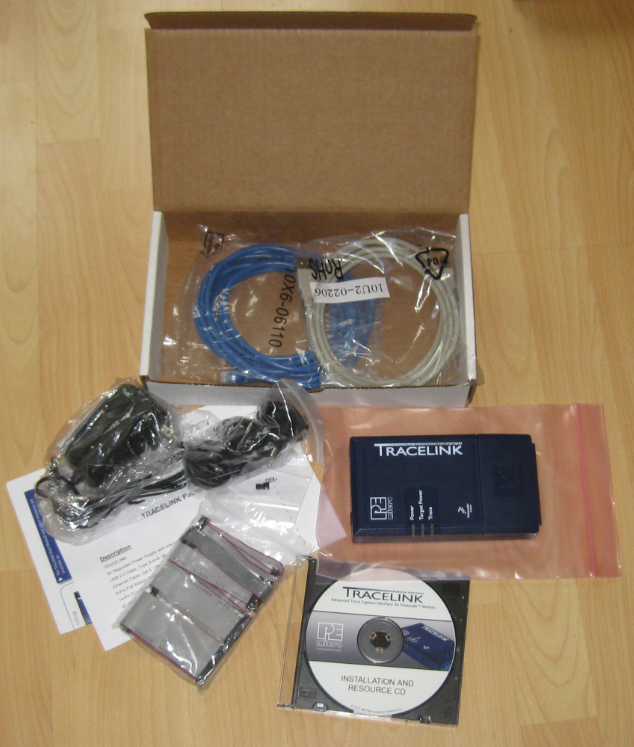
TraceLink Box Content
My unit is a Rev. A one. It came with the Cortex Mini-20pin cable, but not with the Cortex Mini-10pin one (as used on the Freescale Kinetis-L (e.g. Freedom KL25Z board). Not a big deal as I had such a 10 pin cable already at hand. The 20 pin cable can be used instead of the 10 pin one (only connecting the first 10 pins).
Tracelink using the 10 pin Cortex cable connecting to the KL25Z Freedom board (ARM Cortex-M0+):

ARM Cortex-M0+ 10pin debug cable
The Tracelink unit can be opened similar to the Universal Multilink/FX and provides access to the internal connectors for the different targets supported:

TraceLink Unit Open
The Tracelink features connectivity through USB and Ethernet, and the 9V plug is used to power the unit:

TraceLink and USB Multilink Universal
Software
The P&E CD installs drivers, PDF manuals plus a utility to configure the Tracelink IP Address:

Installed TraceLink Software
It supports Kinetis and the ColdFire V2/V3/V4 cores, and the unit is prepared to support other cores.
Tracelink IP Configuration
The Tracelink features a TCP/IP port which is configured through the P&E ConfigureIP_Tracelink.exe utility:
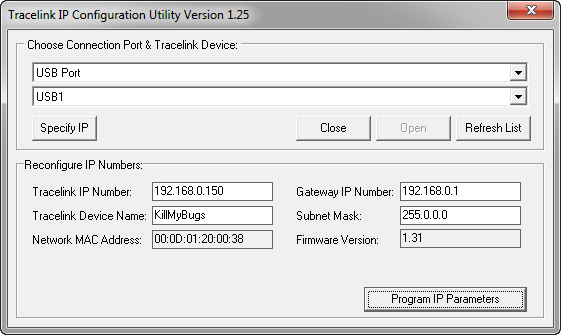
Tracelink IP Configuration Utility
CodeWarrior for MCU10.3
The Tracelink can be used not only for trace, but as well for normal debugging. Both the USB and Ethernet connection method is supported by CodeWarrior out of the box:

Tracelink in CodeWarrior Debugger
With the Tracelink enabled, it offers settings beyond what is usually possible with OpenSDA:

Tracelink Settings in CodeWarrior Debugger
The first time I connected with it, it automatically updated the firmware like P&E does for the OpenSDA firmware:
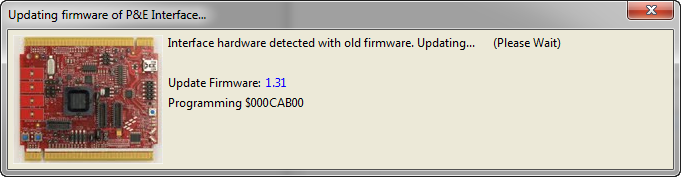
Automatic Update of Tracelink Firmware
With that, debugging was like with the OpenSDA debug connection, except that I was able to increase the Shift Clock Frequency:

Shift Clock Frequency
With this, at least for the Kinetis-L downloading a 55 KByte binary was about 25% faster (hand-stopped time) :-). And using the Ethernet interface was about 30% faster 🙂 :-).
Buffer Size
The Tracelink offers several buffer sizes:

Tracelink Trace Buffer Size
In the ‘Trace and Profile’ tab I have trace enabled in continuous mode:

Enabled Trace and Profile
This sets up a trace buffer in RAM (see this post), so I need to recompile my application.
❗ Note that the Kinetis-L does not have dedicated trace pins. Instead, trace will be read from the Kinetis-L internal trace buffer in RAM.
Collecting Trace
For my problem, I wanted to collect full trace information, as I wanted to get an overview what is going on in my application. Clearly, this is slowing down things, as a lot of data needs to be sent from the target to the Tracelink and then to the host PC. This is shown in the Eclipse status corner:

Collecting Trace
When I stop the application (or at the end of trace collection), the collected information is available:
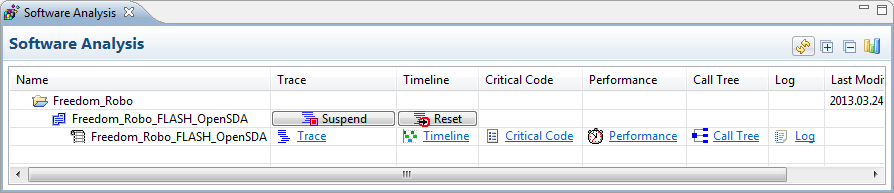
Collected Trace
Trace
Clicking on the ‘Trace’ link gives me a ‘table’ view with instructions executed. If I organize the source view and the trace side by side, I can step back and forward through the trace:

Trace and Source side-by-side
Timeline
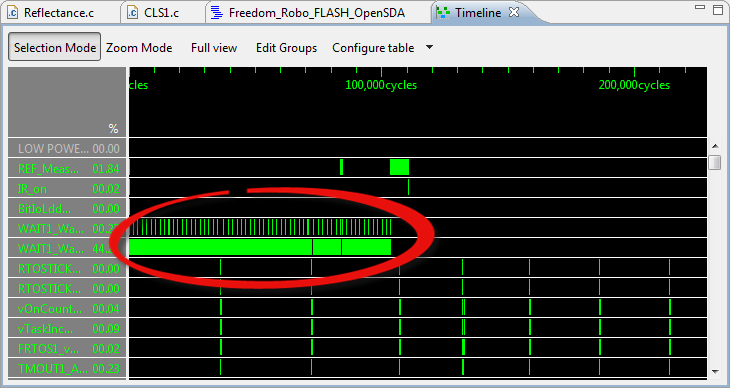
Clicking on the Timeline link gives me an idea what is going on in my application:
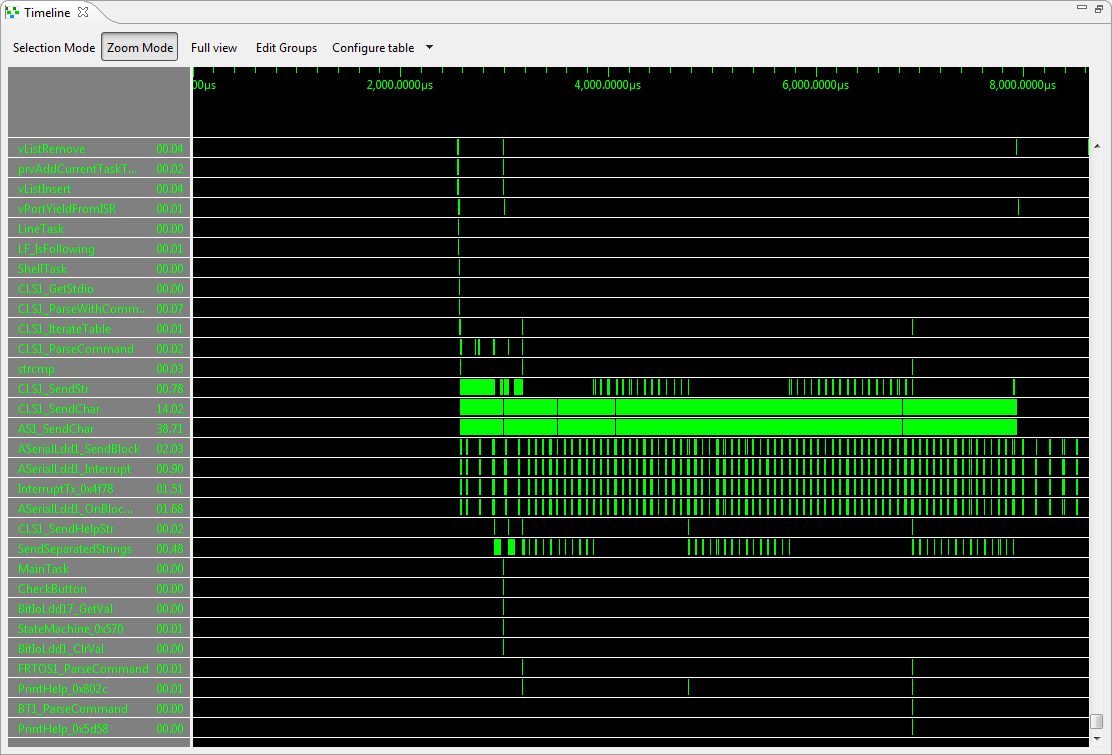
Timeline
Critical Code
Critical Code gives me the information how much of my function code is executed. That’s especially useful for Code Coverage:
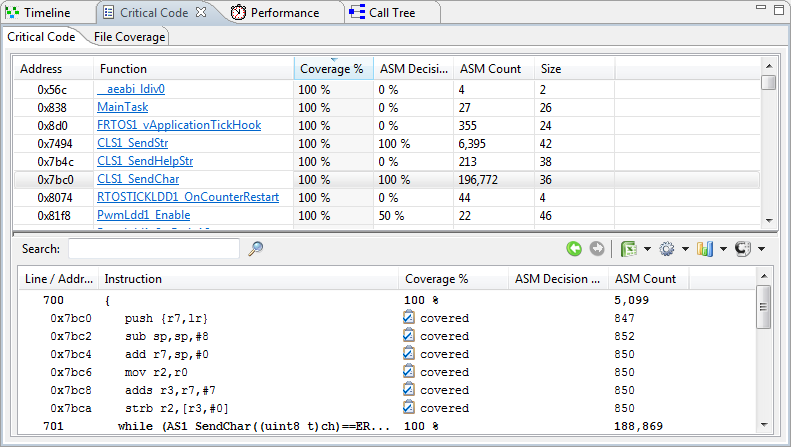
Critical Code
Performance
The Performance view shows me how many times functions get called:
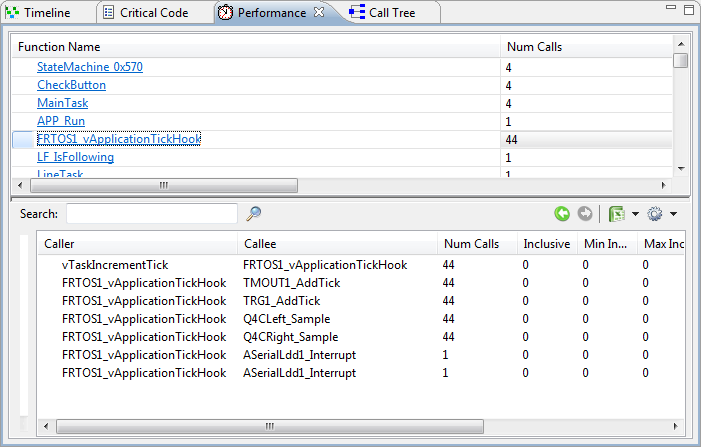
Performance
Call Tree
The Call Tree gives me hierarchical information:

Call Tree View
Start and Stop Trace Point
As a lot of data created, it makes sense to focus around the area where I believe the problem is. Using the context menu on the source I can set a ‘starting trace point’:

Start Trace Point
This creates me a starting marker:
Start Tracepoint Marker
The same way I can add a ‘end’ marker:

End Tracepoint Marker
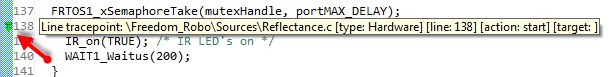
With this reduced to the focus point, I can collect the important information and find my problem: I’m using a blocking wait call which is not not needed here:
Blocking Wait
Now the application runs as expected :-).
Trace Pins
While that solved my problem, there is still one thing: in my above setup, I was not using any dedicated trace pins. Technically, that on-chip trace buffer can be used with the OSJTAG connection as well. But it is so slow that it is not really useful at all. What helped me was the extra speed of the Tracelink JTAG connection to get the trace to the host. The K60 (Kinetis-K) on the other side has added Trace Pins which are used by the Tracelink probe. See this link for more details.
Trace from Kinetis-K
The FRDM-KL25Z Freedom board has an ARM Cortex-M0+ on it, and it only supports a reduced pin SWO debug connection with a 10 pin (mini) cable (Cortex Debug Connector).
The Kinetis-K family (ARM Cortex M4) supports ETM (Embedded Trace Macrocell) trace with a 20 pin debug cable (Cortex Debug+ETM Connector):

TWR-K60F120M with 20 pin JTAG Debug Cable
5 pins on that cable are dedicated for ETM trace: one trace clock (TRACECLK) and 4 trace data (TRACED) pins. Other than the ‘normal’ P&E Universal Multilink, the Tracelink is using the trace pins.
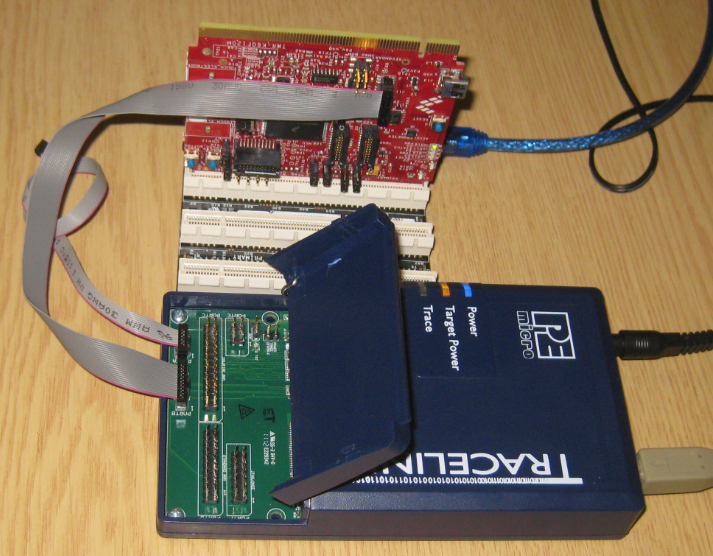
Tracelink connected to TWR-K60F120M Board
❗ The Tower boards need to be powered through the TWR-ELEV (Elevator) board to use the JTAG connector. Using the OSBDM USB connector to power the board while debugging it with the JTAG connector at least for my boards was not possible. I would love to see the circuit on the Tower boards changed so I do not need the Elevator board on order to do JTAG debugging.
If using Trace/Profiling with the Kinetis-K family, the debugger offers more settings:
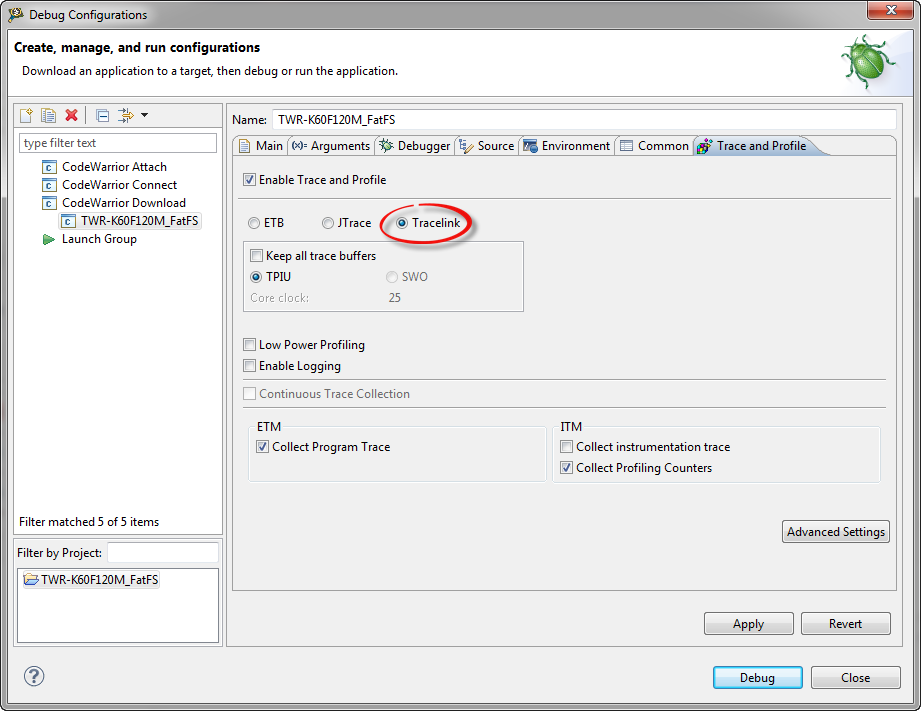
Tracelink Settings for Kinetis
It allows me to collect ETM (program) trace, plus ITM (instrumentation) trace for profiling. The ‘Advanced Settings’ button gives me more control over the trace settings:
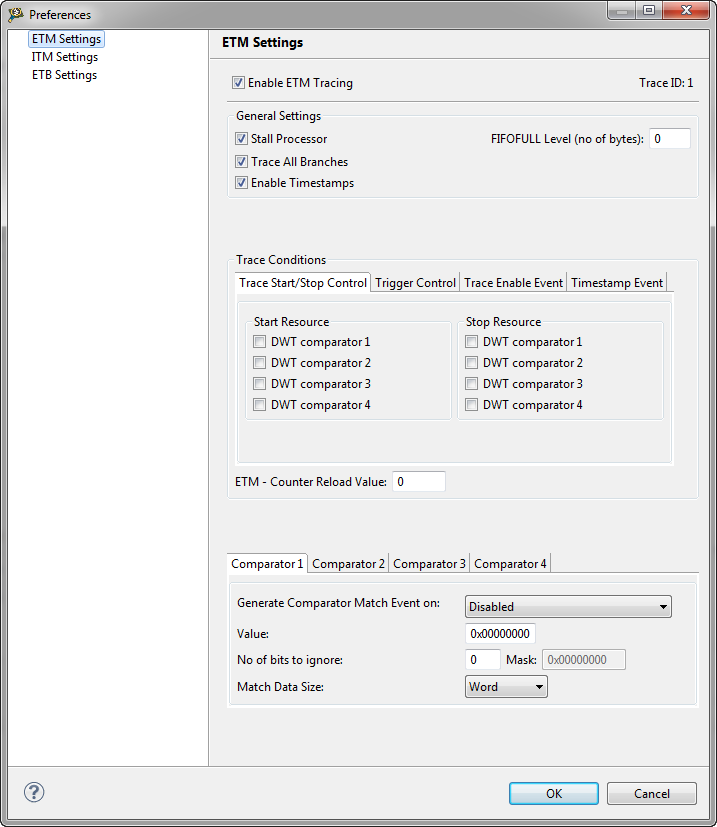
ETM Trace Settings

ITM Trace Settings
I’m using for now the default values, as otherwise I think I need to spend some more time to read all the ARM documentation on ETM and ITM.
Dealing with the settings details might not be needed at all: as for the Kinetis-L (Freedom board), the debugger collected the trace in the same way. But the difference is now: the trace unit can collect the trace without halting processor: this makes it better suited to trace realtime applications without interfering with the application. Using an on-chip RAM buffer as for the Freedom board definitely slows down the application.
Trace Configuration and Data
In case troublshooting the trace data and configuration is needed, it is useful to know where the configuration files and data are stored:
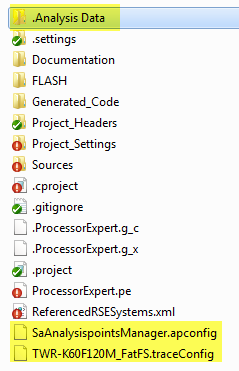
Trace Configuration and Data Files
The .Analysis Data folder has a copy of the application file and all the trace data files collected. The *.apconfig and *.traceConfig are the trace configuration and settings files. While playing with the trace settings, it happened to me that I screwed up the settings as such that trace was not collected any more. Deleting the above folder and files was the rescue 🙂
💡 It is a good idea to ignore the three above files/folders if working with a version control system, see this post.
Trace Collection Trouble Shooting
The other thing I noted was that somehow trace collection was not always performed. The following steps outline the trick I used:
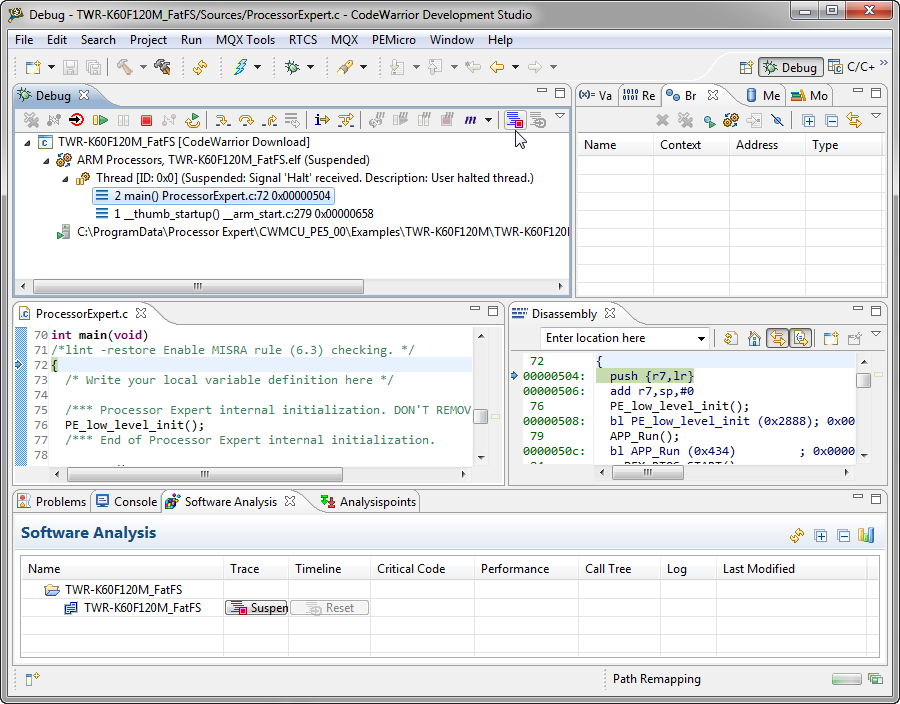
The following screenshot shows the debugger after downloading the application and the program has run until main():

Eclipse after downloading
Note that the Software Analysis view does not show any trace yet. Note the ‘Start/Stop Trace’ button which is red (pressing it would stop trace).
❗ The icon for the start/stop trace button is confusing, as it is showing both a ‘status’ and an ‘action’ in one button. It would be better if there would be two buttons: one for start trace and one to stop trace.
The red button would mean that I can stop trace. But as I can see on the button, trace has not been collected/started yet. If I press the button, it shows this:

Stopped Trace
Now I have buttons populated in the Software Analysis view, but there is still no trace available yet (as I was not stepping), as the ‘Reset’ button is grayed out.
Now I press the button again, and it changes from ‘green’ (trace is not collected, I can start it), to ‘red’ (trace gets collected, I can stop it):
Trace enabled
Now my trace collection is really enabled. So if I do now a ‘step over’, it collects the trace:

Trace collected after step over
Now I have the trace, I can expand the line in the Software Analysis view and open the information. It took me a while to find this out ;-).
I hope this could be fixed in an update/next release. That ‘dual-icon’ is for sure counterintuitive, plus it does not show the proper state at the beginning. In essence for my case above it has not collected trace from the reset vector on, which makes sense in some cases. The good news is that I can collect trace through the startup code, and for this I need to disable in the debugger to run to the main() routine, and do the above trick right after reset.
Summary
Beside of the trace collection functionality, I love the remote TCP/IP connectivity: I can now debug my solar system controller down in the cellar without moving my notebook there :-).
While MTB trace is available even without an external trace collection unit, the P&E Tracelink with CodeWarrior is more economical solution for me. Because it allows me to collect more trace in a shorter time, and gives me the ability to inspect big amount of trace data. Even if such trace units come with an additional cost, having one available can enable me to find a problem quickly, and ultimately make the difference between failure and success.
Such a trace unit makes definitely sense for debugging a microcontroller JTAG connection having that extra trace pins available (as for the Cortex M4/Kinetis K family). For the Kinetis-L as on the FRDM-KL25Z board it is still a plus to have higher debug/flash programming speed and trace collection, but here a Universal Multilink would do it as well. Except that the universal multilink would not give me TCP/IP based debugging.
So having at least one such trace unit in an engineering team makes sense to me. But then the problem could be that everyone in the team wants to have one ;-).
Happy Traceing 🙂

Hey Erich, nice post! Please, could you provide a link to an appropriate cable to buy separately to interface the P&E to the FRDM board for those of us that don’t “[have] such a 10 pin cable already at hand” :-)?
LikeLike
Hi Victor,
I have a Farnell order number for such a Cortex 10 pin debug cable listed here: https://mcuoneclipse.com/2012/10/23/completing-the-frdm-kl25z-board/
LikeLike
That looks like a very important and useful tool. But at $1,000 it is on a wish list until I can get a project that provides the funds.
Would you consider showing the TAD tools and how to get similar data from these tools? Or are there any other open source or paid for tools that you can recommend?
Thanks for another excellent information help.
Robert
LikeLike
I’m using FreeRTOS+Trace (https://mcuoneclipse.com/2012/03/23/tracing-with-freertostrace-from-percepio/) as well. But all these RAM buffer based ones are limited (to that RAM buffer). You will need such a piece of hardware to get it really workign for a longer trace and to overcome that RAM limit.
LikeLike
Hi,
What about the continuous mode ?
If you don’t care too much about the real time execution of the application and you don’t want to buy an expensive probe, you can use the continuous mode. For both K and L families.
It works by reading the on-board RAM trace buffer every time it fills, then resuming program execution.
LikeLike
Hi Ionut,
yes, the continuous mode is a good thing as long the run control device is fast enough. In my experience at least with OSBDM/OSJTAG is not not really usable. But it works well with the Multilink. But as you say: it impacts runtime performance. Unfortunately for many real applications this is something which prevents usage of the continous mode. I would say a 2-5% impact on the application is acceptable in many applications. But if it goes beyond that, then I think something else is needed.
LikeLike
I was thinking about making some custom boards around MKL05Z32. If I remove the chip (or get the signals) from the FRDM-KL05 or FRDM-KL25, will I be able to program my custom board? I don’t really have the money for a dedicated programmer.
Thanks
LikeLike
Hi Andrei,
maybe have a look here:
the thing is: I have not tried to use the FRDM-KL05 to prrogram another board. Given my experience, this will not be possible, as the OpenSDA is tight to the processor ID used on the board. I have been told that you should be able to program another board using the MSD bootloader (drag&drop) a file, but programming performance will degrade after you have programmed some number of devices. So if you are really serious about programming, then I think you need to invest somewhat below $100 to get a ‘real’ programming device.
LikeLike
Thanks for the fast response. I only need to do 3 chips. I would’ve gone with AVRs (I already have the tools) but this micro is way faster, cheaper and smaller. I guess I should get rid of the AVR tools and invest in some ARM tools.
LikeLike
I really like your blog. You write about very interesting things. Thanks for all your tips and information.
LikeLike
Hi Erich,
It’s not completely clear on their website, but is the Tracelink a full-featured programmer and debugger like the Multilink for example? I just want to be 100% sure before ordering.
Alex
LikeLike
Hi Alex,
yes, you can use it like a multilink.
Erich
LikeLike
Pingback: Poor Man’s Trace: Free-of-Charge Function Entry/Exit Trace with GNU Tools | MCU on Eclipse
Pingback: Debugging ARM Cores with IP based Debug Probes and Eclipse | MCU on Eclipse
Hello Erich,
I am interested in doing trace work with NXP Kinetis processors. I was looking into this PE Micro Tracelink box. I am using KDS as the IDE/compiler and looking into moving to MCU Espresso. I have heard that these tools do not support doing live traces with tools like this. Can I do live traces with this software? If not what can I use to get live traces on Kinetis?
LikeLike
To my knowledge there is no direct support for that trace unit. What works pretty good (and you don’t need any dedicated trace hardware) is using SWO trace, e.g https://mcuoneclipse.com/2018/08/12/tutorial-catching-rogue-memory-accesses-with-arm-watchpoint-comparators-and-instruction-trace/. The latest MCUXpresso IDE V11. What you need is a debug probe supporting the SWO pin. The latest P&E Multilink Universal (FX?) do support this.
LikeLike