
Recently I have been asked “How can I debug a Linux application with VS Code?”. I’m covering that topic in my ‘Embedded Application Development Course on Linux”.
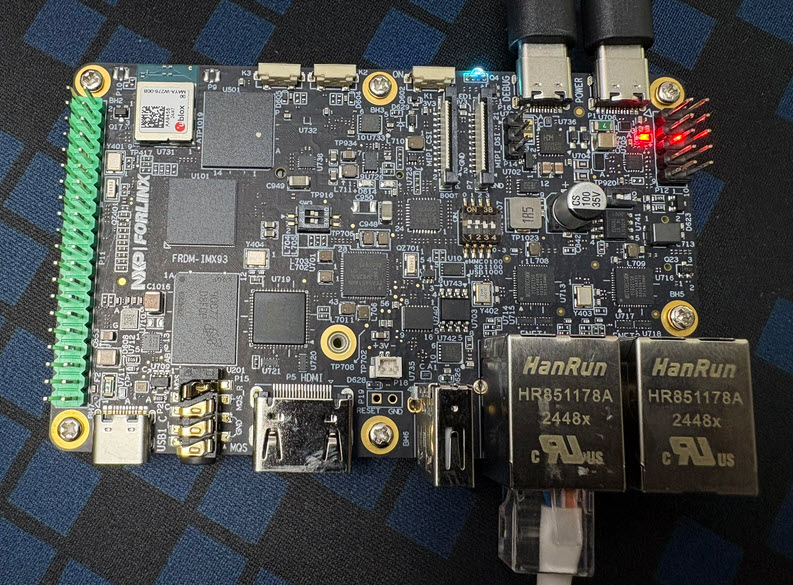
I realized, that I have never covered that topic in any of my blog articles. So here we go: I show how easy it is to use VS Code to debug a Linux application. You can use this for example with an Raspberry Pi. Or for example the NXP i.MX93 which I’m using in this article.
Outline
In this tutorial, I show how one can easily debug a user application running on a Linux embedded system. For this, I’m using an SSH connection to the remote machine.
Microsoft already has baked in great SSH tunneling support into VS Code. And this is what we are going to use;
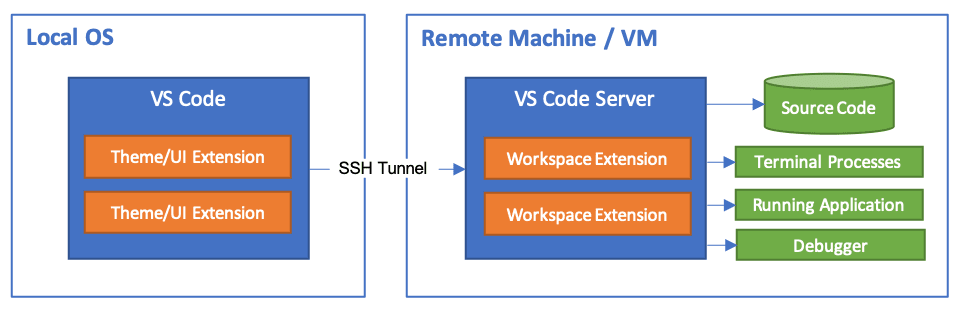
The technology is using an SSH tunnel with a VS Code server running on the target system. This makes remote development and debugging seamless.
In this article, I go through a basic example, describe how to configure and use VS code. Finally I’m debugging a remote Linux user-space application with VS Code over an SSH connection.
Preconditions
You will need:
- VS Code installed on the host (https://code.visualstudio.com/)
- ‘Remote Development‘ extension pack from Microsoft installed in VS Code
- An embedded Linux system with toolchain installed. For example the NXP i.MX93 or a Raspberry Pi.
Hello World
Next, let’s create a simply hello world on the i.MX93
Create a directory:
$ mkdir hello
Change into that directory:
$ cd hello
Create a simple ‘hello world’ source file:
$ nano main.c
Then add following source code:
#include <stdio.h>

int main(void) {
  printf("hello world!\n");
  return 0;
}
Exit nano editor with CTRL+X.
Compile the file:
$ gcc main.c
Then run the program:
$ ./a.out
which should print
on the console:
hello world!
Congratulations! We have a hello world running on our board.
VS Code
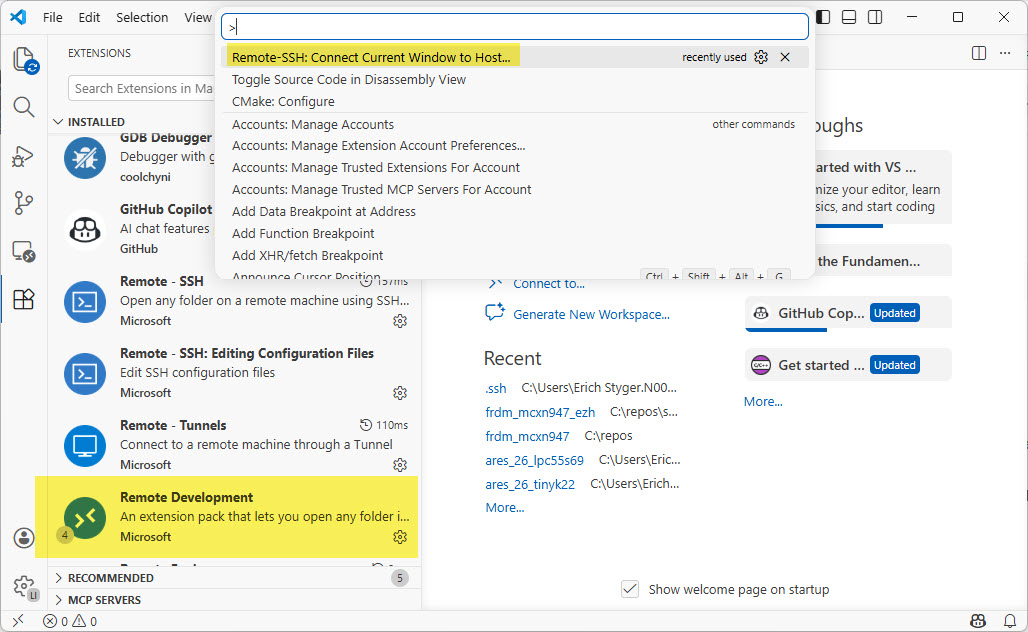
In VS Code, make sure you have the ‘Remote Development‘ extension pack installed.
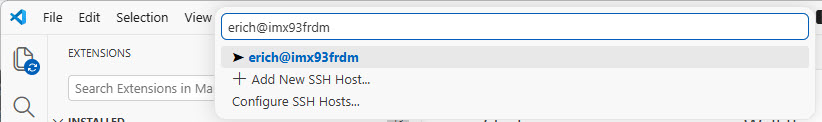
Press CTRL+SHIFT+P and choose Remote SSH: Connect Current Window to Host …
Next, you are asked to specify to which host to connect. Use the following format as you would use for a normal SSH connection:
<user>@<host>
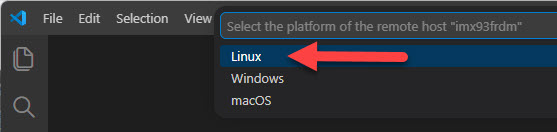
Next, select the host type we want to connect to (Linux):
Enter your login password if asked for.
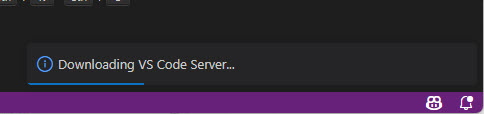
Then it will install the server part of VS Code on the linux side. This can take a few minutes.
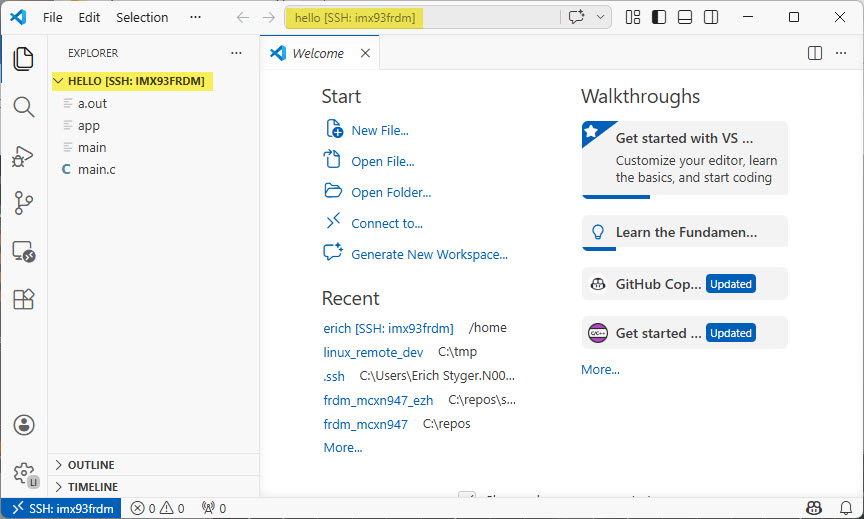
Finally, the left status bar message shows that we are connected.
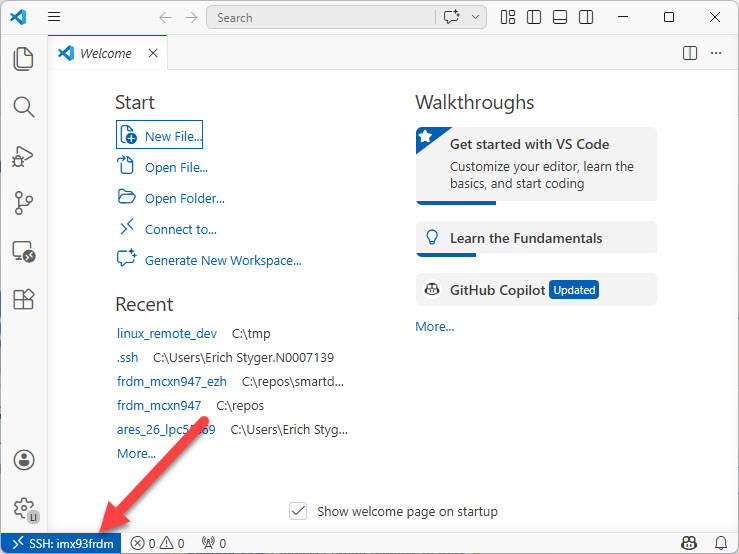
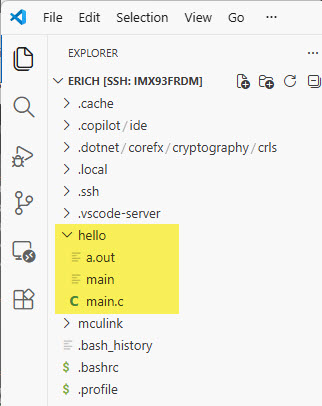
With the SSH connection, I can open and browse folders on the remote machine.
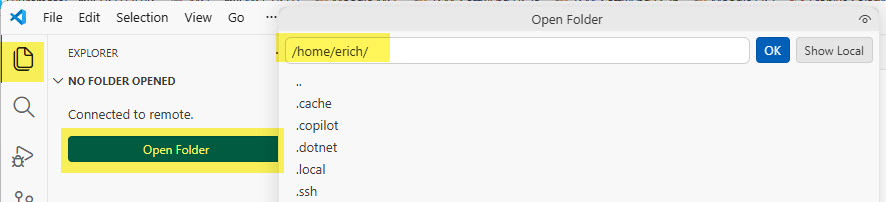
Open Project Directory
As on the host, can open the project folder (‘hello’ directory in my case) using File -> Open Folder:
Building with debug information
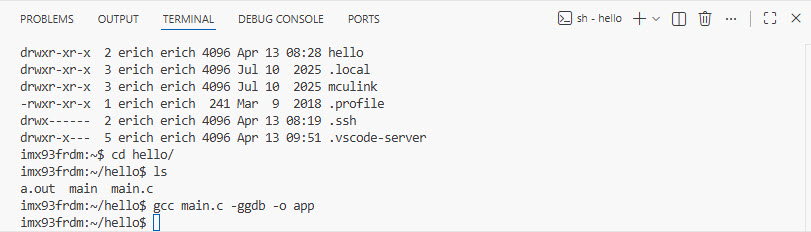
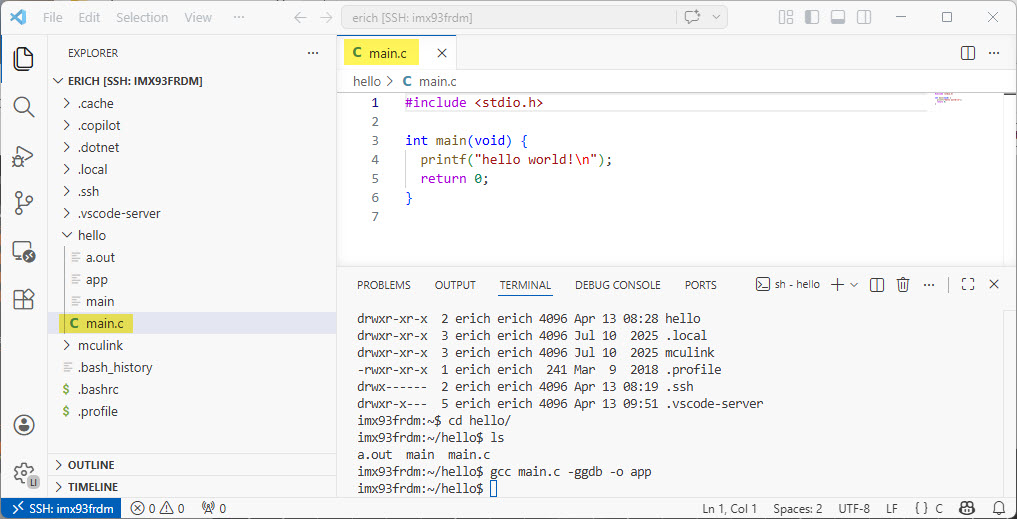
In order to debug the binary on the target, I’m using the -ggdb option to include the debug information:
$ gcc main.c -ggdb -o app
I can use the VS Code Terminal view for this:
Debugging
Open the source file in the editor:
The reason to open that file is that the extension automatically can detect the programming language and extensions needed.
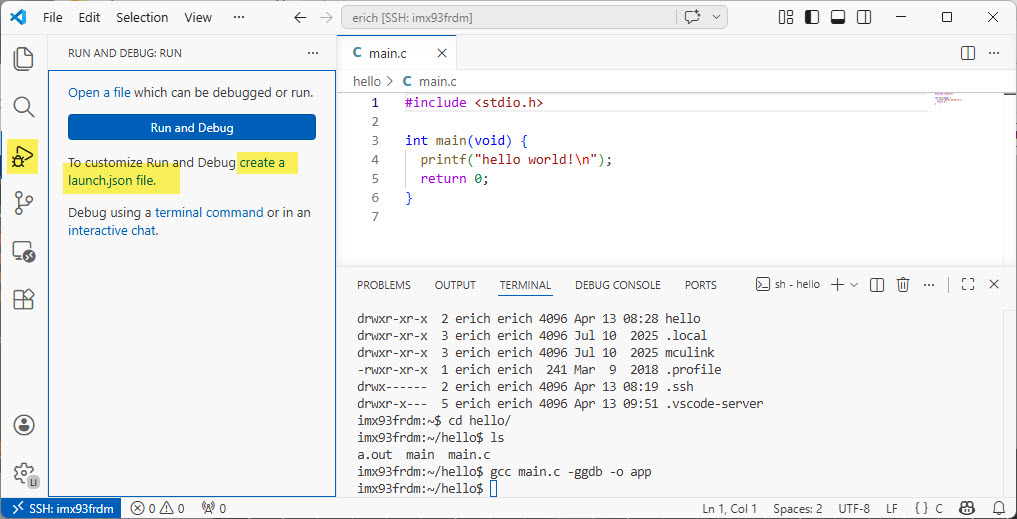
In the debug pane, create a launch.json file:
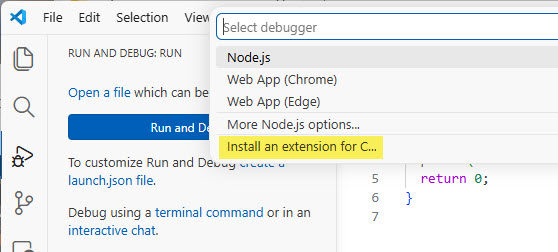
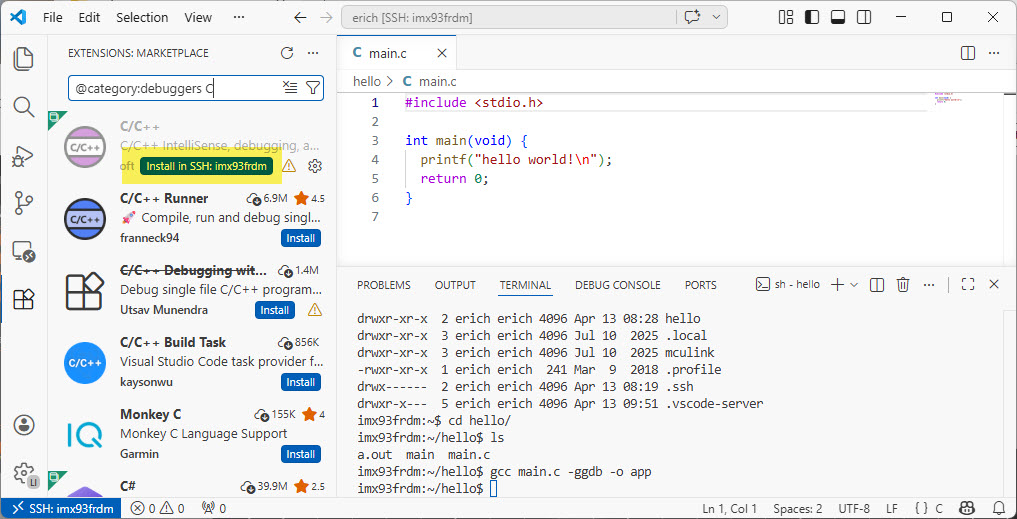
We want to use GDB for debugging. If not already installed: Install the C/C++ extension:
If asked, select a C/C++ (gdb) Launch configuration:
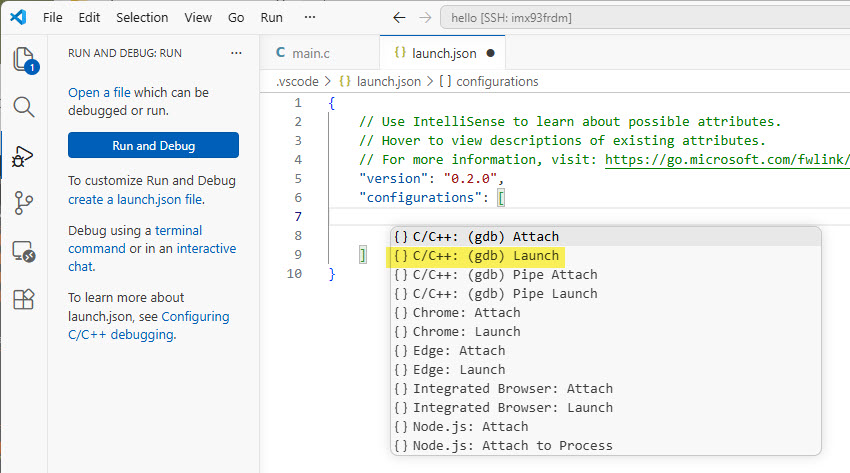
This creates the following launch configuration:
{
    // Use IntelliSense to learn about possible attributes.
    // Hover to view descriptions of existing attributes.
    // For more information, visit: https://go.microsoft.com/fwlink/?linkid=830387
    "version": "0.2.0",
    "configurations": [
        {
            "name": "(gdb) Launch",
            "type": "cppdbg",
            "request": "launch",
            "program": "enter program name, for example ${workspaceFolder}/a.out",
            "args": [],
            "stopAtEntry": false,
            "cwd": "${fileDirname}",
            "environment": [],
            "externalConsole": false,
            "MIMode": "gdb",
            "setupCommands": [
                {
                    "description": "Enable pretty-printing for gdb",
                    "text": "-enable-pretty-printing",
                    "ignoreFailures": true
                },
                {
                    "description": "Set Disassembly Flavor to Intel",
                    "text": "-gdb-set disassembly-flavor intel",
                    "ignoreFailures": true
                }
            ]
        }


    ]
}
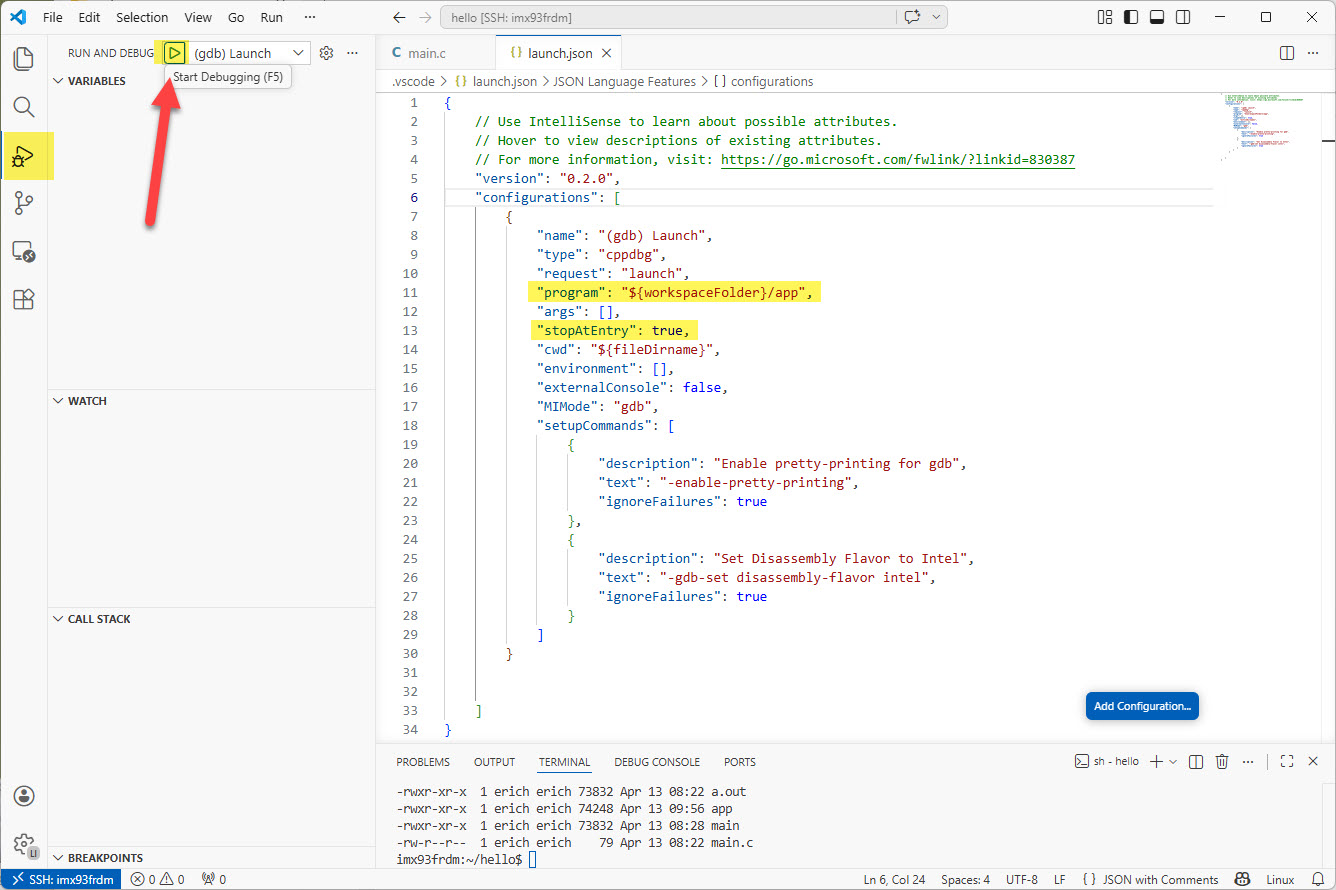
Update launch.json
We have to update it in two places:
"program": "${workspaceFolder}/app",
and
"stopAtEntry": true,
Then save the file.
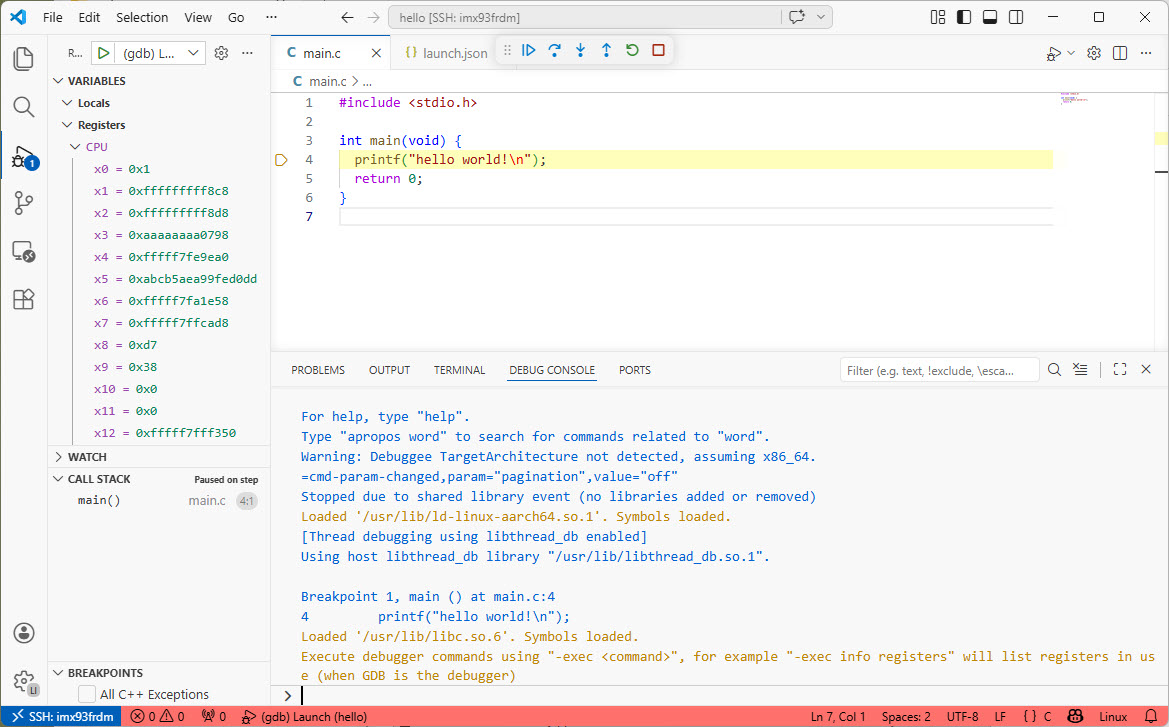
Start Debugging
Now we can press ‘debug’:
Congratulations!
Summary
Debugging Linux user-space application over SSH is very easy. Thanks to the built-in remote SSH support in VS Code. I have used a similar setup with Eclipse. I have to admit that with VS Code it is way easier and more seamless. Of course I’m using a ‘raw’ command line GDB client-server connection from time to time too. But for debugging a GUI based approach is much more efficient for me. And here is where a GUI like VS Code really makes sense.
How are you debugging your Linux user space applications? Are you using VS Code as well? Let me know in the comments section.
Happy applicationing 🙂
