Sometimes, all what I have is a ELF/Dwarf binary, and I need to debug it. I don’t want to build it, only debug it. The NXP VS Code extension makes that possible. I simply import the binary and start debugging.

Outline
This article describes how to import an embedded ELF/Dwarf (.elf or .axf) file without project for debugging. ELF/Dwarf files are the standard binaries for targets and cross development. They include the code. They also contain debug information if it has not been stripped.
For this, I use the ‘Import’ on an executable in VS Code. After that, I can debug it right away.
Prerequisites
Install the NXP extension into VS Code (extension identifier nxpsemiconductors.mcuxpresso or https://marketplace.visualstudio.com/items?itemName=NXPSemiconductors.mcuxpresso)
Import
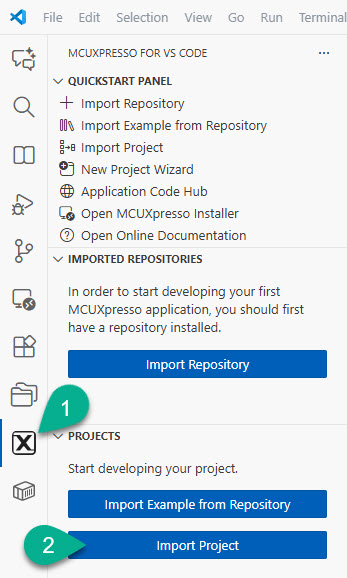
Click on the NXP extension icon in the side bar and use ‘Import Project‘:
Executable
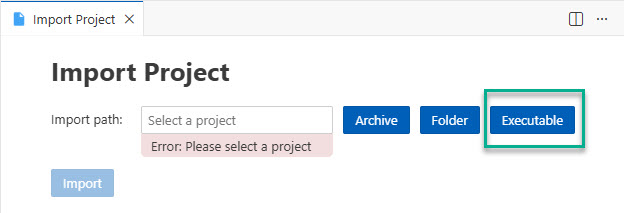
Then select ‘Executable‘:
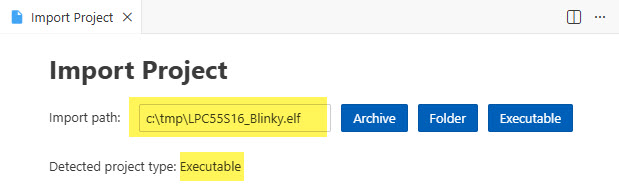
Then browse to the ELF/Dwarf file you want to debug: In my case it is
c:\tmp\LPC55S16_blinky.elf
and it is detected as ‘executable’:
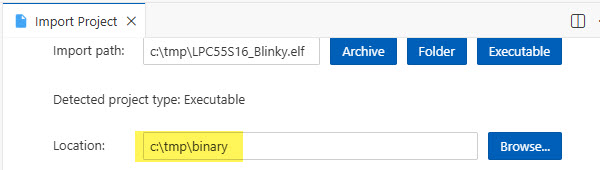
Next, I can specify a folder where VS Code can store the settings. I’m using the
c:\tmp\binary
location:
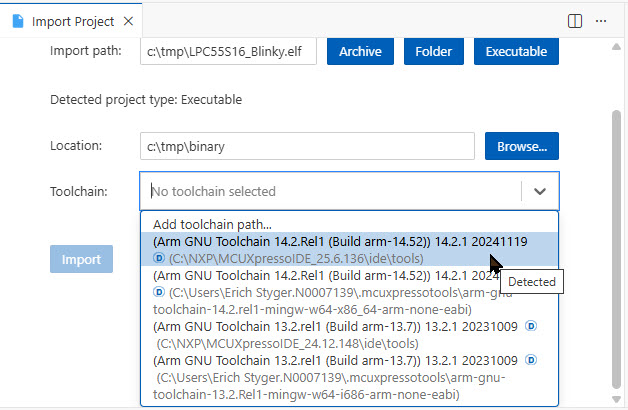
Toolchain
Next I specify the toolchain which includes the GDB for debugging:
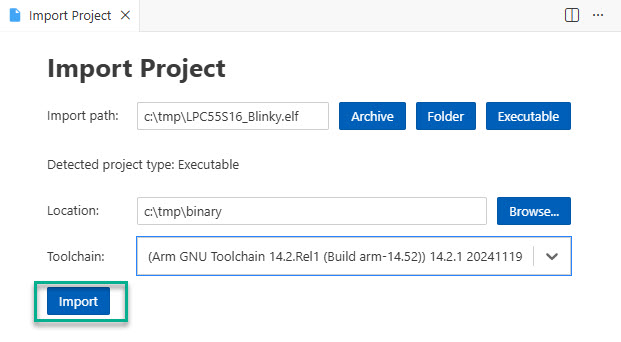
Finally, press ‘Import’:
Debug
This creates an entry for the executable in the side view with a ‘debug/run’ icon I can use:
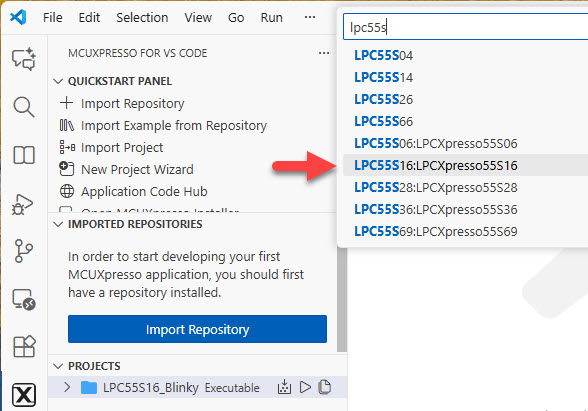
MCU Selection
Using the executable the first time, I get asked about what MCU I want to use:
After this: I’m debugging that executable:
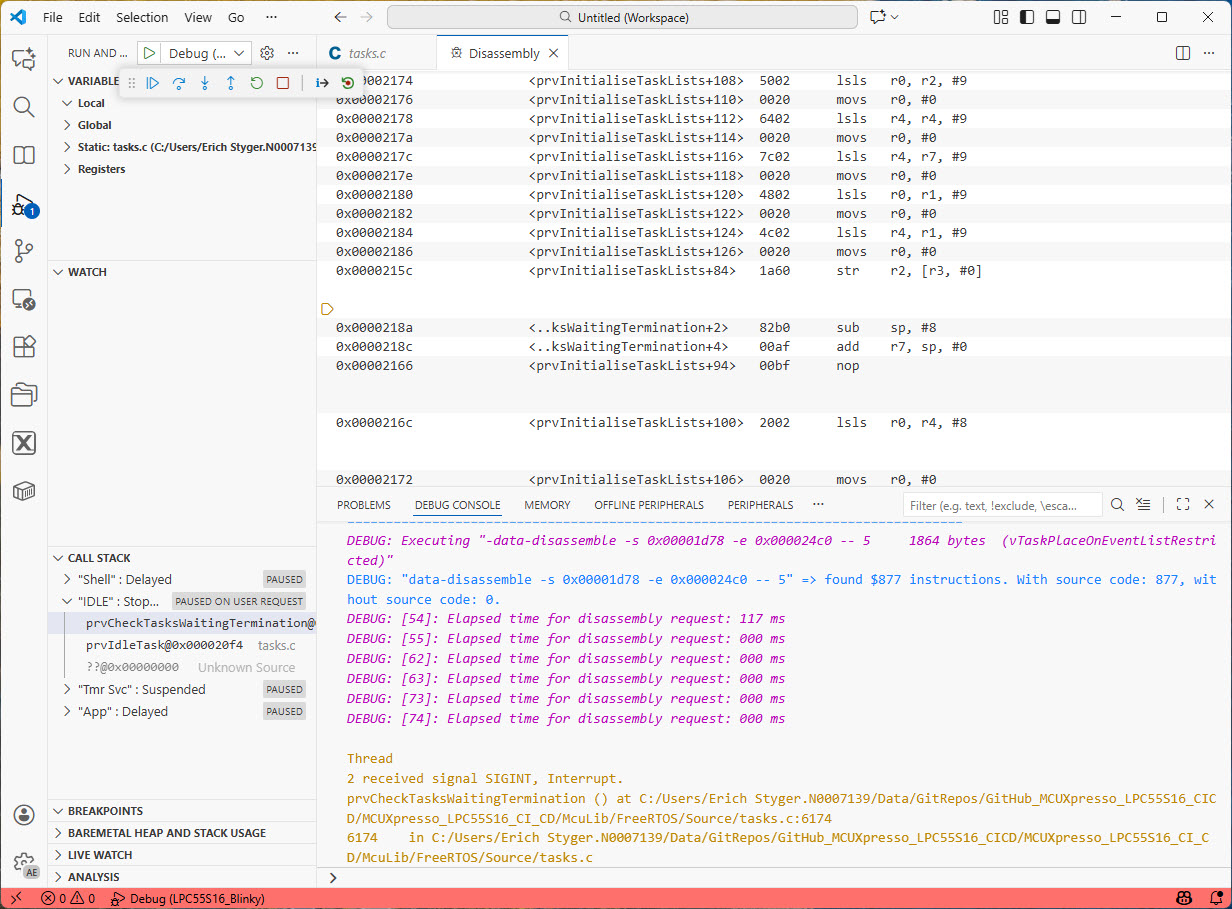
Assembly Level Debugging
Based on the debug information, VS code is using the source file information present in the ELF/Dwarf file. Ideally, I have the source files available. If not, I still can debug it on assembly level instruction level:
Summary
Using VS Code with the NXP MCUXpresso Extension, it is surprisingly easy to debug the binary. There’s no need to import or build project. All I need to do is point to the executable. Then, I select the toolchain for the GDB and device I want to use. This is very useful for a quick check of a binary on an embedded target board. All I need is the binary with VS Code. Then, I can start debugging it. If I have the sources available, I even can do source-level-debugging. Or I can debug on assembly instruction level.
Happy debugging 🙂
Links
- NXP VS Code MCUXpresso Extension: https://marketplace.visualstudio.com/items?itemName=NXPSemiconductors.mcuxpresso
- Dwarf files: https://en.wikipedia.org/wiki/DWARF
- Elf files: https://en.wikipedia.org/wiki/Executable_and_Linkable_Format

To get to your “Debugging Executable” with the C source listing you still need the C source for the project, right? You just don’t have to build it to start debugging? And you’re saying even if you don’t have the original C source you can still debug on the assembly level? Or are you saying you can embed the C source code inside the debug executable itself? Sorry for my little bit of confusion, but this is very interesting to me.
LikeLike
Yes, for source level debugging you need one or more source files. The reason is that the ELF/Dwarf file does not contain the sources, but references them. So you would have to have them somewhere on your machine. So the source code itself is not baked into the executable, it is outside.
I hope this makes it clear.
LikeLike
Very clear. Thank you.
LikeLike
Hello Erich,
It works also when the *.elf file is not part of other project ? (and/or compiled outside of MCUXpresso infrastructure ?)
Thanks!
LikeLike
Hi Andrei,
yes. Any .elf file works. No dependency on any tool chains. The only dependency would be that the GDB used for debugging needs to be compatible with the ELF/Dwarf file used. But this is usually the case, unless you have a really weird tool chain.
LikeLike
This only works if the elf file contains debug info, not all elf files contain this, maybe this is obvious, but was not explicitly stated, without debug info, you don’t get source level debugging, you only see assembly and branch to address, you don’t get function or variable names, call stack decoding and anything directly related to source code.
LikeLike
Yes, that’s correct. Having the debug information included is the norm in the embedded (MCU) space, as it is not the ELF file which is loaded on the target, but only the code/data of it.
LikeLike