
The new flagship of FRDM boards is the FRDM-K64F board. After FTF I have explored different ways debugging the board, and received many comments and questions about it (thanks!). Freescale announced the supports with the new Eclipse based Kinetis Design Studio (KDS). But until KDS is out, how can I use the FRDM-K64F board with CodeWarrior?

Debugging FRDM-K64F Board with CodeWarrior for MCU v10.6
Setup CodeWarrior for MCU v10.6
If you are using CodeWarrior for MCU10.5, there is a service pack for K64F available on the Freescale web site. I have it installed in my 10.5, and while this works, I rather recommend to download and install the latest MCU10.6 instead: It is available for download from http://www.freescale.com/cwmcu10.
Create New Project for FRDM-K64F
With File > New > Bareboard Project, create a new project for the K64F microcontroller on the board:
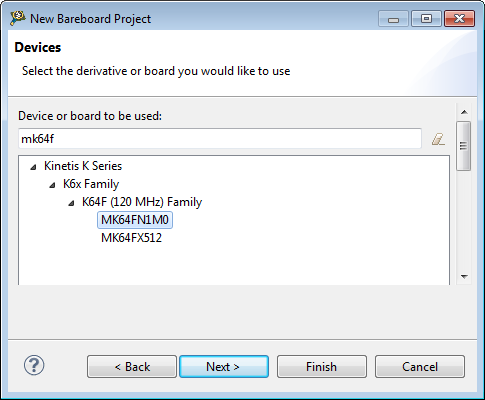
New MK64FN1M0 Project
As connection select either P&E Multilink or Segger J-Link, or both:
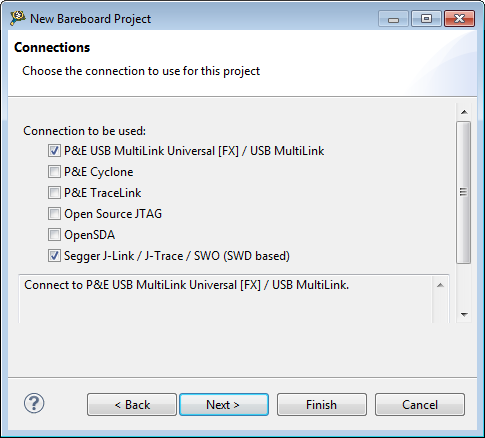
PnE Multilink and Segger Connections
❗ The FRDM-K64F does *not* have the (P&E) OpenSDA bootloader on it. Freescale changed the bootloader from the existing OpenSDA (I started naming it as OpenSDAv1) to a new (mbed bootloader based) OpenSDAv2. Existing *.SDA (e.g. P&E OpenSDAv1, Segger OpenSDAv1 or CMSIS-DAP OpenSDAv1) applications *cannot* be used with OpenSDAv2: instead of an .SDA file they need different firmware with .BIN extension.
SWD or JTAG?
There are two different ways to debug an ARM core: either with JTAG (Joint Test Access Group) or SWD(Single Wire Debug).
My cheat sheet if SWD or JTAG is used:
SWD:
- SWD uses two pins (clock (SWDCLK) and bidirectional data (SWDIO))
- On SWD, optionally there is SWO (Serial Wire Viewer)
With this, on the 10 pin connector beside GND and Reset the SWDIO and SWDCLK are needed (see http://infocenter.arm.com/help/topic/com.arm.doc.faqs/attached/13634/cortex_debug_connectors.pdf):
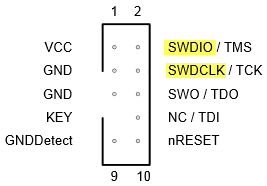
SWD/JTAG 10pin Connector with minimal SWD signals (Source: ARM.com)
In JTAG mode, TMS, TCK, TDO and TDI (beside GND and Reset) are needed:
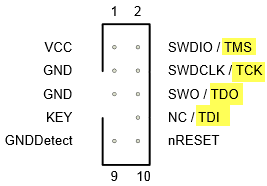
JTAG 10pin Connector
The 20pin connector has the same pin layout in the lower half, and the upper half has extra ETM trace pins:

20pin SWD JTAG Connector with extra trace pins (Source: ARM.com)
Therefore, a debug cable with 20 pins can be put on a 10pin header (lower half) if no 10 pin cable is available. Most SWD/JTAG debug probes today offer both 10 pin and 20 pin cables:

P&E Universal Multilink with SWD and JTAG Ports

Segger J-Link SWD and JTAG Adapters
I was wrong for a long time when I thought if a 20pin cable means JTAG, and a 10pin cable means SWD :-(. Instead, I need to check the schemata. For example the K20 on the FRDM-K64F is using JTAG:
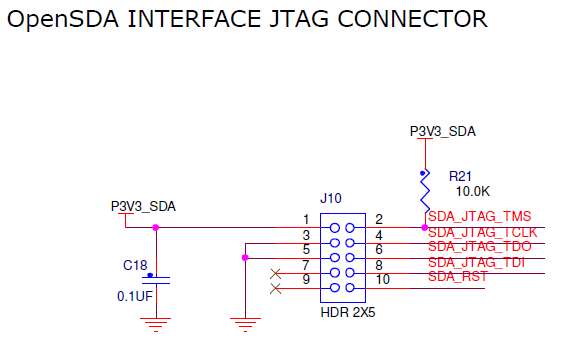
OpenSDA JTAG Connector (Source: FRDM-K64F Schematics)
But the K64F on the FRDM-K64F has SWD:
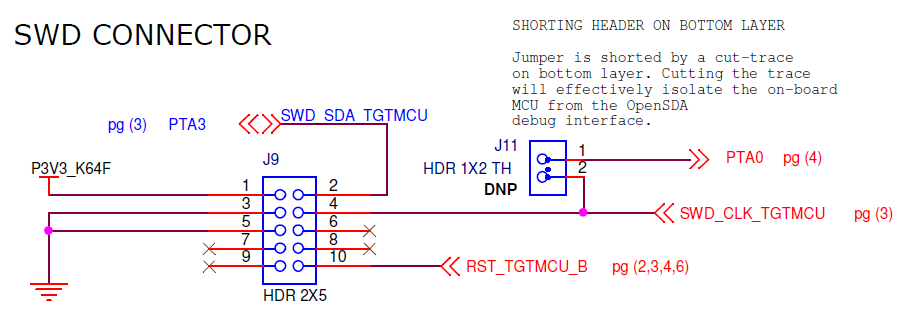
FRDM-K64F K64F SWD Connector
The K64F microcessor *could* use JTAG, but on the board only the SWD pins are routed to the connector.
💡 Not sure why Freescale decided only to route the SWD pins to the connector. Probably so the other pins could be used as normal pins.
FRDM-K64F Debug Connectors
The FRDM-K64F has three debug connections:
- USB OpenSDAv2 through the onboard Kinetis K20
- 10pin SWD connector for the Kinetis K20
- 10pin SWD connector for the Kinetis K64F

FRDM-K64F Debug Ports
CodeWarrior does *not* support OpenSDAv2, so I have to use option 3: Using an external debug probe like a P&E Multilink or Segger J-Link.
❗ Pay attention to use the connector to the K64F (not the one to the K20!), and make sure that the cable is oriented to pin 1 (the board silkscreen is so small that it is hard to read where is pin 1). Use above picture as orientation.
P&E Multilink Connection
Connect the P&E Multilink SWD cable to the K64F SWD connector as shown below:

Connection to FRDM-K64F with P&E Universal Multilink
💡 In above picture I’m using the OpenSDA USB debug port to power the board. Which power USB port I can use depends on the debug firmware loaded on the K20. My experiments show that above picture does *not* work if the mbed firmware is loaded on the OpenSDA, because the mbed firmware is affecting the debug connection pins to the K64F. If using the Segger J-Link firmware, then this firmware does it correctly and tristates the connections to the K64F if no active debug session is running.
Then I can debug the FRDM-K64F 🙂
Segger J-Link Connection
The Segger J-Link connects to the target like this:

Connection to FRDM-K64F with Segger J-Link
Then I can debug the board with the Segger J-Link.
Trouble Shooting
SWD or JTAG?
If I get an error like this:
Failed to resume target process.
ARM GDI Protocol Adapter : An error occurred while trying to write memory. The Debugger can not write memory.
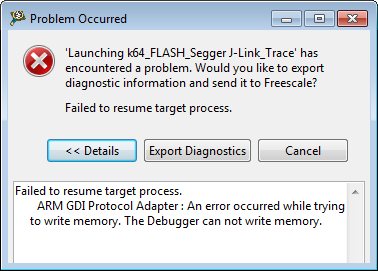
Error launching Segger J-Link Connection
Then it means that the SWD/JTAG selection probably is wrong. I need to verify/change the settings in the debug configuration. Use the menu Run > Run Configurations and select the run/debug configuration. There I use the ‘Edit…’ button:
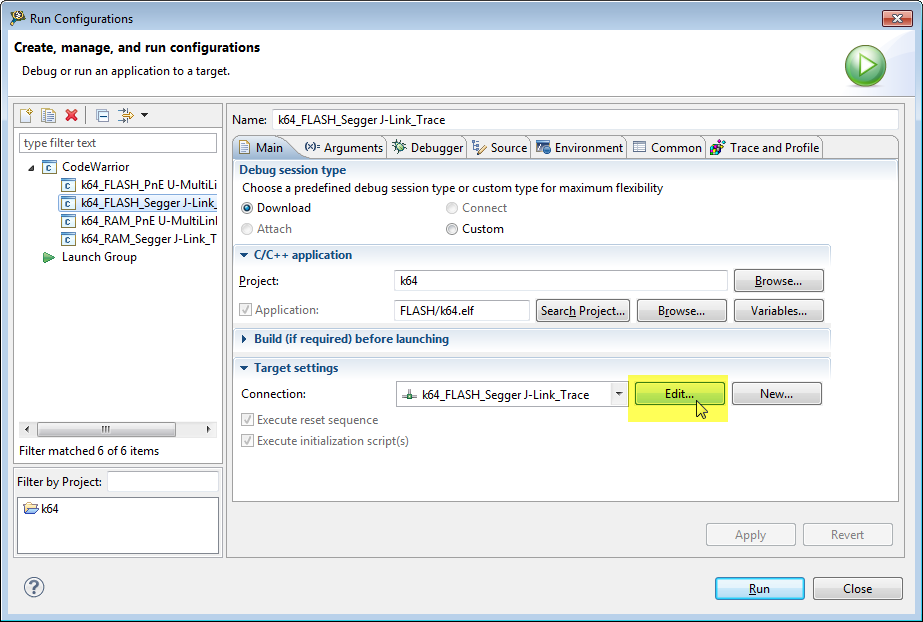
Edit the Target Settings
For the J-Link, the setting is in the ‘Debug port interface’ setting:
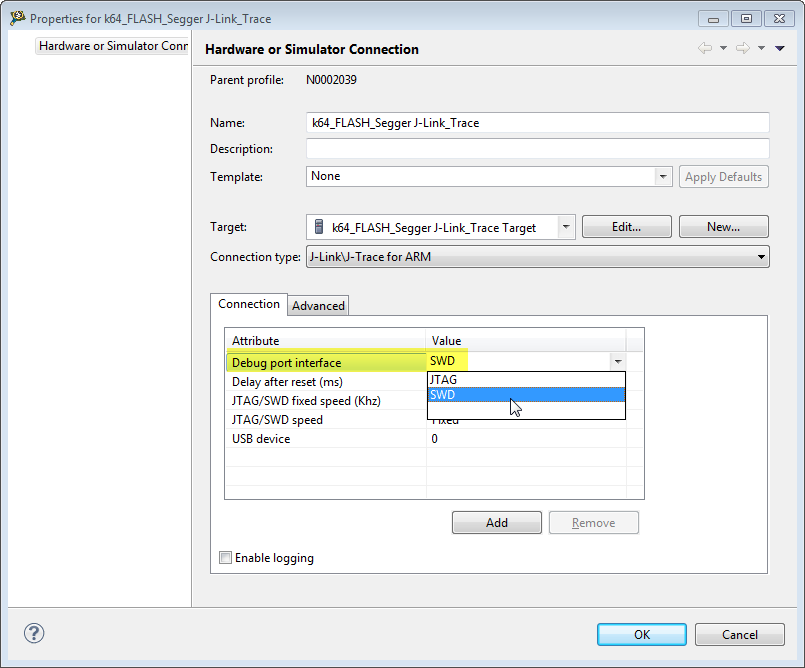
Segger J-Link configured for SWD
For the P&E Universal Mutilink the setting is in ‘Use SWD reduced pin protocol for communication’:
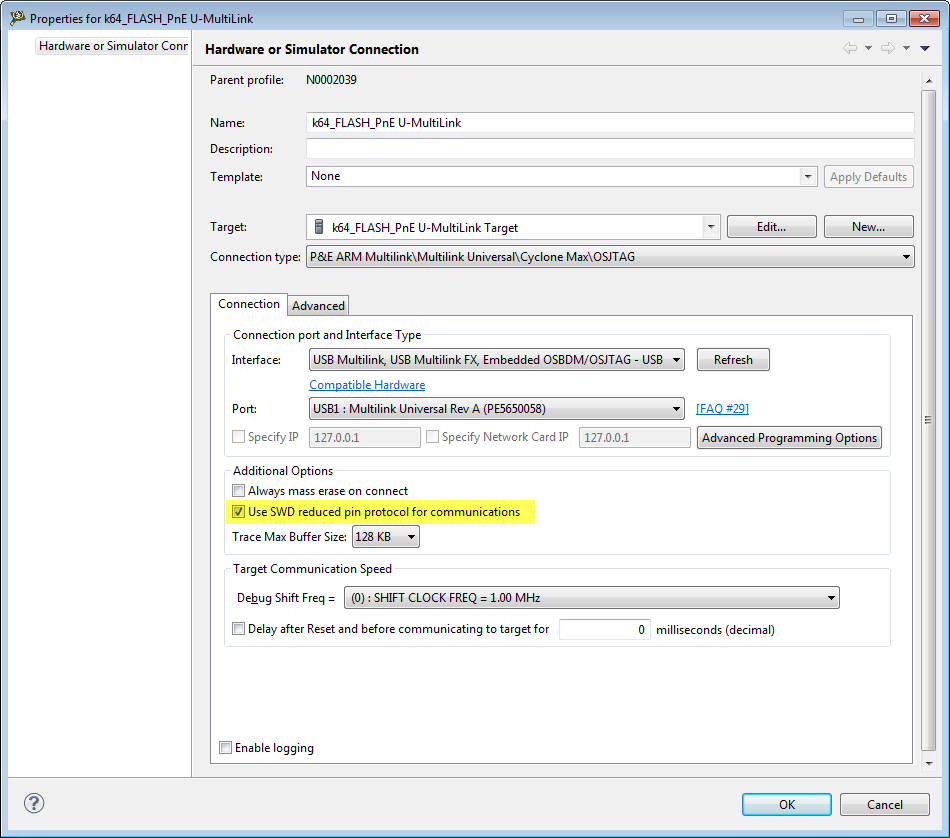
P&E Universal Multilink configured to use SWD
J-Link Firmware
The other thing is: make sure you are using the latest Segger J-Link Firmware (http://www.segger.com/jlink-software.html) and that you run the Segger J-Link updater (I’m using J-Link ARM V4.84c).
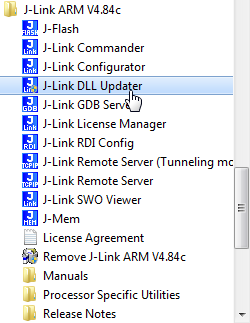
J-Link DLL Updater
That way your Segger DLL’s installed (in IAR, Keil, CodeWarrior, …) get updated to the latest version.
Summary
It is possible to use the FRDM-K64F with CodeWarrior for MCU10.6, but it does not support the CMSIS-DAP interface: an external JTAG/SWD probe like the P&E Multilink or Segger J-Link is needed. But until the KDS is available, the board can be used with CodeWarrior. CodeWarrior for MCU10.6 is Windows only, while KDS supports Windows+Linux (Mac OS X later this year).
What could be the next article? Using Eclipse Kepler with the FRDM-K64F? Using a FRDM (e.g. FRDM-KL25Z) board to debug the FRDM-K64F? Post a comment and I see what I can do for you ;-).
Happy Freedoming 🙂

Is USBDM completely out of the picture now, for these advanced chips/boards?
-Bill
LikeLike
Hi Bill,
I don’t think so. But I have not seen a USBDM port for the K64F yet. But my prediction is that OpenOCD with CMSIS-DAP probably will win in the future. Simply because OpenOCD supports as well non-Freescale microcontrollers, so might be a more universal (open source) debugging platform.
LikeLike
I’d just hate to be held hostage by P&E if it can be avoided. Like has happened in the past.
LikeLike
I use 10 pin cable for jtag not only swd with other targets… I think it’s possible to use with kinetis devices. The use of 20 pin cable most of the time it’s just for trace features…
LikeLike
Hi Mat,
indeed, I was wrong on that. Looks all Cortex M0+ only support SWD. I’ll need to dig more on this and plan to update my statement 😉
LikeLike
I think I followed the above instructions to the letter, but still can’t get download/debug to work.
I have/use:
– an FRDM-K64F
– a P&E Multilink Universal, with 10 pin cable, exactly hooked up as in your pictures. Debugger’s blue and orange LEDs are on.
– CW 10.6. Checked the ‘Use SWD reduced pin count protocol .. ect’ checkbox on the Debug/Connection tab. Both the Interface and the Port are found (USB1: Multilink Universal Rev B) (CW even upgraded the debugger’s firmware when it first saw it).
And yet, when I click ‘Debug’, I get the error “An error occurred while connecting to the interface hardware or target specified in the Launch Configuration Dialog”.
When I cancel out of the debug dialog, I get this error:
“Error launching FRDM_Test_FLASH_PnE
ARM GDI Protocol Adapter : Can’t connect. The Debugger can not connect to the P&E device”
I also noticed my program (that I loaded with mbed earlier), is running: usually when I use a JTAG debugger, the processor is held in reset. But that could be because this is SWD, not JTAG.
Anyway, what else can/should I try or check, any recommendations?
And a more general question: is using the new KDE recommended over using Codewarrior?
Any help is greatly appreciated.
~ J
LikeLike
Not sure what this is. Are you able to debug other boards/targets with your USB Multilink universal (just to make sure it is not a driver installation issue? On the other side: if the blue LED is on, then it looks like things are ok). Make sure you have ‘USB Multilink’ selected in the Connection dialog. Is in the ‘Port’ your multilink showing up? And your jumper settings on the board are the same as on my picture?
Last but not least: I have put my project with all the settings on GitHub (https://github.com/ErichStyger/mcuoneclipse/tree/master/Examples/FRDM-K64F/FRDM-K64F_LED), so you might try it?
LikeLike
Pingback: Debugging Failure: Check List and Hints | MCU on Eclipse
Short update: P&E has now an OpenSDAv2 firmware 🙂 freescale community docs/DOC-100718
LikeLike