We have a project imported, have built it, time to debug it on the hardware.

The ‘Debug Probes’ sections shows me the currently connected debug probes:

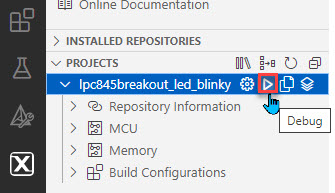
To debug a project, I click on the ‘debug’ Icon (triangle) of the the project:
In the case of having multiple probes attached, it asks for the one to be used:

Should I decide later to use a different debug probe, I can reset the probe selection:

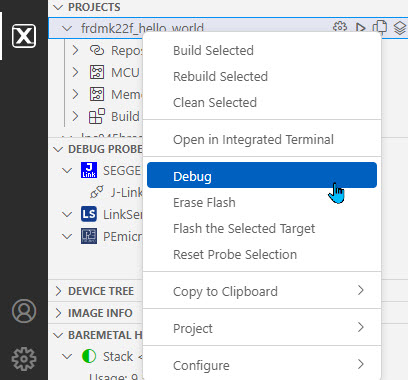
Another way to debug to debug the project is using the context menu. From there I can as well erase the flash, program the device without debug and reset the probe selection if needed:
After a few seconds, I can debug my application on the board:

A small toolbar is used for continue, step over, step into, step out, restart and stop debugging:
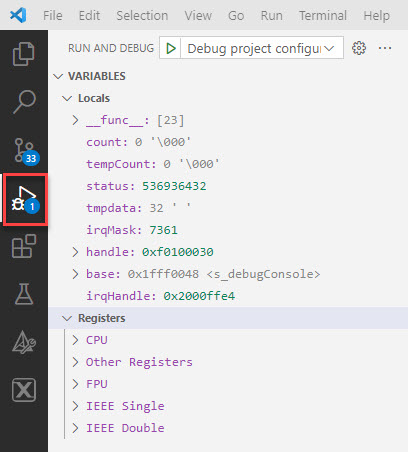
Local variables and registers are shown on the left:
Just below that, there is the view for the call-stack:

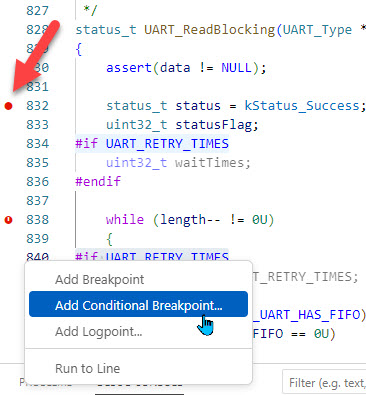
Breakpoints are set on a source line. Either directly clicking on the left of the line number, or using the context menu which offers additional breakpoint types:
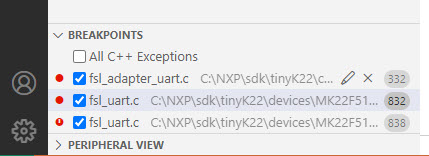
The breakpoints view is used to manage all the breakpoints:
With this, I can flash my application and debug it.
So far I have used projects and devices supported with the NXP MCUXpresso SDK 2.13. My next article shows how to deal with SDKs which only have on older SDK.
Happy debugging 🙂


Hi,
Nice article . I’m trying to find rebuild and restart . Have you found a way to do that ?.It would be great to make an article on ARM extensions on VSCODE . Specially the CLANG compiler . First time i see such lack of information .
Thanks again for all your work,
LikeLike
Hi Michael,
thank you! As for rebuild&restart: have you considered using a ‘task’ for this. I’m using it in one of my previous articles: https://mcuoneclipse.com/2021/05/06/visual-studio-code-for-c-c-with-arm-cortex-m-part-3/
LikeLike