
By default, the debugger cares about the initial register settings after connecting to the target. But for special cases like using a bootloader combined with a loaded application, this requires a bit more than the usually ‘standard procedure’. For example I need to set both a custom program counter (PC) and stack pointer (SP).

The principle is pretty much the same for every IDE or debug probe used. But the exact details (as always) can be different for the debug probe used. I’ll show it here with using the NXP MCUXpresso IDE 11.7.x and using the P&E (PEMICRO) debug probe.

Standard Procedure
Here is what usually happens if you press ‘debug’ in your IDE (simplified):
- Debugger process gets started, with the ELF/Dwarf binary as input to be programmed to the device
- The debugger programs the memory of the device, based on the information in the binary, which usually includes the vector table
- Debugger sets a breakpoint on the ‘main’ symbol
- Debugger performs a reset of the target to run it
- The target starts executing according to the hardware reset sequence, e.g. fetching initial PC and SP from the vector table
- Target runs until it hits the breakpoint on main from step 3 from above
Now in the context of a bootloader, you might want to start execution not from the original vector table, but from a different location. This requires to set a custom program counter (PC) and stack pointer (SP) with the debugger in step 5 from above.
💡 Note that setting this custom SP and PC is done with the debugger. So running the target without the debugger will show a different flow of execution.
Setting Program Counter
Setting a custom PC is simple in Eclipse: there is a setting for this in the launch configuration Startup tab:

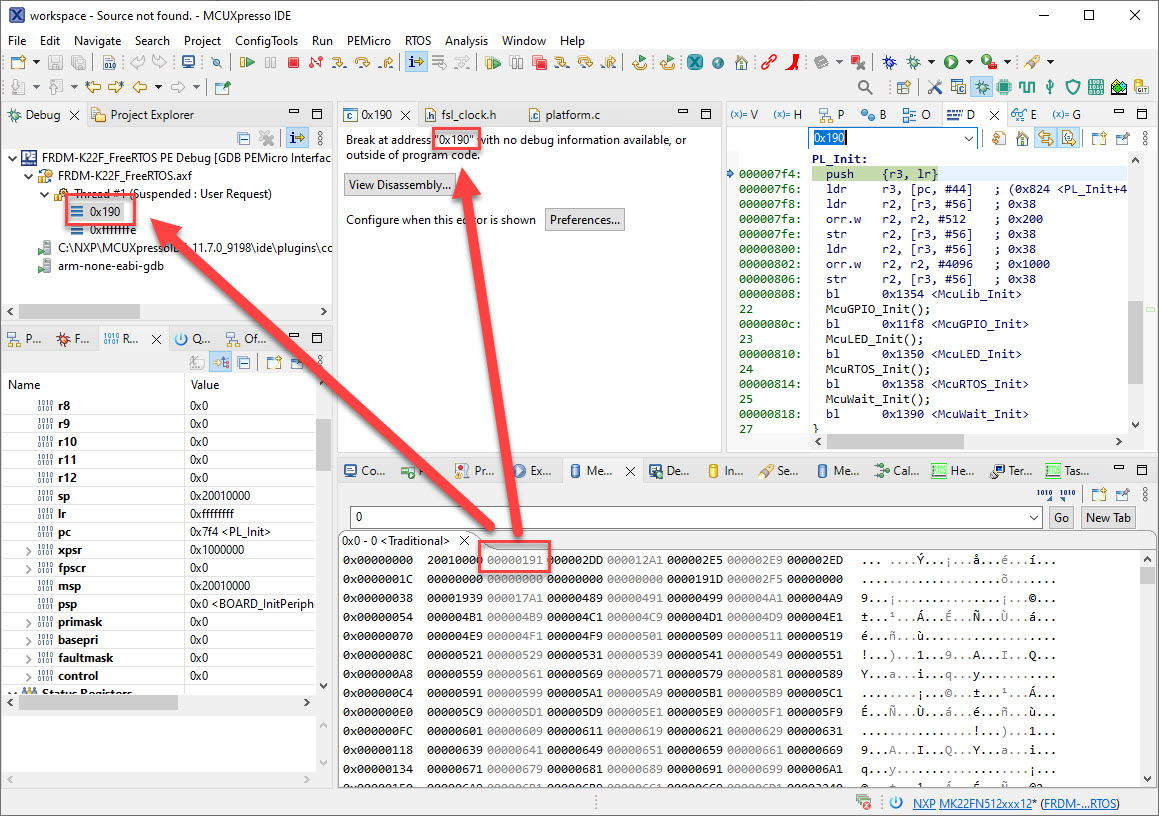
I have disabled the ‘run on reset’ part (see step 4 from above) so I can verify it is indeed doing what I want. The debugger shows me this:

As you can see, the PC value is correctly set and code execution starts from the desired function.
You might notice that the debugger tries to show the source for the address 0x190. As seen from the gdb traces, this is because the debugger tries to list the initial thread list. So what happened is that the debugger first fetched the values from the vector table, and then changed the PC. This can be verified with looking at the vector table which contains 0x190 (plus the thumb bit) as initial PC:
Setting Stack Pointer
Now what about the initial stack pointer. As you might have noticed in above picture: the SP is still set from the value in the vector table:

To have custom SP, some trickery is needed: we need to set the SP (Register 13) using a small script file. So create a text file (e.g. init.mac) with following content:
R13 $20000000
This sets the register 13 (MSP, SP) with the value 0x2000’0000.

Then use that script file in the launch configuration. There is a setting under ‘Advanced Options’ in the PEMICRO debugger settings where I can specify a script:
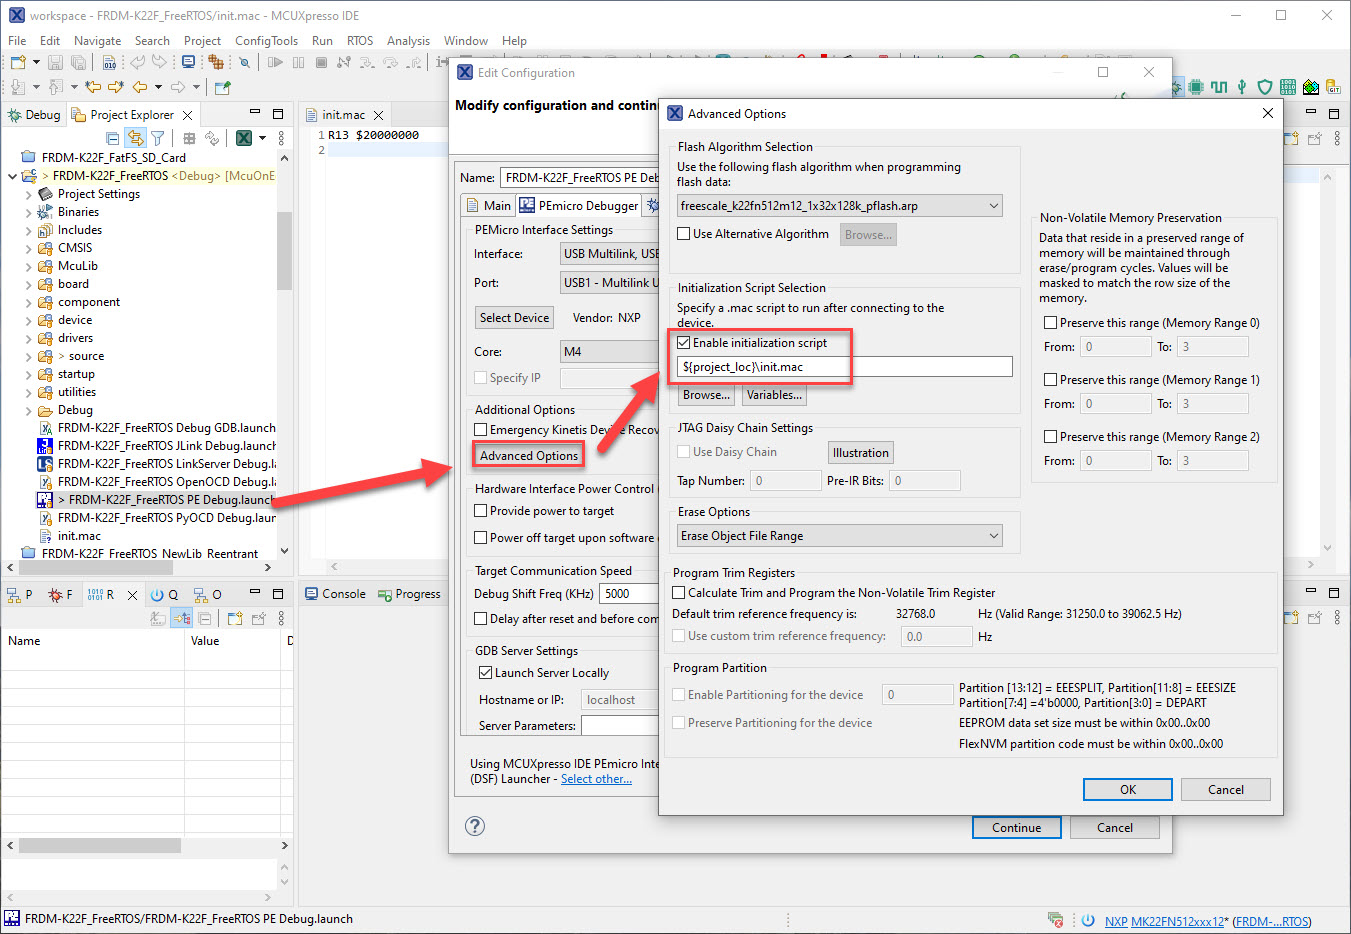
With this, I have both my custom PC and SP configured through the debugger:
Summary
Sometimes it is necessary to have a custom download or startup sequence executed by the debugger. In this example I showed how the initial PC and SP register content can be configured by the debugger, for example to execute a custom starting point with a custom stack location. The approach shown here is very useful in the process of bootloader development, or in the context of reverse engineering ;-).
Happy debugging 🙂

Don’t you need to change the vector table address at startup? It is usually something that is done by the bootloader, but if you want to skip the bootloader at all, I think you should change the vector table in your custom startup process.
LikeLike
It depends. The vector table only really gets used once you enable interrupts. And you certainly can relocate the vector table in the code with the relocated PC/SP location.
LikeLike