Sometimes things don’t go well, especially with bringing up a new board design. I always sweat blood that first minute when I try to connect with the debugger to a new design: Will it work? After the optical inspection, performing electrical tests (no shortcuts? voltage levels ok?) the inflection point is when I’m connecting the first time with the debugger to the new board: either it will properly connect and program the device (hurrah!) or it will fail and potentially difficult hours of investigations have to follow.
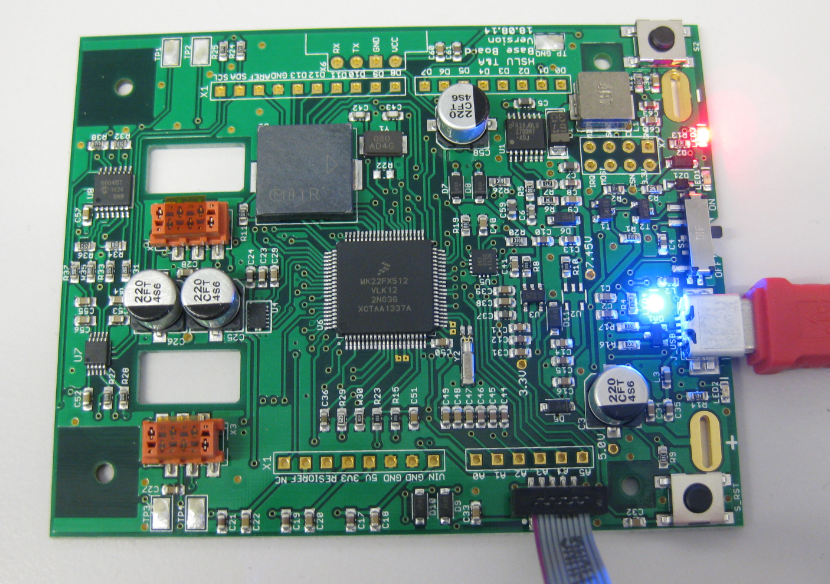
First PCB under Debug
Check Lists
In general I recommend to design the circuit and especially the debug circuit as it is on an evaluation board (e.g. Freedom or Tower board). Make sure you have one (better two) ‘reference’ board of your microcontroller ready, so if something goes wrong, you have a working example. Additionally have a good dedicated debug probe (e.g. P&E or Segger). They usually are better on the electrical side and many times they were able to connect to a ‘on the edge’ board where low-cost debug solution failed.
Below is a list of things to check after you have the boards in your hands:
- Visual inspection of the board. Does it look right? Make sure the board is clean (solder paste, solder, cleaning fluids).
- Are the components placed properly on the board? Parts properly oriented (pin 1?). I had a batch of boards with the QFN microcontroller mounted 180° rotated 😦
- Check traces: no shortcuts? We are using lasers and milling for internal boards, and there we face problems with copper still between the traces, or low-resistance between traces because of unclean boards (see “Learning from Failure: QFN Package Corner Problem“).
- Check the vias: We had boards which not all the vias were properly manufactured 😦
- Additional checks are available in “Debugging Failure: Check List and Hints“
GDB Traces in Eclipse
Another useful thing to check what is going on is to use the logs GDB can produce. For this I have enabled the GDB traces in Eclipse under the Preferences:

enabled GDB Traces
This logs gdb commands to a special gdb traces view in the Eclipse Console view:

GDB Traces under Console View
This log has all the GDB/mi commands and gives insights what gdb is doing. The content might look a bit cryptic, but it basically reports all the commands gdb is executing.
For example this:
Read 4 bytes @ address 0x000020A8 (Data = 0xF7FFB510)
Setting breakpoint @ address 0x00001FFE, Size = 2, BPHandle = 0x0001
Starting target CPU...
...Breakpoint reached @ address 0x00001FFE
Reading all registers
Removing breakpoint @ address 0x00001FFE, Size = 2
Read 4 bytes @ address 0x00001FFE (Data = 0xFBD3F7FE)
Reading 64 bytes @ address 0x2002FFC0
Performing single step...
WARNING: Failed to read memory @ address 0x40000000
In above example I had a watchpoint set to an address which does not exist on the target.
GDB Logs
The GDB traces are very low-level. If I want to look more what the GDB client does on a high level, there is a log for this too in the Console view:

GDB Client Log
For example
No breakpoint number 2.
tells me that I still have an invalid breakpoint hanging around I should remove. Or this one:
Loading RTOS plugin: RTOSPlugin_FreeRTOS.dll...
Connecting to J-Link...
RTOS plugin load failed
J-Link is connected.
Firmware: J-Link OpenSDA 2 compiled Apr 24 2014 14:44:11
Hardware: V1.00
Checking target voltage...
Target voltage: 2.50 V
Listening on TCP/IP port 2331
Connecting to target...Connected to target
Which helped me to find out what FreeRTOS was not shown up with all its threads, because the RTOS plugin name/path was incorrect. Or it told me that the target voltage was 2.5V and not the expected 3.3V :-(.
GDB Server Logs
Another useful thing are the GDB logs produced by the GDB servers like from Segger and P&E:

Segger GDB Server Log
For example if I think that the debugger is reading some memory it should not read from, then this view should be able to tell you this.
Same thing exists for P&E where the P&E server reports diagnostic information:

P&E GDB Server Log
Summary
To me, bringing up the board the first time is always an inflection point. There are a lot of things which can go wrong. And in that case any piece of diagnostics can help to nail down the problem. And if for myself I cannot spot the problem, I can copy-paste the logs and send it in as part of my problem description/bug report (if any). So this information was always helpful to me. And it helped me a lot to see and understand what GDB is doing in the background too.
If you have any other tips and tricks around GDB and board bring up: let me know and post a comment!
Happy Logging 🙂

Pingback: Eclipse and GDB: Process Properties, Arguments and GDB Traces | MCU on Eclipse
I can’t find GDB, but only C/C++ > Debug > GDB MI. Is it the same?
Debugger timeout (ms): 10000, Launch timeout (ms): 30000 and a “tick” at the Automatically Refresh modules checkbox.
LikeLike
that depends on the CDT/GDB you are using. If you are using the standard Eclipse+CDT at least in Kepler/Luna, then you should see just ‘GDB’.
LikeLike
Are you using Kinetis Design Studio? If yes, then you should see exactly that dialog.
LikeLike
Pingback: Workaround for “Error in final launch sequence: Cannot execute this command without a live selected thread.” | MCU on Eclipse
Pingback: Troubleshooting Tips: Failed Debugging with GDB | MCU on Eclipse