I have I project which I want to debug on multiple boards the same time. So how can I download and debug the same application to multiple boards/processors, and debug them all the same time from within the same workspace and Eclipse IDE?
This is a typical scenario I have with my RNet stack: the same application runs on multiple boards, and I want to debug all the boards with the same project with the same Eclipse. For example to wireless sensor nodes with the RNet nRF24L01+ stack as in the picture below:
Multiple Boards, Multiple Debug Connections, Different Projects
Debugging different projects on multiple boards the same time is not a problem: simply start ‘debug’ with that project, and a new debug session is running. If using multiple debug devices (e.g. P&E Multilink), I only need to make sure it is using the correct USB connection.
Multiple Boards, Multiple Debug Connections, Same Project
My scenario is not that ‘daisy chained JTAG debugging’ where I want to debug multiple cores on the same JTAG chain with a single debug connection.
My scenario is that I have multiple debug connections (multiple Segger J-Link, P&E Multilink, OpenSDA or a combination of it). So each board has its own debug connection.
Debugging the same project again?
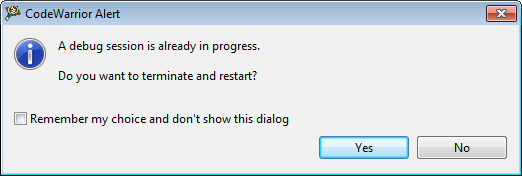
If I do a ‘debug’ on a project already under debug, then this is not possible:
What dialog appears depends on Eclipse/Debugger used. But debugging the same project with the same debug/run configuration is not possible. I cannot have multiple debug sessions with the same debug configuration.
Creating New Debug Configuration
The key is that “I cannot have multiple debug sessions with the same debug configuration”, which gives a hint to the solution. I need a new debug/run configuration! Then I can debug the same project multiple times :-).
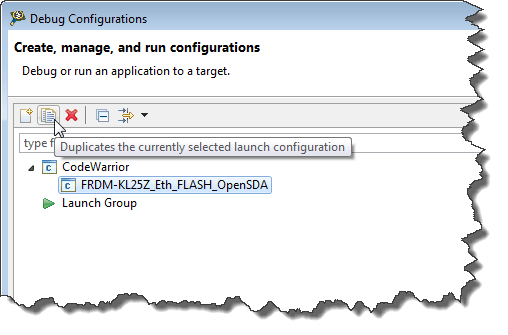
To create a new debug configuration, I use the menu Run > Debug Configurations. From the available debug configurations I select the one I want to debug multiple times and use the ‘duplicate’ icon: This duplicates my run configuration:
This creates a copy of the debug configuration:
Debug the First Board
Now I can select the debug configuration I want to start first, and press the ‘Debug’ button. This is not different from doing a normal debug: Here I start my first debug configuration for my first board:
Starting Debugger for Second Board
While my first board is under debugger control, I want to start a new debug session for my second board. For my second board I need to use my new debug configuration and start this one. One way is to do this from the debug configuration dialog. To make sure that I’m using the correct USB connection, I press the Edit button in that dialog:
In that next dialog, I make sure that it is using the currently not used (not open) connection:
💡 The Debug Configuration dialog ‘remembers’ the used USB ID. However, if I change/switch/swap the USB port or board, I need to verify it is using the correct USB connection.
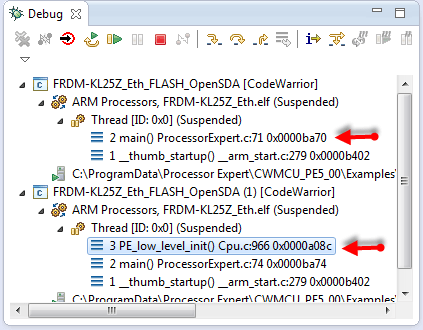
Then I can close the dialog with OK and press Debug to start a new debug session. Now I’m debugging my second board with the same application in parallel: 🙂
💡 I can tell from the launch configuration name in the Debug view which board it is.
Multi-Project-Board Debugging
Debugging the multiple boards really as ‘single thread’ (single debug session) debugging.
Switching Threads/Context
To switch between the boards/treads, select the one you want to debug/step/etc:
The same thing needs to be done for the other debugging views (variables/memory/etc) if I want to view them in the context of one thread (or board).
Breakpoints
If I set a breakpoint in a source file, then the breakpoint will be set for all threads! I can disable the breakpoint for the other thread if I want in the Breakpoints View:
💡 As the same source file and application file is used for both threads, it might not be obvious which one is for which thread. To my knowledge the list order is the same as in the Debug view: so the first line is for the one which is listed first in the Debug view.
That’s it! With this I can debug the same project on multiple boards the same time 🙂
💡 The look and feel is really not different from ‘real’ multi-core debugging in Eclipse. It is the same concept.
Summary
Debugging different projects on multiple boards the same time is easily supported in Eclipse. If I want to debug the same project multiple times in parallel on different boards, all what I need is to duplicate my debug configuration.
Happy Multi-Debugging 🙂


Can I debug several projects in the same board???
LikeLike
Hi Luis,
that depends. For a common use case see https://mcuoneclipse.com/2012/12/08/adding-symbols-to-the-codewarrior-debugger/.
The other use case would be multicore (multiple cores in the same chip), that’s possible too (if supported by the debugger).
LikeLike
Thanks Eric 🙂
LikeLike
when i open debug configurations this erro occurs : An error has occurred. See error log for more details.
The function “close” returned an error condition (0x80004005)
LikeLike
Hmm, that sounds like a corrupted debug configuration. Can you create a new one, or try with a new workspace?
LikeLike