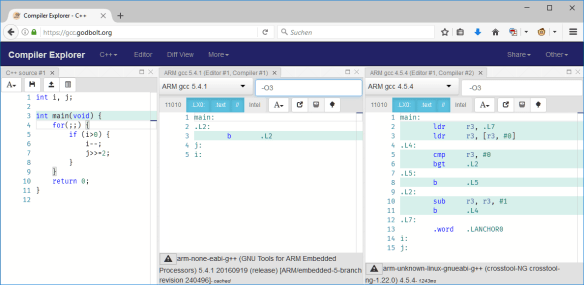
If you are like me – someone who always wants to know what the compiler generates for a piece of source code – then have a look at the Compiler Explorer: A web-based compiler code comparison tool:
Thanks to Matt Godbolt, I can select different compilers and compare their output for a given source code. Very useful to see the impact of a compiler optimization or to compare different GCC compiler versions.
Happy Comparing 🙂


With SEGGER’s Ozone, that can be conveniently done for a loaded program:
Every source line that that generated instruction has a PLUS sign in front.
Clicking on it shows the instructions for that line, making code analysis during debugging very easy. No need to open a separate tool or disassembly window.
Great for analyzing performance and optimizing
Happy Optimizing!
LikeLike
Why only Ozone, most of commercial IDEs such as IAR, KEIL support source disassembly during debugging. Compiler Explorer will be particular useful for firmware developer if hardware not come to hand yet.
LikeLike
Most commercial IDEs offer a disassembly window. It uses up a lot of space on the screen, since now you have two windows (source and disassembly window), and it is not selective: With Ozone (the J-Link debugger) one can open just selected lines and focus on the interesting part on the fly, during debugging or while just browsing the program.
Ozone is not an IDE, it is a stand-alone debugger in its own package, and it can debug
anybody’s ELF file, generated by IAR, KEIL, GCC or Clang/LLVM.
Free for evaulation or non commercial use. Worth a try I feel. It is a standa lone debugger, that can be used instead of the build in debugger of other IDEs, and I find this a really helpful feature to investigate what my C-Code has actually been translated into,
as all it takes is a single click to open the line. Hope that explains the difference, if not:
Try it and let me know what you think.
LikeLike
Thanks for the details. Yes, I will give it a try.
LikeLike
Your Welcome.
LikeLike