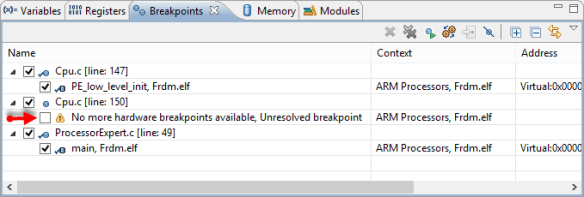
The challenge with small microcontroller like the ARM-Cortex-M0+ is that they have very limited debugging resources. As such, the number of hardware break points is very limited (see this post). For example for the KL25Z on the Freedom board, I only have 2 break points available if I want to do stepping:
Until recently, I was constantly disabling/enabling break points so I can do stepping. Until I have found out the following trick:
There is a ‘skip all break points’ button in the Breakpoints view:
With this, I disable all break points, and have them all available for stepping. The icon in the source view gets changed too: it has a crossing line on it:
Summary
It is easy to overlook the small things which makes my live much easier. One of this small items is this ‘Skip all Breakpoints’ thing which saves me many clicks every day.
Happy Skipping 🙂


I tend to embed a lot of breakpoints in source code on micros. I wonder if this option will automatically skip those? I’ll have to give it a try.
LikeLike
Hi Bill,
if you embed the breakpoints as software breakpoint directly in the source code, then this is not affected by this option. This option disables the setting of the breakpoints by the debugger (at least this is how I understand how it works).
LikeLike
Hi Erich
That is a useful and new feature for me, thank you. If you could share how to use conditional breakpoints that would be very welcome. I have never understood how to effectively use the conditional properties of the breakpoints to trigger a stop at specific points of execution. It would be very helpful to trigger when a variable is written to, or when a loop hits a certain value. I have tried these but did not get them to consistently work also I have never found any useful examples on this on the web sites. Most of what I have seen deals with complex address calculations that take more time then simply working without the conditional breakpoints.
LikeLike
Hi Robert,
sure, I put conditional breakpoint on my bucket list. As for the second thing (triggerign when a variable gets changed), I have already something available: https://mcuoneclipse.com/2012/04/29/watchpoints-data-breakpoints-in-mcu10/
And yes: conditional breakpoints typically will work that way: the debugger hits the breakpoint, then it evaluates the condition. If false, it continues execution. As such, this will be very intrusive.
LikeLike
This was very helpful.
lot of thanks.
LikeLike
Bravo to you again! I just posted on your “Bricking and Recovering FRDM-KL25Z Boards: Reset, SWD Clock and Low Power” topic: https://mcuoneclipse.com/2013/06/16/bricking-and-recovering-frdm-kl25z-boards-reset-swd-clock-and-low-power/
I was so happy that my debugger wasn’t constantly crashing, but then I thought I posted too soon: all of my breakpoints show up with a slash through them, and they won’t stop. I guess it wasn’t the victory I was hoping for…
After a tortuous path searching for what the slash in the breakpoint icon means, and learning of the concept of skipped breakpoints, I come across yet another of your useful posts. Turns out that I had inadvertently clicked the magic skip all button. Click that off and now I can stop on a breakpoint again. Yipppee!
I’ve spent so much time inside the Eclipse/CodeWarrior IDE over the years, but I still only understand a tiny fraction of its multitudinous commands and options…
Thank you again!
LikeLike
Hi Adam,
you are welcome (again!) :-).
And at least once in a semester, at least one of my students at the university clicks on that ‘skip breakpoint’ button too. It is easy to do such a mis-click, but hard to see the impact if not knowing it. That was the reason to write that article with the hope that others can find it, so I’m very happy you did find it.
Erich
LikeLike