Usually I compile my sources, link it and pass it to the debugger for downloading it to the target. And ‘downloading’ means for me: flashing to the target (RAM debugging is something for the non-hardcore programmers ;-)). But there are more options than only downloading and flashing. There is definitely more which helps me to do post-mortem (yes, I *love* Latin :cool:) debugging.
Downloading means to me that the debugger will program my application into the device, then loads the symbolics (debug information, source file information, …) and then I debug my application. Looking at the ‘Debug As’ options, there is as well Attach and Connect:
Post-mortem debugging is term I use to describe debugging my application which for example has stopped working. Usually I have an LED as a heartbeat, and after the application on the board was running for hours, days or weeks, the heartbeat LED stopped flashing. So my application crashed or is hanging somewhere. I cannot debug it in the normal way, as with this I would erase and re-program the application. What I need is a ‘hot-sync’ to the target: I need to connect my debugger to that application on the board and inspect what is going on. So I need to explore the different meanings of ‘download’, ‘connect’ and ‘attach’. And this is this post all about.
What is what?
Download is what traditionally is known as ‘debugging’: that’s the sequence of programming the device and then controlling it through the debugger. For this I need the application file (e.g. ELF/Dwarf file). And with it I have all the source level debug information.
Connect is establishing a debug connection to the target device. It does not program it, it just connects. So no application file is needed, and indeed ‘connect’ is very useful if I do *not* have the application file. I connect to the target, and then I can inspect it, without the need to know what is on it. *Very* useful for reverse-engineering :twisted:. But it means as well: as no source and symbolic debug information is available, this means debugging on assembly level. Still, very useful if I do not have the application at hand (or do not know it any more), and want to find out what the target is doing, or why it has crashed.
Attach is the same as ‘connect’, except that here I *do* have the project at hand on the target. That means with ‘attach’ I connect to a target and can debug it as usual. So ‘attach’ again is very useful to inspect a running (or maybe crashing) application on the device without erasing and re-programming the application on it. Attach is very useful too as it avoids the possibly lengthy process of flashing the application to the device. I did not make any change in my sources, I just wan to do another debug run? Then ‘attach’ saves a lot of time.
Connecting
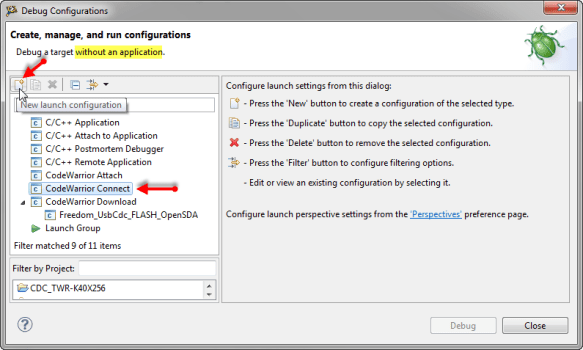
To create a new ‘connect’ debug configuration, I use the menu Run > Debug Configurations. Here I select ‘CodeWarrior Connect’ and press the ‘new’ button:
💡 Hint: If I do not remember the difference between ‘attach’ and ‘connect’: the hint text at the top of the dialog explains that this is *without* an application, so no debug information will be needed or possible.
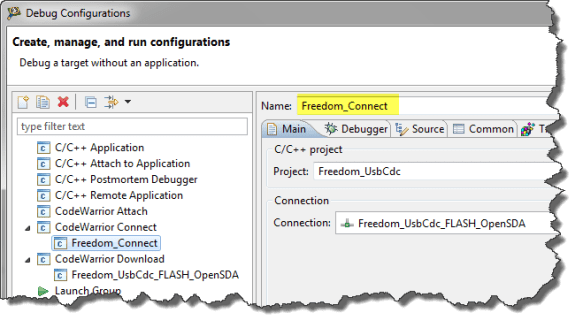
This creates a new configuration for attaching to the target: what it needs is how I connect to it (the connection):
❓ Wondering why there is a ‘Project’ for this? The reason is that Eclipse needs a project folder (or container) where it can store the configuration. So that project/container is not necessarily the application project I connect to.
Next I need to select a Connection: ideally I have already matching connection to the board I want to connect to:
❗ At the very least, I need a project as a container for the launch configuration settings. Plus I need a connection matching my board and my connection method (e.g. OpenSDA or P&E Multilink). An easy way is to use the new project wizard (File > New > Bareboard Project) to create a dummy project and the connection. It is very possible to create a new connection with the ‘New…’ button (see this post for all the important details).
And this maybe sounds like a cosmetic thing: naming the configuration to what it means is always helpful:
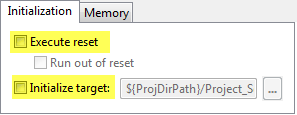
One very important ❗ thing to know is that ‘connect’ *is* using the Initialization settings (found in the Launch configuration > Connection Settings > Target Settings).
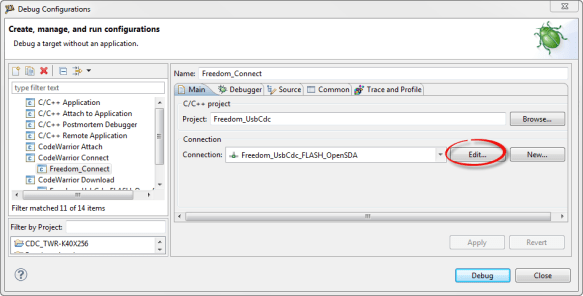
To get there, I press ‘Edit’ on the connection:
Then I press ‘Edit’ on the Target:
So if I do *not* want to reset and/or initialize the target, then I need to *disable* it here first:
Now I can press ‘Debug’ and it will connect to my target:
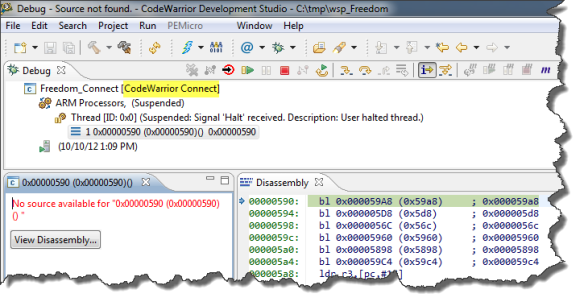
As expected: there is no source level debugging (thus “no source available”): but I have all the other views like Disassembly and Memory views which help me to understand the state of the target at the lowest level.
Attach
The other way is to ‘attach’. As outlined at the beginning, this means to connect to a board for which I do have the application file running on it. So it means the same as ‘connect’, but with debugging information.
Creating a new ‘attach’ configuration is similar to the ‘connect’ configuration: only this time I need to specify as well the application file (with the debug information) to use:
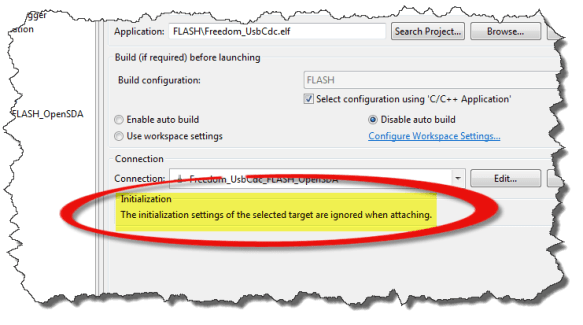
A very important detail to note here in the above dialog is this:
That indicates that in contrary to ‘connect’ described above, with ‘attach’ the reset and initialization settings *are* ignored. That means that if I do an attach, the target will be running, and I always need to stop it. And: debugging with an attach configuration allows me to debug it with source level debugging as I have provided the project and source level debug information with the application ELF/Dwarf file:
💡 Keep in mind that if enabled in the connection settings, the initialization scripts are executed as well as part of the attach operation. If not desired, then I can disable this in the target connection settings:
Summary
While in a typical development cycle the ‘download’ is used, the possibility of ‘attach’ and ‘connect’ are incredible helpful. ‘Connect’ allows me to connect to an ‘unknown’ target application, while with ‘attach’ I can inspect such as a device in the field without changing the application on it. Both are very useful to find and debug problems. One thing to keep in mind is that for ‘connect’ I need to *disable* reset and initialization if I want to stop the target as it is running.
Happy Attaching, Connecting and Downloading 🙂







Hello.
I don’t know if I’m missing something here, but could you elaborate more on the Launch settings location (Launch configuration > Connection Settings > Target Settings). I can’t seem to find them anywhere.
Thanks.
LikeLike
Sure, and sorry. I have added two additional screenshots how you get from the launch configuration to the connection settings. You need to click ‘edit’ on the connection in the launch config, then press Edit on the Target, then you get to the target initialization dialog. I hope it is clear now.
LikeLike
Hi Erich
I am getting the error, with the k20 and MQX, and CW10.3
No source available for “0xFFFFFFFE (0xFFFFFFFE)() ” when I download. This code used to work correctly until I moved it to a new offset because of the bootloader (0001_0000, from 0000_0000). There is very little help on the forums on this; is there a file that needs to be adjusted for the debugger to work? I thought that was all automatic. Changed the lcf in MQX back to build where it used to be, but this does not correct the problem. I tried building new projects as well as new connections to the target, building new download configurations totally, but nothing works.
Any advice where to look would be appreciated. I can’t see anything that causes this error.
Thank you
Robert
LikeLike
Hi Robert, in case this is related and helps: I described how to load symbols into a debug session: https://mcuoneclipse.com/2012/12/08/adding-symbols-to-the-codewarrior-debugger/
LikeLike
Pingback: Adding Symbols to the CodeWarrior Debugger | MCU on Eclipse
Pingback: Freedom Robot solves the Maze | MCU on Eclipse
Pingback: DYI Free Toolchain for Kinetis: Part 1 – GNU ARM Build Tools | MCU on Eclipse
Pingback: New CodeWarrior for MCU10.5 | MCU on Eclipse
Thanks for this well written and useful article
LikeLike
Thank you for your very useful article
LikeLike
thank you for the feedback, appreciated!
LikeLike
Hi Erich,
I found this old post of yours to help me with an issue with MCUXpresso v11.3.0
I just want to connect to my FRDM-KL25Z board, with OpenSDA, to get the flash image to PC.
But I don’t see, in any part, how to just connect the device in debug mode. In the debug it always flash and lauch the project executable. I don’t want this.
There is a way to just get the flash memory image from MCU to PC from MCUXpresso?
Thanks in advance!
LikeLike
You can use the Flash programmer (https://mcuoneclipse.com/2017/05/06/using-eclipse-to-program-binary-files-to-an-embedded-target/). Or you can use ‘run’, see https://mcuoneclipse.com/2014/10/04/emulating-eclipse-run-with-debug-configuration/. If you want to use Drag&Drop programming with the bootloader, you can implement a MSD bootloader or you load the Segger OpenSDA firmware with MSD support.
If you want to read the FLASH memory, you can use the SEGGER J-Link program or use the Eclipse memory view, see https://mcuoneclipse.com/2012/05/04/dump-my-device-memory/. So you have plenty of options 🙂
LikeLike
Thanks for the reply!
The first part:
“You can use the Flash programmer (https://mcuoneclipse.com/2017/05/06/using-eclipse-to-program-binary-files-to-an-embedded-target/). Or you can use ‘run’, see https://mcuoneclipse.com/2014/10/04/emulating-eclipse-run-with-debug-configuration/. If you want to use Drag&Drop programming with the bootloader, you can implement a MSD bootloader or you load the Segger OpenSDA firmware with MSD support.”
It is not my goal! This part is clear to me!
The second part is of interest to me:
“If you want to read the FLASH memory, you can use the SEGGER J-Link program or use the Eclipse memory view, see https://mcuoneclipse.com/2012/05/04/dump-my-device-memory/. ”
The Segger J-Link is okay, as I could read the flash of my MCU with the J-Link Commander and use the “mem” command.
However, my goal is to use the MCUXpresso to view the flash memory. After seeing your post https://mcuoneclipse.com/2012/05/04/dump-my-device-memory/, I could not understand how to enable the “export” and “import” memory icons without begin the debug mode and erasing the old program in the flash.
LikeLiked by 1 person
You can attach with the MCUXpresso IDE, see https://mcuoneclipse.com/2021/04/25/attach-with-the-debugger-to-a-running-target/, and then read the memory from the memory view.
LikeLike
Thanks for the reply!
What I want is to read from the flash memory, but using, specifically, the MCUXpresso.
The “import”/”export” icons from memory view are highlighted only when I initiate a debug section. But when initiating the debug section it overwrite the old flash program with the project file.
LikeLiked by 1 person
If you do an attach (not debug!), then the flash/memory is unchanged. This is easily possible with the NXP MCUXpresso IDE, see https://mcuoneclipse.com/2021/04/25/attach-with-the-debugger-to-a-running-target/
LikeLike