In case you are running into this problem that launching GDB hangs with this message in Eclipse:
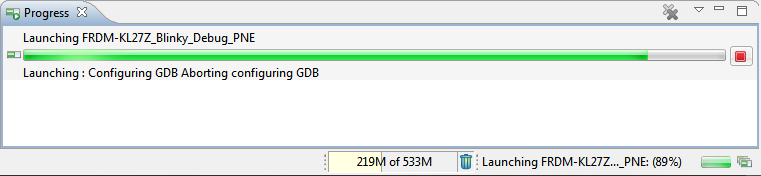
Launching Configuring GDB Aborting configuring GDB
It happens to me with the P&E GDB server with projects created for the Kinetis SDK (see “First NXP Kinetis SDK Release: SDK V2.0 with Online On-Demand Package Builder“).
I had to use the task manager to kill the GDB server.
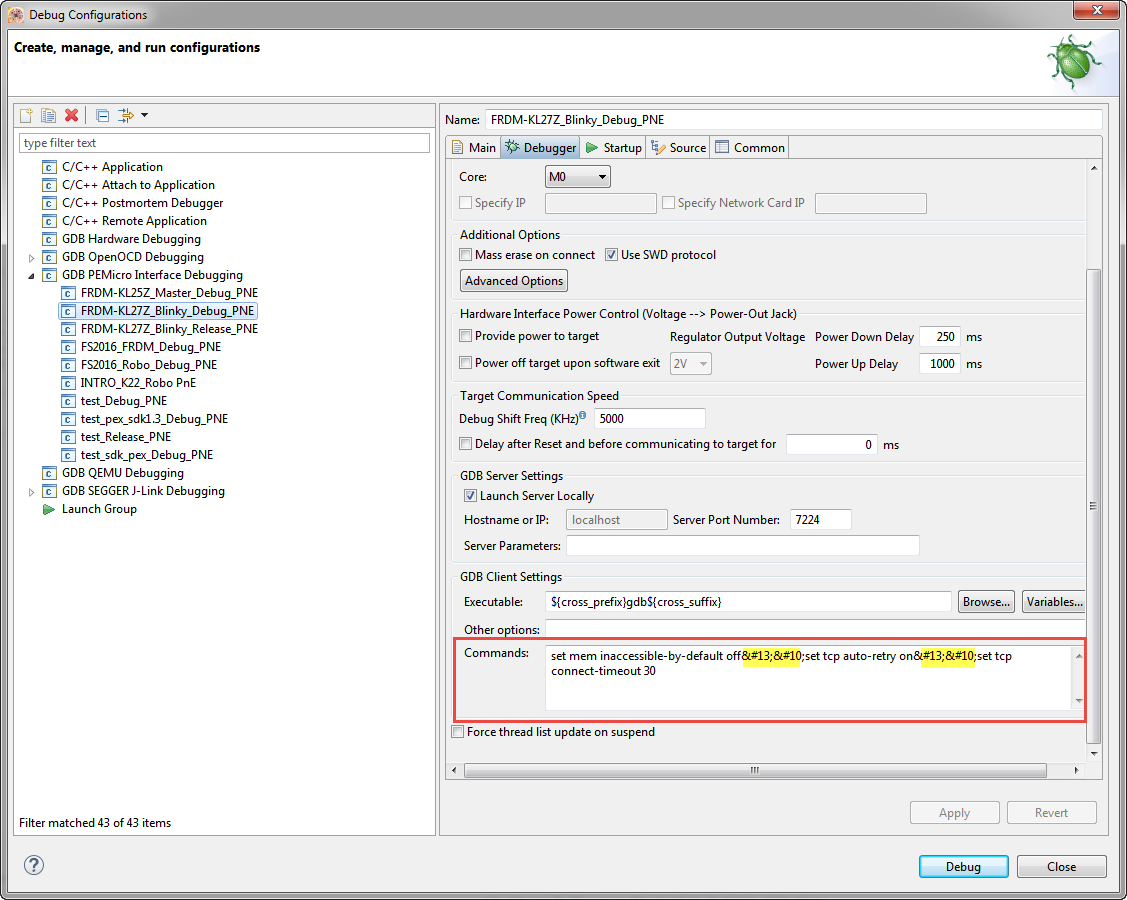
The problem is most likely caused by an invalid launch configuration. To solve the problem, open the launch configuration and go to the ‘Debugger’ tab. The problem is most likely caused by wrong line endings in the ‘Commands’ section:
Debugger Commands
For the above case, fix the text inside the Commands box into
set mem inaccessible-by-default off
set tcp auto-retry on
set tcp connect-timeout 30
with removing the line ending codes. With this, debugging should work as expected.
💡 Kinetis Design Studio V3.2.0 has this problem fixed, see NXP Kinetis Design Studio v3.2.0
Happy Debugging 🙂
Links
- Similar issue on stackoverflow: http://stackoverflow.com/questions/5425396/eclipse-cdt-cant-use-debugger-always-stuck-on-89-process

Small issue … “change … into …” has the same text in both cases above so is a little confusing. 😉
LikeLike
ups! Thanks for pointing that one out: indeed the HTML code of wordpress has automatically fixed the wrong content. I have changed now the text so hopefully it is not confusing any more.
Thanks for reporting!
LikeLike
Hi Erich, I have the same problem, stuck in “configuring gdb aborting gdb”. But text in the command box is correct, there are no line ending codes. Running windows 10, eclipse 4.5. I am able to start pegdbserver_console.exe and arm-none-eabi-gdb.exe and debug my kl25z in the command line. I am stuck, any ideas?
LikeLike
Hi Anthony,
I think there must be something wrong in your launch configuration. Have you tried with a new project or with one of my projects on GitHub? If it works that way then it means that there is really a problem with your launch configuration. I would turn on GDB traces (see https://mcuoneclipse.com/2016/…/board-bring-up-tips-gdb-logs-and-traces-in-eclipse/) to check if this provides any clues.
I hope this helps,
Erich
LikeLike
Thanks for replying, I am using bubble_level project in KSDK 1.3 example projects in kds folder (tried with eclipse 4.5 and KDS) for my kl25z board. Both stuck on “configuring gdb abort configuring gdb”. I will try your suggestion and let you know.
Thanks,
Anthony
LikeLike
Hi Erich, below is the gdb trace, looks like it is giving the -exec-run error “Don’t know how to run”.’
743,074 2-gdb-version
743,080 ~”GNU gdb (GNU Tools for ARM Embedded Processors) 7.10.1.20160616-cvs\n”
743,081 ~”Copyright (C) 2015 Free Software Foundation, Inc.\n”
743,081 ~”License GPLv3+: GNU GPL version 3 or later \nThis is fre\
e software: you are free to change and redistribute it.\nThere is NO WARRANTY, to the extent permitt\
ed by law. Type \”show copying\”\nand \”show warranty\” for details.\n”
743,081 ~”This GDB was configured as \”–host=i686-w64-mingw32 –target=arm-none-eabi\”.\nType \”sho\
w configuration\” for configuration details.”
743,082 ~”\nFor bug reporting instructions, please see:\n”
743,082 ~”.\n”
743,082 ~”Find the GDB manual and other documentation resources online at:\n.\n”
743,082 ~”For help, type \”help\”.\n”
743,082 ~”Type \”apropos word\” to search for commands related to \”word\”.\n”
743,082 2^done
743,083 (gdb)
743,086 3-environment-cd C:/Freescale/KSDK_1.3.0/examples/frdmkl25z/demo_apps/bubble_level_tpm/kds
743,093 3^done
743,094 (gdb)
743,095 4-gdb-set breakpoint pending on
743,104 4^done
743,104 (gdb)
743,105 5-enable-pretty-printing
743,114 5^done
743,114 (gdb)
743,115 6maintenance set python print-stack off
743,124 &”maintenance set python print-stack off\n”
743,124 &”Undefined maintenance set command: \”python print-stack off\”. Try \”help maintenance set\
\”.\n”
743,124 6^error,msg=”Undefined maintenance set command: \”python print-stack off\”. Try \”help main\
tenance set\”.”
743,124 (gdb)
743,126 7-gdb-set print object on
743,134 7^done
743,134 (gdb)
743,135 8-gdb-set print sevenbit-strings on
743,144 8^done
743,144 (gdb)
743,145 9-gdb-set host-charset UTF-8
743,154 9^done
743,154 (gdb)
743,156 10-gdb-set target-charset WINDOWS-1252
743,164 10^done
743,164 (gdb)
743,164 11-gdb-set target-wide-charset UTF-16
743,180 11^done
743,181 (gdb)
743,185 12source .gdbinit
743,191 &”source .gdbinit\n”
743,191 &”.gdbinit: No such file or directory.\n”
743,191 12^error,msg=”.gdbinit: No such file or directory.”
743,191 (gdb)
743,192 13-gdb-set target-async off
743,201 13^done
743,202 (gdb)
743,203 14-gdb-set auto-solib-add on
743,211 14^done
743,211 (gdb)
743,214 15-file-exec-and-symbols C:/Freescale/KSDK_1.3.0/examples/frdmkl25z/demo_apps/bubble_level_t\
pm/kds/debug/bubble_level_tpm_frdmkl25z.elf
743,234 15^done
743,234 (gdb)
743,250 16-gdb-show language
743,260 16^done,value=”auto”
743,260 (gdb)
743,261 17-gdb-set language c
743,270 17^done
743,270 (gdb)
743,271 18-interpreter-exec console “p/x (char)-1″
743,280 ~”$1 = 0xff\n”
743,280 18^done
743,280 (gdb)
743,282 19-data-evaluate-expression “sizeof (void*)”
743,290 19^done,value=”4″
743,290 (gdb)
743,291 20-gdb-set language auto
743,300 20^done
743,300 (gdb)
743,302 21-interpreter-exec console “show endian”
743,310 ~”The target endianness is set automatically (currently little endian)\n”
743,310 21^done
743,311 (gdb)
743,316 22-break-insert -t -f main
743,322 22^done,bkpt={number=”1″,type=”breakpoint”,disp=”del”,enabled=”y”,addr=”0x00001ed2″,func=”ma\
in”,file=”C:/Freescale/KSDK_1.3.0/examples/frdmkl25z/demo_apps/bubble_level_tpm/main.c”,fullname=”C:\
\\Freescale\\KSDK_1.3.0\\examples\\frdmkl25z\\demo_apps\\bubble_level_tpm\\main.c”,line=”62″,thread-\
groups=[“i1″],times=”0″,original-location=”main”}
743,323 (gdb)
743,334 23-exec-run
743,342 23^error,msg=”Don’t know how to run. Try \”help target\”.”
743,343 (gdb)
743,344 24-gdb-exit
743,360 24^exit
LikeLike
Hi Anthony,
it seems you are running a different version of GDB? I have
256,213 ~”GNU gdb (GNU Tools for ARM Embedded Processors) 7.6.0.20140731-cvs\n”
Can you check your PATH settings if you somehow are launching a different GDB version somewhere?
Erich
LikeLike
Hi Erich, thanks for the reply and suggestion. I will look into the PATH and gdb version.
Regards,
Anthony
LikeLike
Hi, Erich, how are you?
I’m having same issue that Anthony to start a debug session with multilink probe. I’m using K64F, KDS and pne debug configuration. It used to work fine, until a install cygwin. It seems like i messed up my gdb version or configuration. Some clue what it could be?
Thank you
LikeLike
Hi Diogo,
I have posted another article with some ideas: https://mcuoneclipse.com/2018/01/28/troubleshooting-tips-failed-debugging-with-gdb/
Maybe it helps?
Erich
LikeLike
Pingback: Tutorial: Blinky with the FRDM-KL27Z and Kinetis SDK v2 | MCU on Eclipse
Pingback: Troubleshooting Tips: Failed Debugging with GDB | MCU on Eclipse