
One of the great features in CodeWarrior for MCU10.x is the ability to read memory/variables while running (see “Live View for Variables and Memory“). This technology of ‘live view’ is based on the CodeWarrior debugger engine. How can I do something like this with stock GDB and Eclipse? What I need is a periodic update of variables/expressions/memory while the program on the board is running, without the need to stop the board with the debugger first:

periodic auto-display output
The problem with normal GDB is: it cannot access the target while the application is running. Actually, this would be possible if the GDB server would support the asynchronous or non-stop mode. However, the GDB servers I’m using (P&E, Segger and OpenOCD) do not support this today (e.g. in Kinetis Design Studio v3.0.0) :-(.
But there is way to do something very similar. Still intrusive as it needs to stop the target, but at least I do not have to do this manually.
Approach for Periodic Update
The approach I’m presenting here is the following:
- I have a breakpoint set in the code which will be triggered on a periodic base (e.g. in a task or in a timer interrupt). That breakpoint will halt the target.
- The GDB debugger will write the variable/expression/memory value to the console.
- The target gets automatically resumed by the debugger and continues execution
- After a time period, it will run again into the breakpoint and continue with step 2 above.
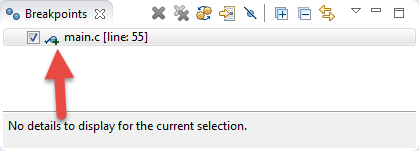
I set a breakpoint in a periodic task, interrupt service routine, etc. Whenever the application hits that breakpoint, the gdb debugger will take control and I can dump my variable(s). For example I set such a breakpoint in a task (or timer interrupt) which will cause a hit every second:
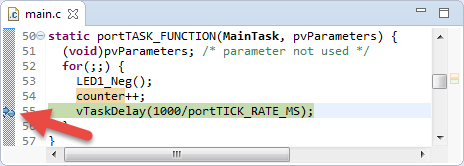
Breakpoint to be hit every second
Breakpoint with Custom Action
From the breakpoint view, I access the breakpoint properties:
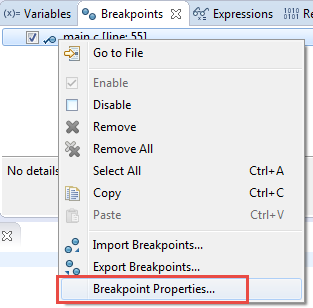
Breakpoint Properties
Here I can create my breakpoint actions with the ‘New’ button:
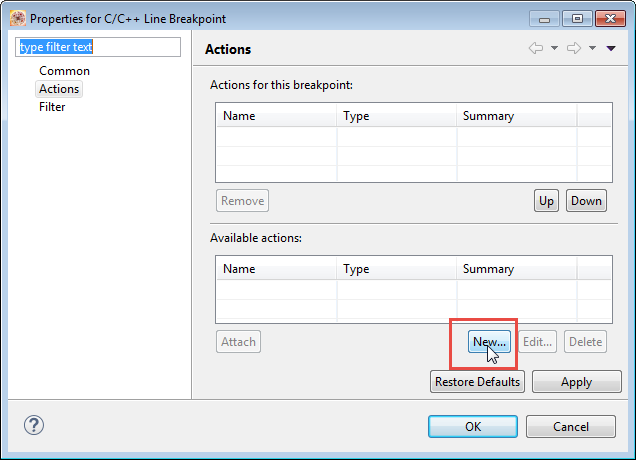
Creating New Breakpoint Action
In the ‘New’ dialog, I can create a ‘Resume Action’ with a delay of zero seconds:

New Resume Action
Now I attach this resume action to my breakpoint:

Attaching Action to Breakpoint
Now I have a breakpoint which will automatically resume: it will stop, then automatically continue execution:
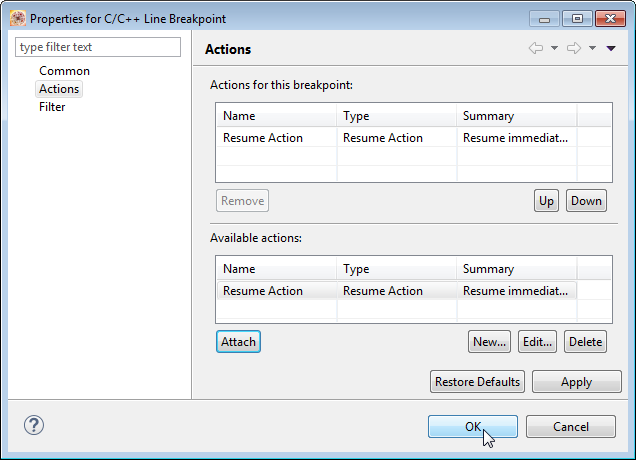
Breakpoint with Resume Action
Press OK to close the dialog.
The breakpoint has now an added ‘+’ to indicate there is an action behind it:
Breakpoint with Action
GDB Automatic Display
Switch to the gdb (arm-none-eabi) console (use the small triangle menu) and pin that console, so it does not switch to another console:
💡 Really make sure you select the gdb (arm-none-eabi-gdb) console to type in the commands.
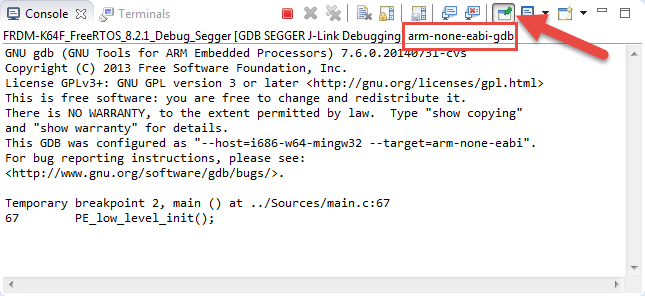
arm-none-eabi-gdb Console
GDB has a cool feature called ‘automatic display‘: that way I can print the value of an expression (to see how it changes) when GDB stops. With
display <variable name>
it adds that variable to the list of auto-displays:

Displaying with gdb
💡 See https://sourceware.org/gdb/onlinedocs/gdb/Output-Formats.html#Output-Formats how to use different formats. E.g. display/x counter displays the variable in hexadecimal format.
With this setup, I can run my target: the breakpoint will be hit, the debugger stops and it will print my variable(s):
periodic auto-display output
I do not have to stop the debugger for this: all will be done as a side effect of the breakpoint :-).
I can use the display command as well to show expressions, like showing the task ready list of FreeRTOS:
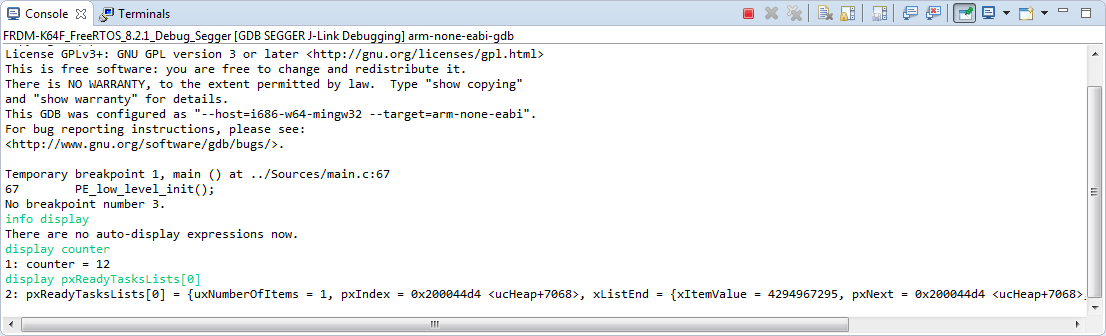
Display of Task Ready List
I can as well show memory locations, e.g. to show the current SysTick counter value with
display *((int*)0xE000E018)
Summary
Having the ability to watch and variables or memory locations while the target is running is very useful. The approach presented here is stopping the target in the background, so it *is* intrusive. But this approach works very well for low frequencies. It does not need any special software library or hardware, it works with plain GDB and Eclipse. Other approaches I’m using are using FreeMaster or tracing data with FreeRTOS+Trace.
Happy Updating 🙂
Links
- CodeWarrior Live View: https://mcuoneclipse.com/2013/01/27/live-view-for-variables-and-memory/
- Differences between CodeWarrior and Kinetis Design Studio: https://mcuoneclipse.com/2014/09/28/comparing-codewarrior-with-kinetis-design-studio/
- GDB non-stop mode: https://sourceware.org/gdb/onlinedocs/gdb/Non_002dStop-Mode.html
- Automatic Display with GDB: https://sourceware.org/gdb/onlinedocs/gdb/Auto-Display.html
- Tutorial using FreeMaster: https://mcuoneclipse.com/2013/08/24/tutorial-freemaster-visualization-and-run-time-debugging/

Tell us more about Freemaster. I’ve used it, but it seems like a totally ignored product.
LikeLike
HI Dave,
yes, i absolutely agree!
I wrote a tutorial here, a while back: https://mcuoneclipse.com/2013/08/24/tutorial-freemaster-visualization-and-run-time-debugging/
I should probably consider to write a follow-up, as with the latest tool chains things have changed a little.
LikeLike
Erich,
You can use dynamic printf for similar purpose if you have console (printf) support in target application. It is a lot more easier to setup.
https://wiki.eclipse.org/CDT/User/NewIn84#Dynamic-printf
Teo
LikeLike
Hi Teo,
interesting feature, I was not aware of this one :-). I see that it requires CDT 7.7, but I’m still on 7.6. No surprise that it did not had any effect when I tried it with 7.6. Still wondering how it works internally. Do you need semihosting enabled? Because usually embedded applications do not have printf implemented, so this might add a lot of overhead.
LikeLike
Indeed, this comes with the cost of printf overhead.
GDB, internally when breakpoint is hit, will perform a method call to “printf” with required arguments. Now it is up to how application is compiled: with semihosting enabled, output will be rooted to debugger; with UART based stdout libraries, the output will go to target serial.
Teo
LikeLike
Hi Teo,
I tried that feature (dynamic-printf) with semihosting and GDB 7.8. Semihosting does work fine, but nothing was printed :-(. Any idea?
LikeLike
This is Really a usefull feature!
LikeLike
Thanks so much for the help, I forgot in which post I asked about this. It has been of great help!
LikeLike
Hi Erik,
Thanks for this post. That will be really helpfuI for my so I just tried your approach.I got some different result as noted in your blog:
+ When gdb hits the breakpoint the Console prints a lot of data
+ It reads the variable but does not give the name for it. For example it looks like:
011,959 479-data-read-memory 1074507792 x 1 1 4
011,973 479^done,addr=”0x400bb010″,nr-bytes=”4″,total-bytes=”4″,next-row=”0x400bb014″,prev-row=”0x40\
0bb00c”,next-page=”0x400bb014″,prev-page=”0x400bb00c”,memory=[{addr=”0x400bb010″,data=[“0xff”,”0x00″\
,”0x00″,”0x00″]}]
I guess there are some gdb settings wrong in my case. I’m using KDS 3.0.1 with all updates available.
Best Regards
Markus
LikeLike
Hi Markus,
if you do a ‘info display’ in the GDB console, does it list the variable properly?
And just asking the obvious: I assume you are doing this for global (not local/stack) variables, right?
Erich
LikeLike
Hi Erik,
I did a mistakes. I had the wrong console. The gdb trace was the one I had and that is far two much detailed.
Best Regards
Markus
LikeLike
Working great thanks! Maybe you can add in your post that you can change the variable display type with:
display/x variable
Also, to select the good console, you must click on the screen icon located to the right of the pin console button and select the arm gdb one. The pegdbserver was display by default for me and I was tipping in the console without result.
Thanks again!
William
LikeLike
Hi William,
many thanks for the suggestions! I have updated the post, thank you!
LikeLike
The only consoles I have are “Processor Expert,” “CDT Global Build Console” and “CDT Build Console.” That’s under “display selected console.” There’s also “open console” which has “CVS” and “C/C++ Build Console.” Help!
Thanks
LikeLike
Hi Chris,
to get the GDB console in there, you have to debug with GDB first.
Erich
LikeLike