What I love with Eclipse: it has lots of small and useful features, either built-in or available as plug-in. Recently I started to use a feature which is present in Eclipse for some time: the ability to save screen real estate during debugging with the ‘breadcrumb’ view option:

Expanded Breadcrumb View
Limited Screen Real Estate
My working machine is a notebook, and naturally that screen size is limited. While I have a second monitor available on my desk, I still do a lot of hardware debugging while travelling, and then I’m limited to the notebook display alone. Usually I use this Debug view layout, with all the stack frames shown in a tree mode:
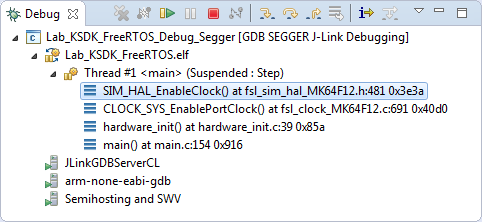
Default Debug Tree View
That view is ok, but needs some space inside the debug perspective. Yes, I can hide that view, but I rather prefer to see the thread or context I’m debugging in.
Breadcrumb Debug View Layout
What I discovered recently is a nice ‘breadcrumb’ option in the debug view. To select ‘breadcrumbs’, use the ‘small triangle’ menu in the Debug view and select Layout > Breadcrumb:
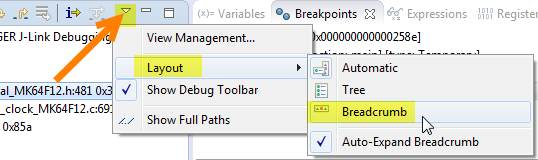
Switching to Breadcrumb debug view
With this, the Debug view is minimized to a single line. Instead of a tree view, it shows all the important things on a single line, along with the information of the current thread/context:

Breadcrumb Debug Mode
The cool thing is that the full call stack/chain is only one mouse click away:
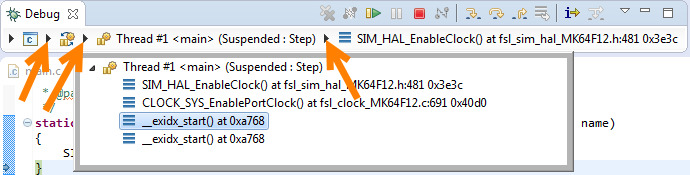
Expanding Breadcrumb View Details
Clicking on the small triangles unfold that corresponding information. With this, I have the most important information always visible, and can click on the triangle and get all the information and functionality as for the normal tree view.
Summary
The ‘breadcrumb’ debug view option is a way to reduce the amount of screen real estate during debugging, and still having the most important information visible and accessible. This is especially useful debugging with small notebook displays.
Happy Breadcrumbing 🙂
PS: Happy Mother’s Day to all the mothers of the world 😉
