
I have continued to explore my two hobbies (embedded systems, and Talking About The Weather) during these weeks of lock-down. I have finally got to the point that my Weather Station project can sit on the window shelf of my office, and show me the temperature, humidity and atmospheric pressure on the attached eInk display.

In this blog I’m going to focus on driving that display.
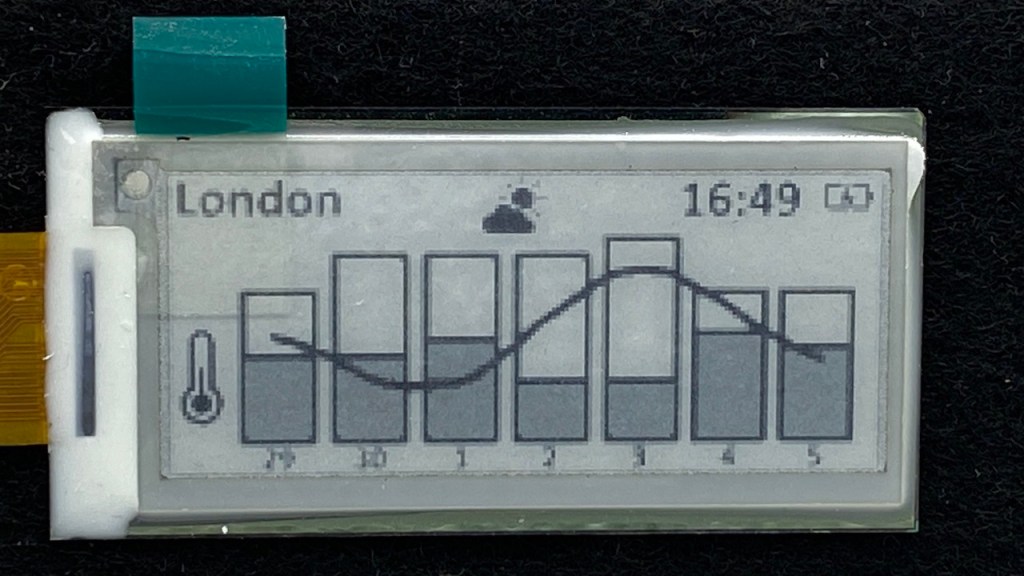
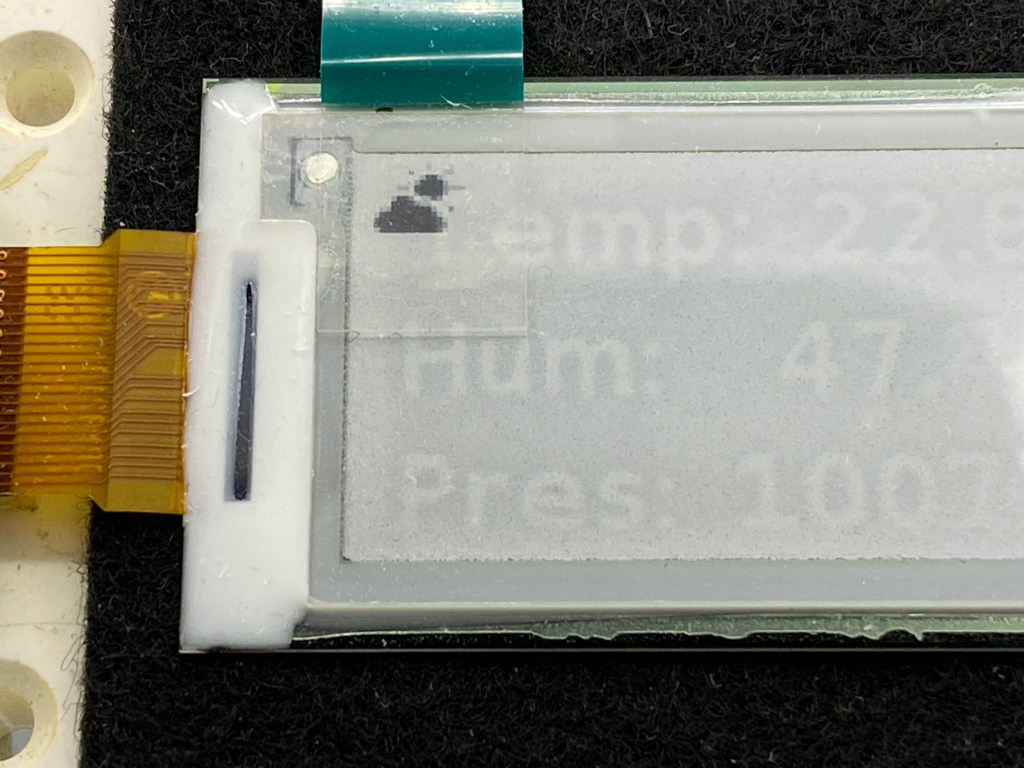
I selected the MikroElekronika eInk Click board (MIKROE-2659) as the display for this project. Originally I was attracted to the ‘display retention’ capability of the display: I had intended to power-off the display and set the NXP LPC55S69 into a low power mode between 1 minute samples of the Bosch BME280 environmental sensor. I have not implemented low power features in the weather station, but the display remains an attractive way to present the data. My project started on the NXP LPC55S69-EVK and this board has a Mikroe connector, so that I was able to plug the eInk Click board directly into the EVK. When I transitioned to to OKdo E1 board after prototyping the software I transitioned to the “breadboard” setup that you see in the photographs.
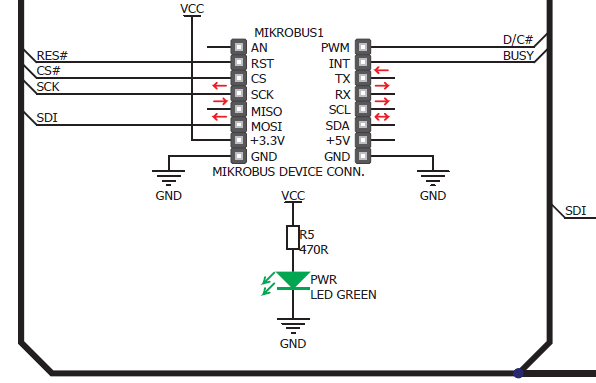
The interface between the OKdo E1 board and the eInk Click board is very simple: it is a SPI connection (with no MISO signal coming back from the eInk board), a BUSY signal and a Data/Command D/~C signal. I used the MCUXpresso SDK SPI driver (using FLEXCOMM8, High-Speed SPI) and two GPIO signals for the control signals. This eInk display takes about one second to transfer the image from its display RAM to the panel, and it sets the BUSY signal high during this transfer. The display IC will not accept any new commands or data during this time. And, common with all SPI-based displays that I’ve used, a control line “Data/Command D/~C” is set or cleared by the host microcontroller and signals if the current SPI word is a command word, or data.
Writes to the eInk display used the MCUXpresso SDK SPI-driver function SPI_MasterTransferBlocking(). The display comprises 72 x 172 pixels, and each pixel is capable of displaying one of 4 greyscale colours: WHITE (0b11), GREY2 (0b10), GREY1 (0b01) or BLACK (0b00). So there are 12,384 pixels, and if we store the colour of 4 pixels in a byte, that means that we transfer 3096 bytes of data per screen refresh (plus 5 bytes of control words before the block (setting the RAM X address count back to zero, and RAM Y address count back to 171) and 4 bytes after the data transfer). All the technical details are in the datasheet epa20-ae.pdf published by MikroElektronika. I’m using the screen in “landscape” mode. The pixel in the top lefthand corner is pixel [0,171]. Columns decrement to 0 as we transition to the right of the screen, and rows increment to 71 as we transition down the screen, meaning that the pixel in the bottom right-hand corner is [71,0]. This solves the greatest mystery when using the panel.
Take the example of the ‘Cloud‘ symbol in the top centre of the weather station’s ‘History‘ screen. This is just a bitmap that is written into a screen buffer inside the LPC55S69 before the assembled screen is transferred to the display.
The History screen is assembled from various parts:
- fonts (strictly, glyphs) that are taken from the LittleVGL graphics library in the MCUXpresso SDK (see the littlevgl_demo example project);
- symbols (the ‘Battery Charging’ symbol is from LittleVGL, whilst the Temperature and Cloud symbols are bitmaps that I created;
- finally the boxes and lines that illustrate the max/min temperature and atmospheric pressure trend of the the last 7 days are simply drawn directly to the screen.
For the bitmap to be displayed in the correct orientation it is necessary to do some manipulation. Here are my steps.
1) Design the bitmap
I always mock up any screen in Microsoft Powerpoint before starting the embedded work. This allows me to see how the screen may appear, and easily move items around. Another advantage of Powerpoint is that it has an Icon library, and so I was able to select the Temperature and Weather icons for the screen. This is the screen in Powerpoint…
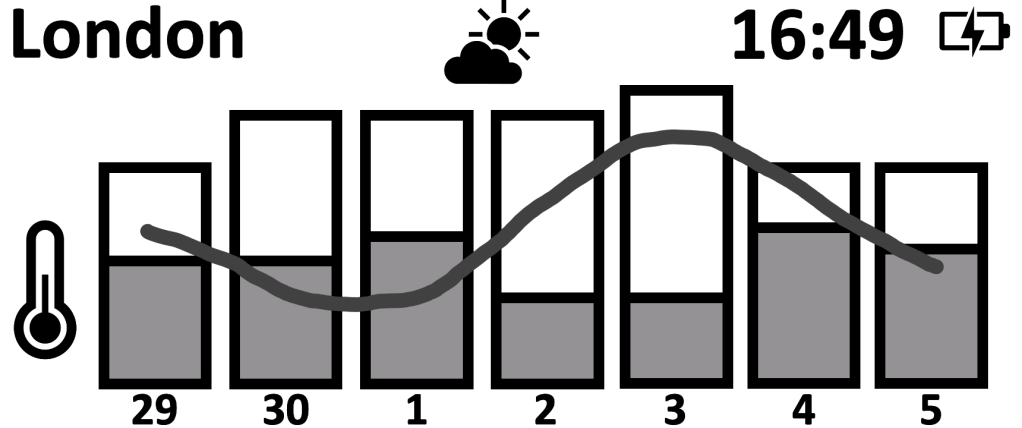
2) Export the Temperature and Weather symbols, and resize
Powerpoint supports exporting the slide in a variety of formats – I used a bitmap format and then cropped the output so that I just had the Weather symbol. There are many tools that can be used to resize the bitmap and reduce it to 4 colour greyscale (I used GIMP). Earlier on I mentioned that we will store 4 vertical pixels in a byte, and so I resized the symbol to be 20 pixels wide, and 16 pixels high.


It is not vey helpful for me to display the 20×16 pixel image (it is tiny) and so I’ve stretched it in the picture above. Here on my laptop it is about 1kbytes in size, 20×16 pixels and 2-bit greyscale colour (white, two greys and black).
3) Transformation
The bitmap is stored as an array of rows, each row being 20 pixels wide, and there are 16 rows. However, when we write to the screen, we must write the data in columns. The elegant solution is to flip the bitmap about its diagonal axis: the pixel in the top left-hand corner remains in the same place, the pixel in the top right-hand corner becomes the pixel in the bottom left-hand corner, and so on. It’s easiest to think about rotating the image 90 degrees clockwise, and then mirroring it about the vertical axis, like this:

If you look carefully at the ‘before’ and ‘after’ image you can see that when we write the first _row_ from the rotated bitmap to a column on the eInk screen, we’ll display a white column of 16 pixels. The next row will generate another column of 16 white pixels, and the third row from the bitmap will write the edge of the cloud into a column on the eInk screen. As we read from rows from the bitmap and write columns on the screen, we end up displaying the weather symbol as intended.
4) Convert to character array
There are a number of bitmap-to-array converters available online. Here’s one. Ultimately we end up with a structure that looks like this:
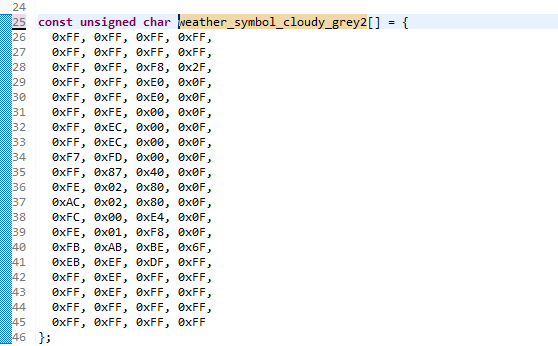
Without being too geeky, we can read the first two rows of the array (lines 26 and 27) and observe that theses are 4 bytes of 0xFF. With white being encoded as 0b11, we can see that there are two rows of 16 pixels of colour white. The first pixel in the edge of the cloud is encoded 0b10 (from the ‘8’ in 0xF8, line 28) being light grey (GREY2).
5) Display on screen
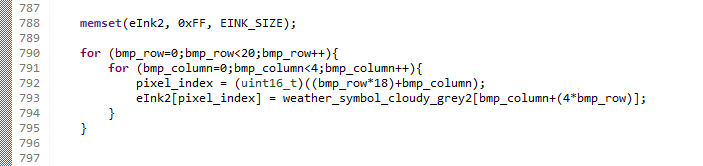
I wrote a little test program to display the weather symbol on the eInk screen. It is as simple as reading each row from the array weather_symbol_cloudy_grey2[] and writing it into the screen buffer inside the LPC55S69. The screen buffer is simply a byte array of 3096 bytes, starting from the top left pixel, running down the screen to the bottom left pixel, then back to the second column, etc. When we copy the weather symbol to the screen buffer, we need to add the row offset (18 bytes) each time. Since there are 72 pixels in each column, this equates to 18 bytes. The copy routine is simply this:
As always, there is a short video hosted on my embeddedpro YouTube channel that shows the weather station is action. And it is embedded here:
Interfacing the eInk CLick board to the OKdo E1 board was straightforward. It has a simple physical interface and I was able to use the MCUXpresso SDK SPI driver and Pins Config tool to set up the SPI and GPIO pins. MikroElektronika provide sufficient information in their documentation to use the display, paying attention to the lookup table (LUT) and necessary commands to write to the RAM inside the display controller. Thereafter it was a matter of trial-and-error to get the correct sequence for writing the bitmaps. I was able to leverage the LitteVGL font support from the lpcxpresso55s69 SDK to write a variety of fonts and symbols (the font and symbol tables are just indexed bitmaps) and I greatly enjoyed developing this weather station project.
I trust that I have given you some suggestions and ideas about how you can get started with your own NXP LPC5S69 / OKdo E1 projects. Let me know how you get on in the comments to this (and earlier) blogs.
Links
- https://www.okdo.com
- Development board used: https://www.okdo.com/p/okdo-e1-development-board/

Thanks for posting this nice project for the LPC55S69. Is the MCUexpresso project/source available?
Thank you.
LikeLike
Hi Barry,
Mark needs to comment/answer, but I believe the project has not been published.
Erich
LikeLike