Percepio has released a new V2.2.2 library of FreeRTOS+Trace (see Tracing with FreeRTOS+Trace from Percepio). The new release comes with many improvements. The trace recording is optimized for more efficient recording and longer trace with the same amount of memory.
Note: Because the trace data structure is changed and optimized, I need the latest tool on the PC/host from http://www.percepio.com.
I have updated the Percepio Processor Expert component to generate and use the new trace library V2.2.2. This includes the new settings in the component properties as shown below:
It is now possible to select either static or dynamic trace buffer allocation: for this, the trace library is using a pointer (instead of a struct) to access the trace data. With using dynamic allocation, the xTraceInitTraceData() has to be called from the application to allocate the trace buffer using the FreeRTOS memory allocation routine.
For licensing, it is possible to specify a group license string (string in double quotes).
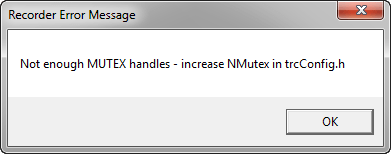
One major improvement is error reporting. Now there the trace data buffer has a string (Description String) plus space for an error message. As such, you can specify a string length for this (default 80 characters). With this, if I open the trace data on the host, I get a problem report like this one:
That’s really useful and helps a lot to solve these kind of problems during run-time of trace collection.
New is that trcPort.h defines a macro IRQ_PRIORITY_ORDER which describes if lower priorities mean higher priority (or not). S08 and S12 have this set to 0, while ColdFire is using a value of 1 for this (a higher IRQ value means it is more significant).
Worth noting are following two changes:
- No need to choose between OS Ticks or Hardware Counter timer type: The OS ticks variant anyway was kind of useless. Now only hardware counter is used.
- vTraceShowEventStats() has been removed. Instead, the viewer on the host provides a similar functionality (at least in the next release 2.2.3).
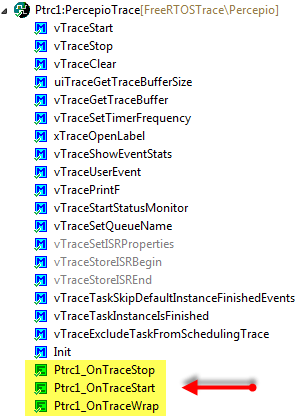
In addition, the Processor Expert component offers three events:
The events are called when the trace starts, stops or the trace buffer performs a wrap (in Ring Buffer mode). I use the events as an easy way for the debugger to stop and to dump the trace data to the host.
The updated Processor Expert component is available here.
Happy Tracing 🙂


Pingback: There is an ARM to Trace | MCU on Eclipse
Pingback: A new Freedom Board: FRDM-KL46Z | MCU on Eclipse
Pingback: FreeRTOS V8.0.0 Final Release available as Processor Expert Component | MCU on Eclipse