
The previous parts were about installation, project setup and building. This one is about debugging an ARM Cortex-M Microcontroller with Visual Studio Code:
Outline
In this article I show how to debug an ARM Cortex (M4F, NXP K22FN512) microcontroller with the Microsoft Visual Studio Code. For this I need the tools and extensions installed in Part 1 of this tutorial series. Debugging is through a debug probe (J-Link), either external (standalone debug probe) or on-board (available with many development boards e.g. from NXP or STM). I’m using SWD here because the FRDM-K22F only has SWD available on the debug header, but JTAG could be used too.
Debug Probe
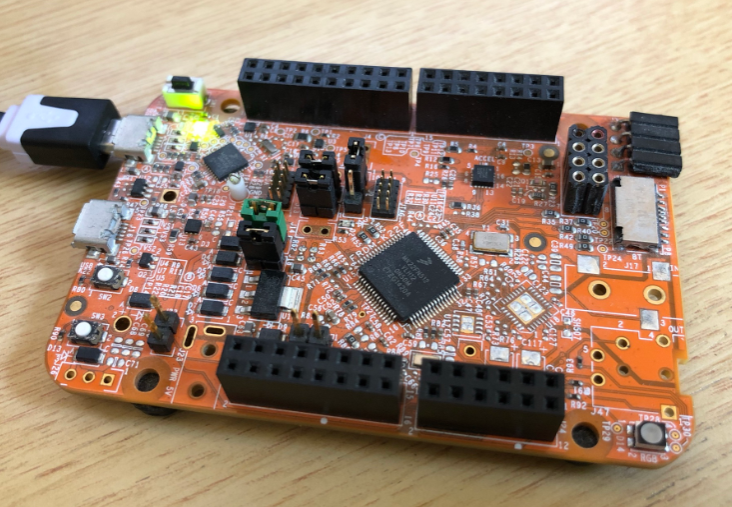
In this article I’m using a SEGGER J-Link EDU Mini debug probe. Technically it should be possible to use other probes too. The J-Link is widely available and the EDU only costs $20 or €20, is very small and universally works for many, many devices out of the box.
Additionally many silicon vendor boards (LPC4322 or FRDM OpenSDA) and debug probes can load the J-Link firmware, including the NXP LPC-Link2 or STLink. The J-Link can be used with GDB, LLDB, OpenOCD or CMSI-DAP.

Launch JSON File
Inside the .vscode folder, create a new file named launch.json, with the following content:
{
    // Use IntelliSense to learn about possible attributes.
    // Hover to view descriptions of existing attributes.
    // For more information, visit: https://go.microsoft.com/fwlink/?linkid=830387
    "version": "0.2.0",
    "configurations": [
        {
            "cwd": "${workspaceRoot}",
            "executable": "./build/FRDM-K22F_Simple.elf",
            "name": "Debug Microcontroller",
            "request": "launch",
            "type": "cortex-debug",
            "servertype": "jlink",
            "serverpath": "C:/Program Files (x86)/SEGGER/JLink/JLinkGDBServerCL.exe",
            "armToolchainPath": "C:/Program Files (x86)/GNU Arm Embedded Toolchain/10 2020-q4-major/bin",
            "device": "MK22FN512xxx12",
            "interface": "swd",
            "serialNumber": "", // add J-Link serial number if having multiple attached the same time.
            "runToMain": true,
            "svdFile": "${workspaceRoot}/device/MK22F51212.svd",

        }
    ]
}
You can find all files on GitHub too.
The most important settings are:
- “executable“: the binary to load and debug.
- “serverpath“: Path and file name of J-Link GDB Server executable. See Part 1.
- “armToolchainPath“: path to the arm-none-eabi-gdb executable. See Part 1.
- “device“: Device ID used for J-Link, see SEGGER J-Link website.
- “runToMain“: if debugger shall set a temporary breakpoint on main() und run until there.
- “svdFile“: Optional, this is a CMSIS-SVD file for register detail debugging.
SVD Files
The “svdFile” entry in the launch.json file is optional, but crucial to embedded system debugging because it describes the device peripheral registers. They are used for example in the Eclipse EmbSysRegView view and this is a good source to get the files. If using the NXP devices, then the SVD files are present in the NXP MCUXpresso SDK, but are harder to find as NXP is not using the standard *.svd extension.
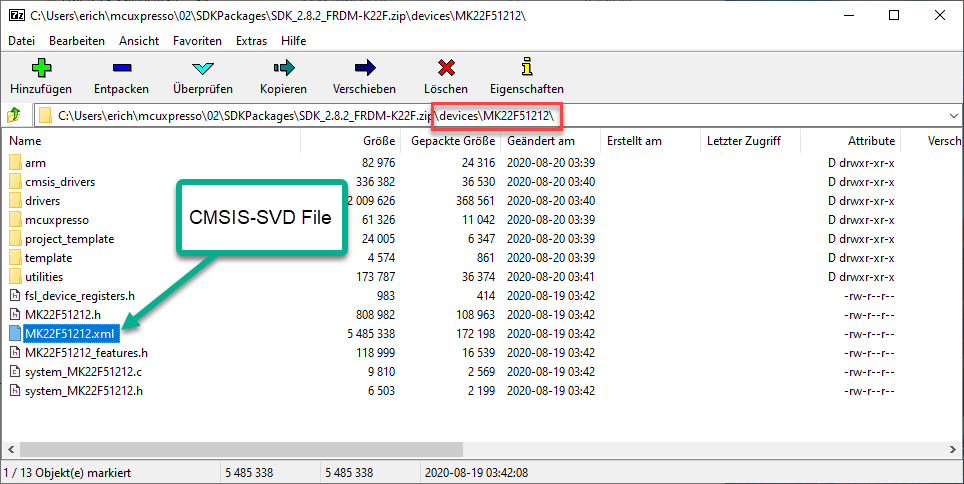
For the launch file the extension does not matter, but I recommend to rename it to .svd for clarity.
Debugging
Use F5 or the menu Run > Start Debugging to start a debug session:

This starts debug session. I case of troubles, check the Debug Console:
Please check OUTPUT tab (Adapter Output) for output from C:/Program Files (x86)/SEGGER/JLink/JLinkGDBServerCL.exe
Launching server: "C:/Program Files (x86)/SEGGER/JLink/JLinkGDBServerCL.exe" "-if" "swd" "-port" "50000" "-swoport" "50001" "-telnetport" "50002" "-device" "MK22FN512xxx12"
Launching GDB: "C:\Program Files (x86)\GNU Arm Embedded Toolchain\10 2020-q4-major\bin\arm-none-eabi-gdb.exe" "-q" "--interpreter=mi2"
undefinedC:\Program Files (x86)\GNU Arm Embedded Toolchain\10 2020-q4-major\bin\arm-none-eabi-gdb.exe: warning: Couldn't determine a path for the index cache directory.
Reading symbols from C:\Users\erich\Data\GitRepos\McuOnEclipse\Examples\VisualStudioCode\FRDM-K22F\FRDM-K22F_Simple\build\FRDM-K22F_Simple.elf...
0x000006b0 in _exit ()
Not implemented stop reason (assuming exception): undefined
Resetting target
Resetting target

Temporary breakpoint 1, main () at ../src/main.c:7
7	    int local = 0;
I have a warning plus a ‘non-imlemented stop reason’ (not sure why), but it works and I’m debugging 🙂

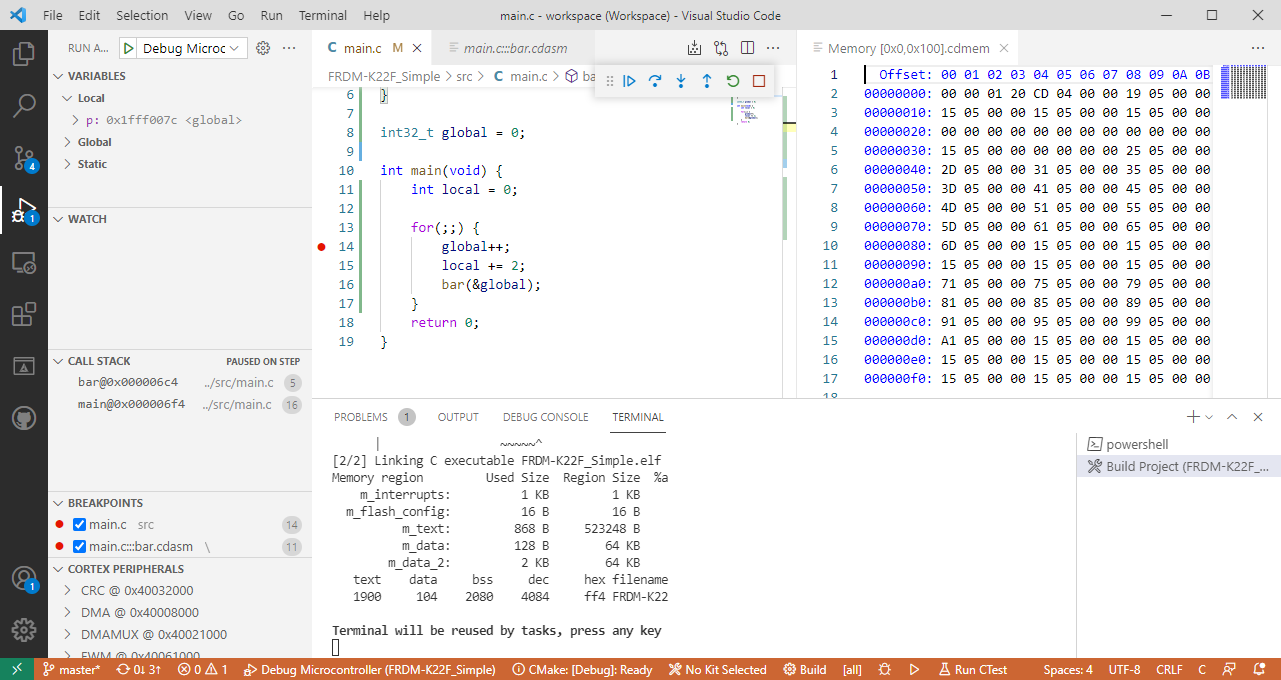
By default there are several debug views available. With the .svd file (see above) I have access to the peripheral register too:

Stepping
There are the usual debug actions (continue, stepping, restart) plus a ‘run and debug’ toolbar on the left:

Assembly Stepping
For the Disassembly view or assembly code stepping use the Command Palette (CTRL+SHIFT+P) with ‘Cortex’:
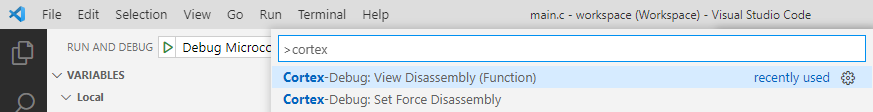
Use ‘View Disassembly (Function’ with the name of a function to debug that function in assembly code. Use ‘Set Force Disassembly’ to switch to disassembly stepping for all functions.

It is possible to set breakpoints in the assembly code, but one cannot see high level (C/C++) side-by-side with the assembly code. And the disassembly view does not show any more information or symbolic a the Eclipse CDT disassembly view does.
Switch back to ‘auto’ only to show disassembly for code without debug/source information:

Memory
To view memory, use the Command Palette (CTRL+SHIFT+P) with Cortex:

Then specify the expression for the memory location and a length:

This then shows the memory:

The memory view is very basic compared to the Eclipse (many) memory views, but for inspecting memory it is better than nothing.
Summary
With this, I hope this gets you up and running (well: debugging) with the Microsoft Visual Studio Code on ARM Cortex-M. The embedded debugging capabilities (memory, registers, assembly) are much more basic compared to the views in Eclipse or MCUXpresso IDE, so for sure not up to that level (yet?). But at least I can do basic hardware debugging on an ARM Cortex with this.
There are for sure many more things to add and improve, but these could be topics for future articles.
Happy Coding 🙂
Links
- Visual Studio Code for C/C++ with ARM Cortex-M: Part 1
- Visual Studio Code for C/C++ with ARM Cortex-M: Part 2
- Visual Studio Code for C/C++ with ARM Cortex-M: Part 3
- Visual Studio Code for C/C++ with ARM Cortex-M: Part 4
- Visual Studio Code for C/C++ with ARM Cortex-M: Part 5
- Visual Studio Code for C/C++ with ARM Cortex-M: Part 6
- Visual Studio Code website: https://code.visualstudio.com/
- Article by Higaski: https://higaski.at/vscode-arm-cortex-m-debugging/
- SEGGER J-Link with VS Code: https://wiki.segger.com/J-Link_Visual_Studio_Code
- Examples on GitHub: https://github.com/ErichStyger/mcuoneclipse/tree/master/Examples/VisualStudioCode

Pingback: Visual Studio Code for C/C++ with ARM Cortex-M: Part 2 | MCU on Eclipse
Thanks Erich – Great stuff as always!
A question though: What specific missing features (as compared to Eclipse) do you think significant?
LikeLiked by 1 person
Hi Dave,
thanks!
>A question though: What specific missing features (as compared to Eclipse) do you think significant?
In terms of debugging? Nothing. It only provides the very basics.
The feature I would mention is IntelliSense (which I really like for Rust, but have not fully configured for C/C++ yet).
To me it is not about a feature. It is that it is ‘modern’ (see other discussion) with a fast and cool looking user interface. I love the extension manager. The other point I would like to mention is that it is very exciting that Liviu is contributing with an extension to VSC (see https://marketplace.visualstudio.com/items?itemName=ilg-vscode.xpack and his comments on this series). His ‘GNU ARM Eclipse’ and ‘GNU MCU Eclipse’ and now ‘Eclipse Embedded CDT’ (https://eclipse-embed-cdt.github.io/) work and contributions are for me one big reason why Eclipse today is so good for embedded system development, beside of other CDT contributions: because his plugins made toolchain configuration (multi-host) and especially debugging very easy. I still need to dive into his VSC work, and I’ll cover that for sure in one of the next article(s).
Erich
LikeLike
Hey Erich,
Nicely done. Honestly, I was expecting more in terms of debug capability – maybe that will come out in time.
What I would take out of this series is that Visual Studio is something to consider when you have to use a part where the vendor has not provided modern or adequate development tools. I thinking of my own work where I have a simple batch of (Java based) tools for testing operations including code and I wonder if Visual Studio would be something to consider going forwards.
I found this series very useful.
LikeLiked by 1 person
Hi myke,
Yes, I was hoping more in terms of embedded debugging capabilities in Visual Studio Code when I started my journey. The very, very basics are there, but mostly because of the work of Marus (https://github.com/Marus/cortex-debug/wiki) and his extension. His plugin supports SWO with data graphing (see https://github.com/Marus/cortex-debug/wiki/SWO-Output) but because many boards do not have SWO routed to the debug header it is not widely available. I plan to try it out with a different board and to come up with an article about it.
RTOS (FreeRTOS) debugging is something else want to look into: this should be supported to some level according to the marus25.cortex-debug extension. And Semihosting is one of the planned features of the extension.
SWO and Semihosting are some ‘nice to have’ for me: much more important to me (and probably everyone else) is FreeRTOS support in the IDE. To me FreeRTOS awareness as in the Eclipse MCUXpresso IDE are the key factor which vendor to use for a project, as about 98% of my current research projects for micro controllers are using FreeRTOS as kernel.
>>What I would take out of this series is that Visual Studio is something to consider when you have to use a part where the vendor has not provided modern or adequate development tools.
I agree with that. Visual Studio is currently no real replacement for the real embedded development tools. It is really interesting to play with Visual Studio Code for ARM Cortex-M, but probably not (yet) for a production level development. I hope this will change over time with more and more requesting Microsoft to move into that space. I think the key word here is ‘modern’: this is what Microsoft brings to the table.
LikeLiked by 1 person
Hi Erich
Thanks for this posts about vscode. I do almost all of my coding in vscode nowadays that means embedded C and also Python and Go. I also hope vscode will gain more features in the embedded space, although I can easily live with the current state as I do the debugging part mostly in Ozone. And I got used to have vscode as IDE, which is great (in my opinion even superior to eclipse, as e.g. Intellisense works perfectly for me, easier to update, better extensions, no java ;), ….) and Ozone as standalone debugger which also does a good job.
In general vscode feels much snappier and less bloated than eclipse but still has tons of feature, which I really like about it…
LikeLiked by 1 person
Hi Martin,
yes, VSC feels snappier to me too. That might change over time maybe if it gets more and more extensions added (I saw that with Eclipse: it was pretty good at the start and then I feel it got dragged down with all the plugins installed). But running native code than Java makes a difference too, even with JITC.
Having an external debugger like Ozone sure makes sense until VSC gets more mature for embedded development. Like Ozone one can easily use Eclipse as the ‘debugger’ too: with this VSC excels in the domain where it is really good today: as an editor. I think it might take time until VSC could catch up on these aspects, and we have to see.
LikeLike
Pingback: Visual Studio Code for C/C++ with ARM Cortex-M: Part 3 | MCU on Eclipse
Pingback: Visual Studio Code for C/C++ with ARM Cortex-M: Part 1 | MCU on Eclipse
Pingback: Visual Studio Code for C/C++ with ARM Cortex-M: Part 5 | MCU on Eclipse
Pingback: Visual Studio Code for C/C++ with ARM Cortex-M: Part 6 | MCU on Eclipse
Pingback: Visual Studio Code for C/C++ with ARM Cortex-M: Part 7 – FreeRTOS | MCU on Eclipse
Hey Erich!
Thanks for these posts. They are very useful and I was looking for them for a while!
I did all the steps, but when I run it, I get the error below, do you know what can be the reason for that?
“Reading symbols from /home/repos/e2/build/Debug/apps/e2.elf…
done.
0xfffffffe in ?? ()
Not implemented stop reason (assuming exception): undefined
2
Resetting target
Program
received signal SIGTRAP, Trace/breakpoint trap.
0xfffffffe in ?? ()”
LikeLiked by 1 person
Hi Vinicus,
what target is it? It looks like it is not able to really load the symbols. Are you sure you have specified -ggdb and did not remove the symbolics from your ELF file. Other than that, check your ELF file with readelf if everything makes sense. Other than that: use gdb directly in command line mode to load the file to be sure everything is ok, see for example https://mcuoneclipse.com/2015/03/25/command-line-programming-and-debugging-with-gdb/
LikeLike
Hi,
Dear Erich the article was excellent .Really VSC shines in terms of
speed and functionality and your article has made clear how things work .
Your article raised some questions related to usual IDE i operate
How are custom build switches handled (debug-release-….) ?.
Can somebody view-edit the project structure in a gui way ?
In MARUS-debugger can we watch live global variables with adjustable time window
without SWO .
Thanks again for all the information you are providing .
LikeLiked by 1 person
Hi Michael,
thank you!
a( Custom build switches: you can do this with targets in Cmake. Or you might have a look at Livius work (https://marketplace.visualstudio.com/items?itemName=ilg-vscode.xpack and https://github.com/xpack/hello-world-template-xpack) which for example handles Release and Debug in a seamless way.
b) Project structure: not sure what you want here, but on the left side/explorer panel you have the structure of the project?
c) This would require gdb to run in non-stop mode, I don’t believe this is currently supported with that extension
I hope this helps,
Erich
LikeLike
Pingback: Visual Studio Code for C/C++ with ARM Cortex-M: Part 8 – xPack C/C++ Managed Build Tools | MCU on Eclipse
Pingback: Visual Studio Code for C/C++ with ARM Cortex-M: Part 9 – RTT | MCU on Eclipse
Hi Erich,
Thanks a lot for this inspiring article!
There’s one question left to me, it concerns the single step debugging in VSCode together with the Cortex-Debug extension. Is it possible to perform single step debugging in the (Assembler) startup code before main() has been reached?
E.g for the STM32L476 MCU this is in startup_stm32l476xx.s.
So far I didn’t find a way or any documentation how to do this.
Cheers, Hubert
LikeLiked by 1 person
Hi Hubert, yes, let me look into it.
LikeLike
Hi Eric,
I think in the meantime I can answer my own question.
Bottom line the problem occured because VSCode by default simply refuses to set breakpoints in files like *.s, *.asm, *.txt, …
To enable this, go to VSCode: File: Preferences: Debug and set the checkbox for “Allow breakpoints everywhere”. Then it is possible to set a breakpoint as usual by mouseclick.
Another alternative is to manually add a breakpoint in the debugger “BREAKPOINT” area. For assembler code you can type in a label instead of a function. Label+number (e.g. MyLabel+2) sets the breakpoint at the second line after the label. Without having set the “Allow breakpoints everywhere” checkbox, the breakpoint works but will not be shown in the editor by the red dot.
Cheers, Hubert
LikeLiked by 1 person
Sorry, Erich ..
LikeLike
That’s great, I did not find the time to try it out, will do hopefully over the week-end. Thanks for reporting back!
LikeLike
Hi Hubert,
Assembly source files work for me, setting breakpoints. I think your issue is that your assembly files are *.s instead of the standard *.S (yes, sounds silly on Windows, but there is a difference, see as well https://mcuoneclipse.com/2016/05/05/assembly-files-in-eclipse-cdt-projects/ for the case of Eclipse.
LikeLike
Hi Erich,
thanks a lot for this hint!
LikeLiked by 1 person
Pingback: New “MCU-Link Pro”: Debug Probe with Energy Measurement | MCU on Eclipse
Pingback: Visual Studio Code for C/C++ with ARM Cortex-M: Part 10 – Assembly Stepping | MCU on Eclipse
Hi Erich,
in Eclipse there is something called “Dynamic Printfs”, which can sometimes be useful when debugging. Visual studio code has something similar called “log points”. Have you come across this/know more about it?
https://code.visualstudio.com/docs/editor/debugging#_logpoints
For me the log points are working fine in a normal C project using gdb, but using it when cross debugging doesn’t work, instead they are treated like normal breakpoints.
Have you any idea which plugin would need to support this feature? Is it the Cortex-Debug plugin?
LikeLiked by 1 person
Hi Johann,
I tried the dynamic printf feature a while back (https://mcuoneclipse.com/2015/07/14/automatic-variable-expression-and-memory-display-with-gdb-and-eclipse/), but never was not able to get it to work, I think I might have to retry it.
LikeLike
Hi Johann,
to my understanding it would require special hardware support (dynamic code insertion), so this might not be easily achievable for an embedded target.
LikeLike
Some time ago when I tried, the Eclipse feature – was at least for me – working when using a Segger JLink for debugging a application on a STM32F4.
If I understand it rigth “dynamic printfs” weren’t part of eclipse when you tried? And you more or less did it manually?
https://www.eclipse.org/community/eclipse_newsletter/2017/april/article2.php
But anyway thanks for your reply/information! If I find out anything useful regarding log points i will let you know.
LikeLiked by 1 person
Hi Johann,
I just tried with a recent version of Eclipse and used the dynamic printf in my code. I do have semihosting libraries and enabled them, but I’m not getting any output from it. I guess the plugin needs to change the code in the backend, and it does not do it for an embedded target like the J-Link debug connection. So to me that feature sounds great, but is not working for embedded targets, even with the latest Eclipse and J-Link?
LikeLike
Hi Erich, thanks again for this series of articles, they are very helpful. I’m looking for a Cortex-M4 development board but the NXP FRDM-K22F Board that you mentioned here is on a long lead-time. Do you use any other Cortex-M4 boards?
LikeLiked by 1 person
Hi David,
glad you like that series! About the FRDM-K22F: at least mouser.com seems to get some very soon ( 113 Expected 14/02/2022 ), if this can be trusted. I’m using the FRDM-K64F too, but this one does not even seem to have delivery date. Other than tat, you might consider the LPC55S69 or LPC55S16 EVK: I do use them too, they are (at least right now) on stock, but they are Cortex-M33.
LikeLike
Hi Erich, thanks for your help.
LikeLiked by 1 person
Hi Eric,
Can one use VS Code for simulating ARM Cortex-M?
I mean simulating just the algorithm, not peripheral.
Thank you very much!
LikeLiked by 1 person
Hi Amir,
I have not used QEMU with VSC (yet?), but It hink that would work: https://www.qemu.org/
LikeLike
Hi Erich,
Many thanks. I use an old LPC device ARM7 with semihosting to telnet using JLink JTAG. I was wondering how I can manage to create an additional terminal window in VScode after the GDB server has started.
LikeLike
Hi Henk,
the Segger J-Link GDB Server only allows a single telnet session to it. If you need multiple channels, then you have to use RTT.
LikeLike