
Having visibility and insights into a running system is highly valuable or critical: not only for optimizations but as well to verify the system design and behavior. In Getting Started with Microsoft Azure RTOS (aka ThreadX) I showed how to quickly run Azure RTOS. This article is about getting trace out of an ThreadX application and show it in TraceX.
Azure RTOS TraceX
Outline
In this article I show how to extract trace information out of Microsoft Azure RTOS (known as ThreadX) and showing the data in the TraceX tool. If you are familiar with FreeRTOS: this is the same concept as using Percepio Tracealyzer or Segger SystemView.
For this article I assume you have ThreadX working as outlined in my previous article. I’m using the NXP MCUXpresso IDE 10.2.1 with the SDK_2.x_EVK-MIMXRT1064 2.8.5 on a i.MX RT1064-EVK board.
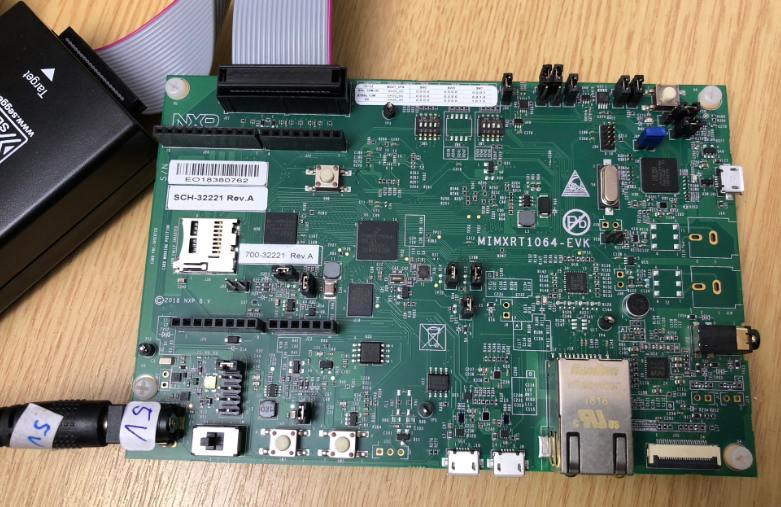
MIMXRT1064-EVK running ThreadX
To get RTOS trace out of the application we need to configure and instrument the RTOS, then export the collected date and load it in the TraceX application to visualize it.
You can find the Eclipse projects used in this article on the McuOnEclipse GitHub.
TraceX Installation
To inspect the trace data the TraceX viewer is needed. The installer (Windows) for TraceX is available as a link from https://docs.microsoft.com/en-us/azure/rtos/tracex/chapter2

TraceX Installer
Run the installer, and it installs the necessary .NET libraries.
Start TraceX, and I can start using it with demo files.

TraceX Demo File
ThreadX Application Project
The first thing to notice is that the application project uses a static library of the RTOS:
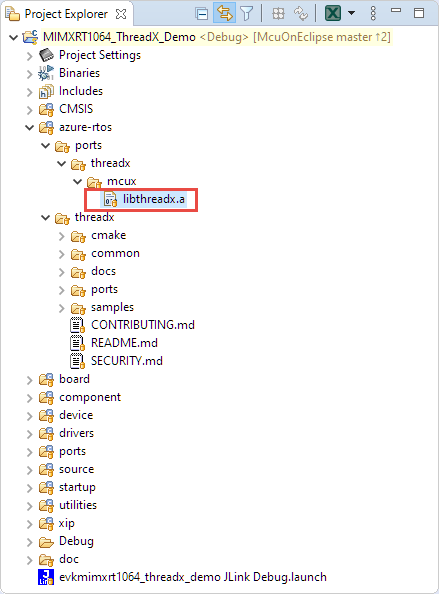
ThreadX Library
This is different from the approach used by other (small) RTOS vendors where the RTOS sources are built and linked with the application.
In order to be able to generate data for TraceX, the RTOS has to be configured with the TX_ENABLE_EVENT_TRACE define. So this means that library has to be built with that option.
Building ThreadX RTOS Library
The ThreadX RTOS library is a separate project in the MCUXpresso SDK.
Import it as SDK example in the IDE:
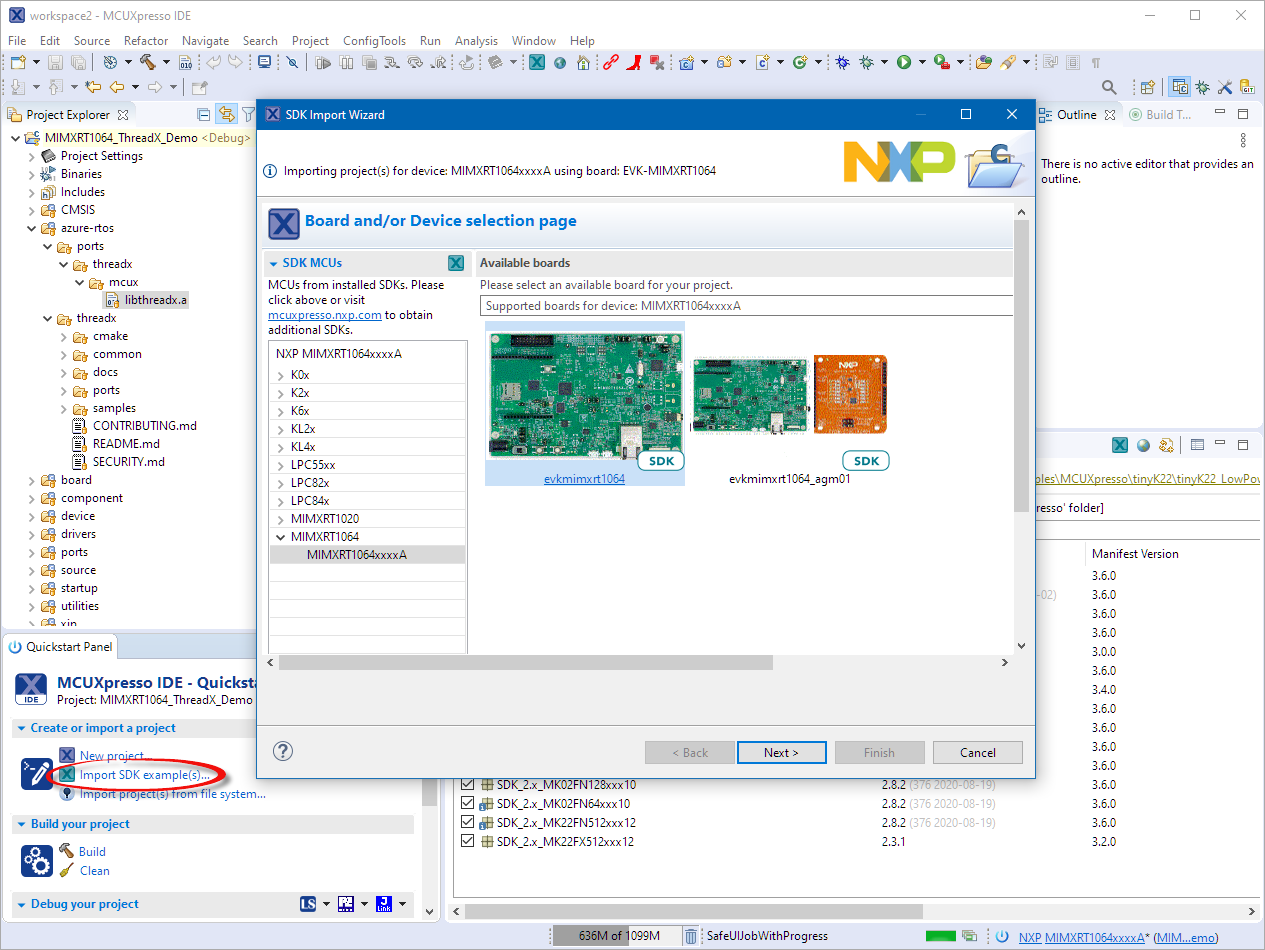
Import SDK Example
Select the threadx_lib and press Finish:
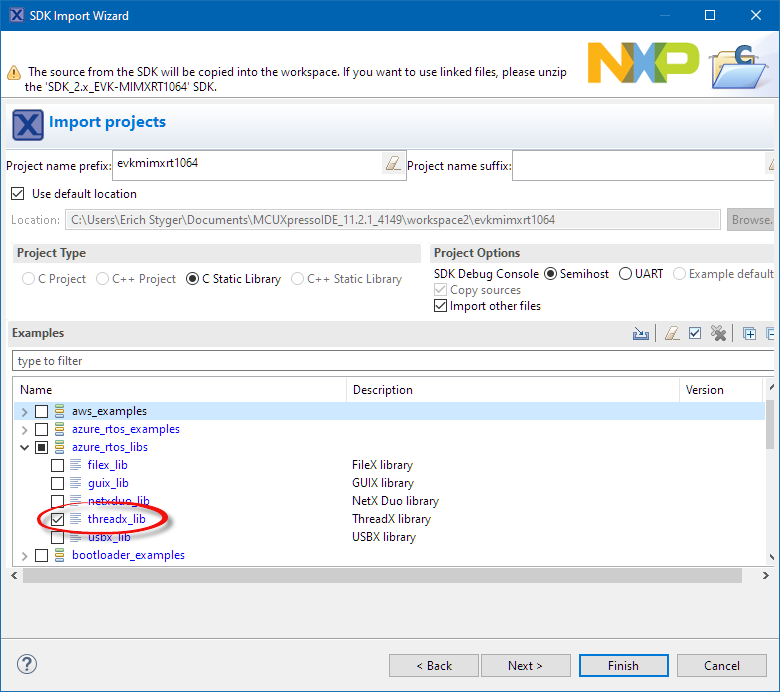
threadx_lib
This imports the ThreadX Library project into the workspace:
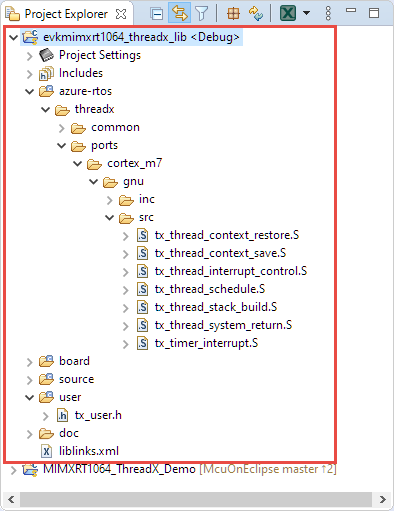
ThreadX Library Project
Make sure that Parallel Build is turned on for that project:

Parallel Build
With this the library project should build fast and without errors.
TX_ENABLE_EVENT_TRACE
The RTOS itself and the application needs to be compiled with following define:
TX_ENABLE_EVENT_TRACE
So add this define to the application and RTOS library project:
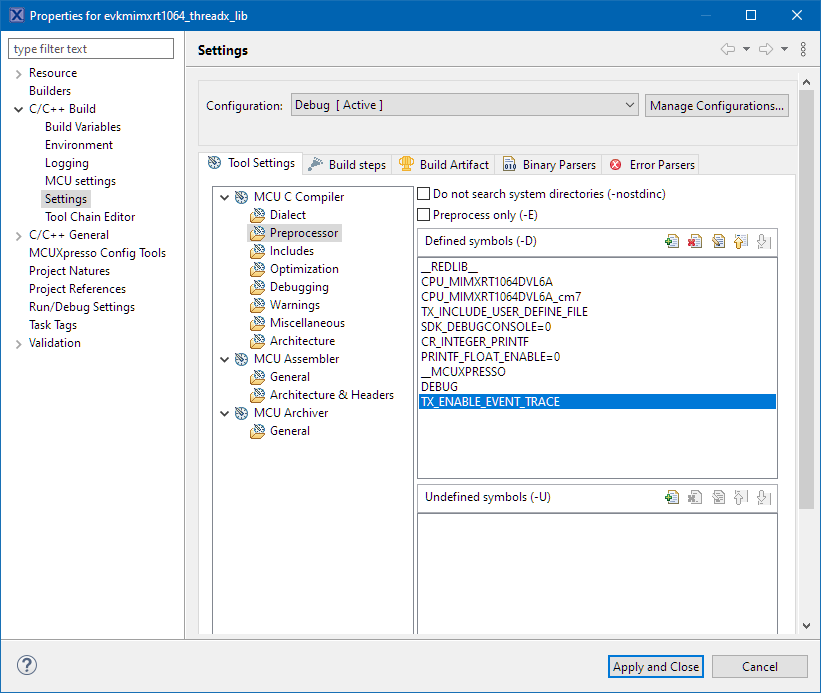
TX_ENABLE_EVENT_TRACE
Make sure that the library gets compiled with this define active/defined.
Linking with the Library
To update and link the library with a project, there is the liblnks.xml file which can be used with the Smart Update Wizard. It works with running a wizard which takes an XML file as input and can update project settings based on that XML file.
First you might need to cleanup that file as somehow the version in the SDK 2.8.5 is not configured properly: Open the file and remove the two values pointing to non-existing directories:
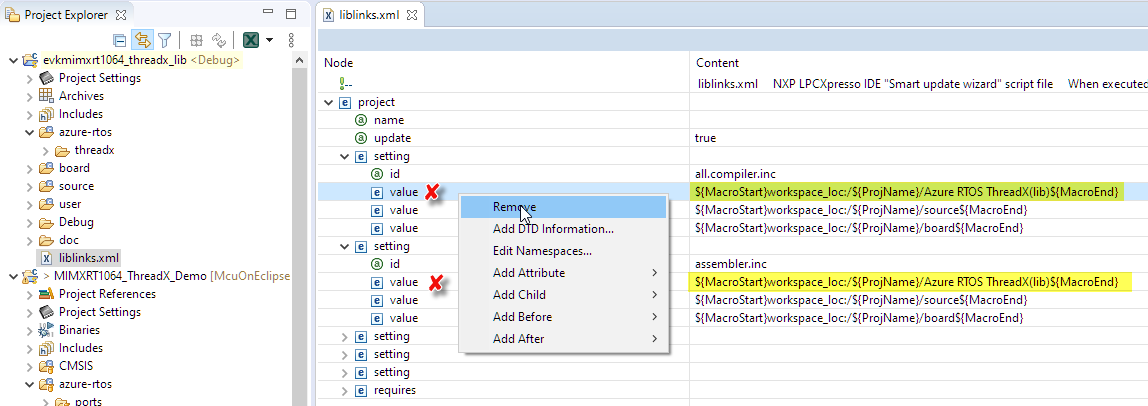
Removing Include Paths from liblinks.xml
Use the context menu to run the Smart update with that file:
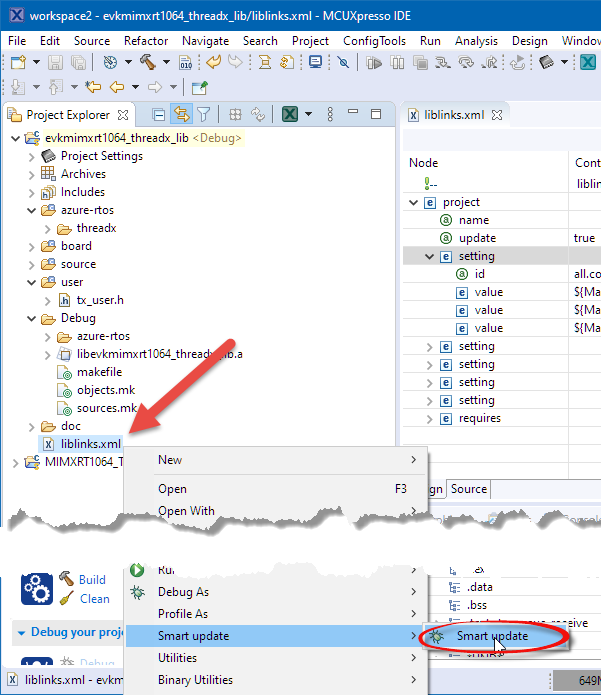
Smart Update
Then select the project which you want to use that library. In this case my ThreadX demo project:
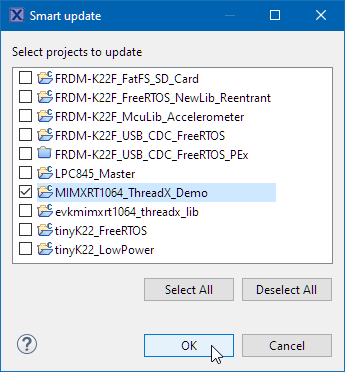
Smart Update Project
This creates a dependency to the library and adds the library project output to the linker settings. So now I can remove that old library and the references in the linker settings to it:
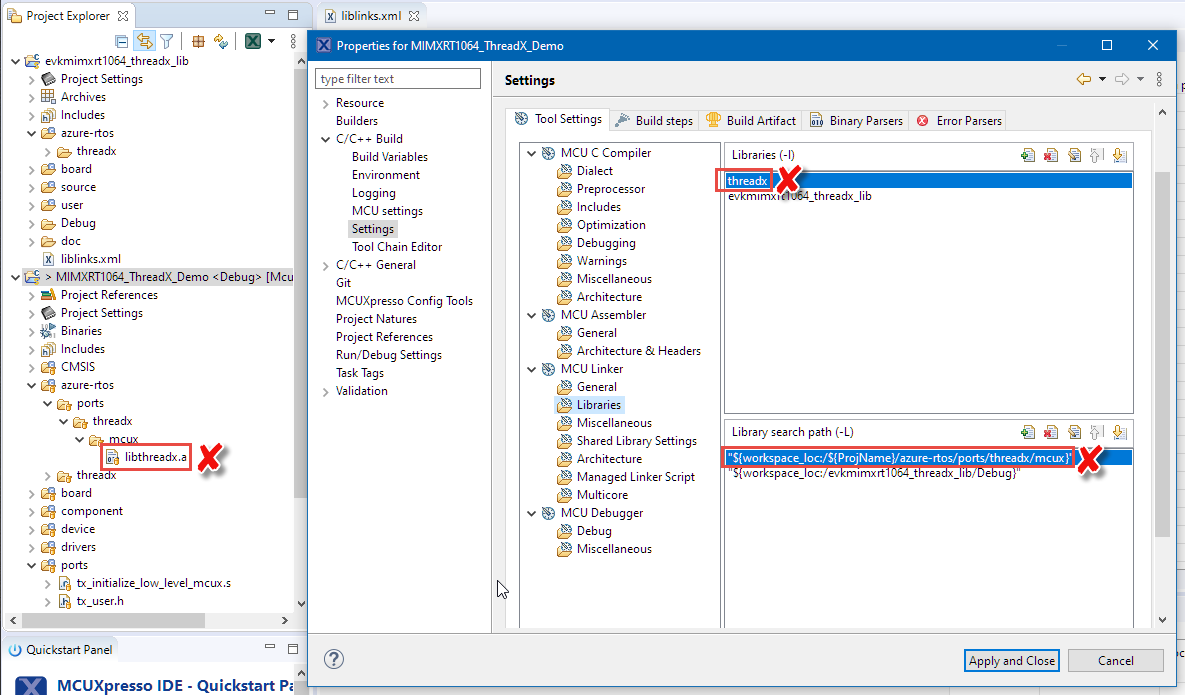
Delete old Library
Enable Trace in Application
Then next step is to make sure the application starts collecting trace information. This is done with a call to tx_trace_enable() providing a trace buffer, for example:
#ifdef TX_ENABLE_EVENT_TRACE
  /* Enable event tracing using the global "my_trace_buffer" memory and supporting a maximum of 30 ThreadX objects in the registry. */
  UINT status = tx_trace_enable ( &my_trace_buffer, sizeof(my_trace_buffer), 30);
  if (status!=TX_SUCCESS ) {
    for(;;) {}
   }
#endif
The trace buffer is defined as below:
#ifdef TX_ENABLE_EVENT_TRACE
UCHAR my_trace_buffer[64000];
#endif

enabling trace
💡 Enable trace *after* tx_kernel_entry() (e.g. in tx_application_define() because the kernel resets the trace structure during kernel startup! This is different from other tracing solutions (e.g. in FreeRTOS) where you can enable trace earlier.
Export Data
Next we have to dump the collected data. There are many ways to do this. The general process is described in https://docs.microsoft.com/en-us/azure/rtos/tracex/appendix-d
First, suspend/halt the target in the debugger. I’m using the ‘Memory’ view to show the trace buffer:
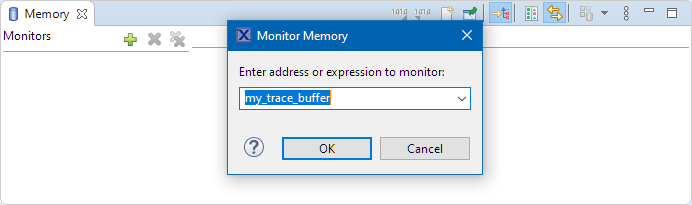
monitor memory with trace buffer
Then use the Export Memory button to export the memory:

Export memory
Export it as a raw binary with the size of the buffer:
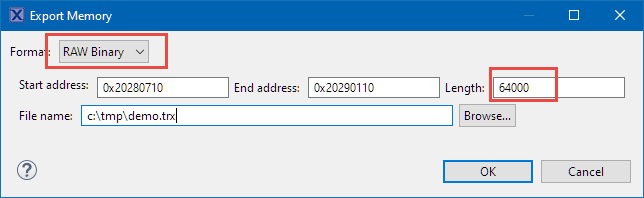
Export memory
An alternative approach to export the data is using the gdb command line, see my article for Percepio Tracealyzer how this can be done. In that case you don’t need to know the name of the trace buffer: the information is behind the _tx_trace_header_ptr pointer:
- tx_trace_header_header_id points to the start of the buffer
- tx_trace_header_buffer_start_pointer points to the start of the data
- tx_trace_header_buffer_end_pointer points to the end
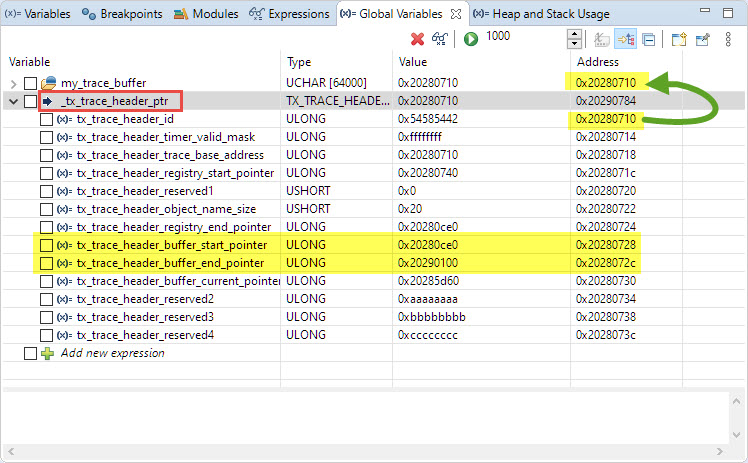
_tx_trace_header_ptr
Inspecting Data in TraceX
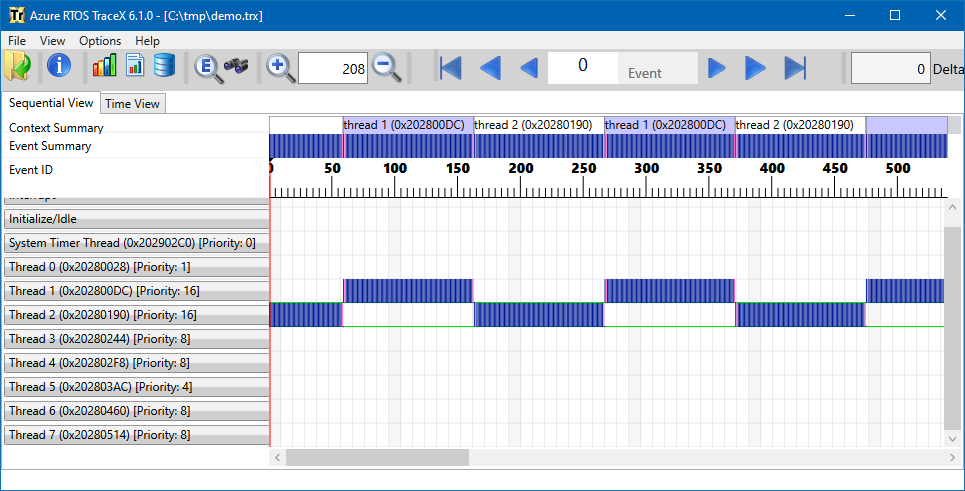
That file then can be opened in the TraceX application:
Azure RTOS TraceX
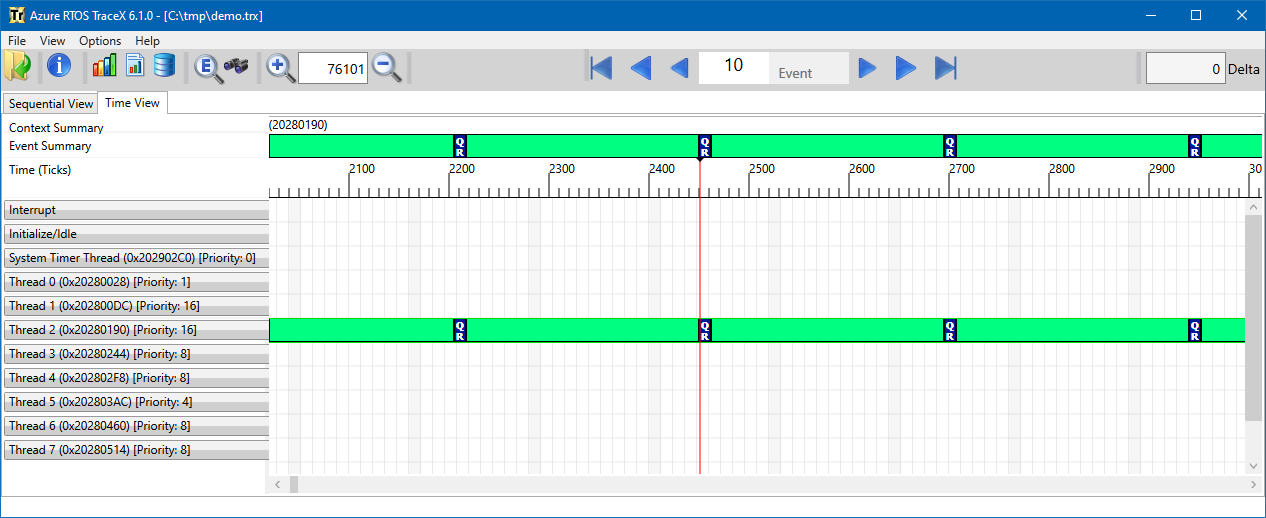
Azure RTOS TraceX with Time View
Using the TraceX viewer I can now inspect the application and how it runs with the Azure RTOS (ThreadX).
Summary
Compared to FreeRTOS, generating trace data with Microsoft Azure RTOS is much more complex. The data generated is very useful, and I cannot imagine how to work with any RTOS without this kind of information. The TraceX application works, but IMHO compared to the solutions for FreeRTOS with Percepio Tracealzyer and SEGGER SytemView the TraceX solutions does not look very user friendly or modern. I hope with the big Microsoft behind ThreadX this will change in the future.
I really wish that exporting the data is not that manual. The SEGGER RTT streaming is really what I was hoping for, and hopefully this might be added in the future. Renesas makes trace data export easier with their extension in Eclipse, this is at least something. If I really want to continue using ThreadX then maybe I need to implement something like this myself in Eclipse.
The good news is: There is at least an alternative tracing solution: Percepio has support for ThreadX and I already requested an evaluation license, so this is something I have to look into it next. So stay tuned if you are interested in ThreadX.
Happy TraceXing:-)
Links
- Project used in this article on GitHub: https://github.com/ErichStyger/mcuoneclipse/tree/master/Examples/MCUXpresso/i.MX%20RT1064_EVK
- Getting started with Azure RTOS: Getting Started with Microsoft Azure RTOS (aka ThreadX)
- Online TraceX User Guide: https://docs.microsoft.com/en-us/azure/rtos/tracex/chapter2
- Getting Trace Data for Percepio Tracealyzer: https://mcuoneclipse.com/2015/01/05/updated-percepio-tracealyzer-and-trace-library-to-version-v2-7-0/
- NXP Azure RTOS: https://www.nxp.com/design/software/embedded-software/azure-rtos-for-nxp-microcontrollers:AZURE-RTOS
- Microsoft RT1064 tutorial: https://github.com/azure-rtos/getting-started/tree/master/NXP/MIMXRT1060-EVK
- NXP SDK Download site: https://mcuxpresso.nxp.com
- MCUXpresso IDE: MCUXpresso IDE V11.2.1
- Microsoft ThreadX GitHub releases: https://github.com/azure-rtos/threadx/releases
- Dumping ThreadX data for TraceX: https://docs.microsoft.com/en-us/azure/rtos/tracex/appendix-d
- Smart Update Wizard: https://community.nxp.com/t5/LPCXpresso-IDE-FAQs/Creating-and-Linking-to-Library-Projects/m-p/469212
- Microsoft documentation, exporting ThreadX Trace Data: https://docs.microsoft.com/en-us/azure/rtos/tracex/appendix-d

Regarding the export, note that the Percepio Eclipse plugin supports ThreadX, which allows for viewing the trace in Tracealyzer with a single click.
LikeLiked by 1 person
Hi Johan,
thanks for the comment. Your comment just let me think: can I use the Perepio Tracealyzer Exporter Plugin (https://mcuoneclipse.com/2017/03/08/percepio-freertos-tracealyzer-plugin-for-eclipse/) to export just a junk of memory/data? I tried to do this if I can use it to export things for TraceX (did not expect it to work) and was not able to do so. I have set the RTOS to unknown. I’ll jump on to use the Percepio Tracealyzer instead.
LikeLike
Thank you for this guide! I find the current method of NXP to provide azureRTOS weird as well. At least if youre trying to get from a demo app to a project with customizable *X libraries in the back.
Regarding traceX, Id find two more things useful:
– A statistic / listing on all event containers (mutexes, semaphores, etc). This info seems to be included in the trace buffer, as one can already read off the names of event containers.
– A report function generating some pngs or pdf for documentation purposes.
What do you guys think?
LikeLike
The library approach for sure has some pros and cons, but to me the disadvantages are bigger than the benefits. I certainly see that it makes it easier and simpler for the vendor to provide the examples, but imho it is not the way how users at the end will use it.
As for TraceX: I still want to use the Percepio Analyzer: it is already superior for my FreeRTOS applications. But I had no time yet to use it with TraceX.
LikeLike