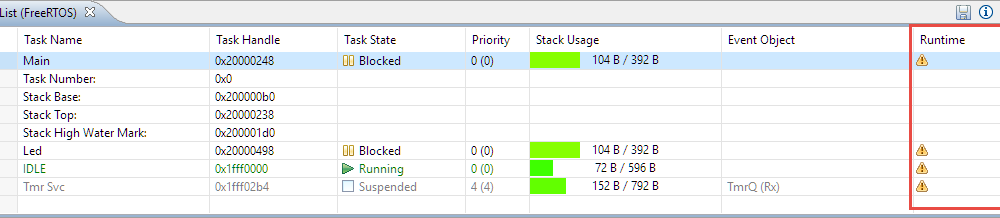
When using an RTOS like FreeRTOS, sooner or later you have to ask the question: how much time is spent in each task? The Eclipse based MCUXpresso IDE has a nice view showing exactly this kind of information:

FreeRTOS Runtime Information
For FreeRTOS (or that Task List view) to show that very useful information, the developer has to provide a helping hand so the RTOS can collect this information. This article shows how this can be done on an ARM Cortex-M.
Outline
A while back I covered that topic in Performance and Runtime Analysis with FreeRTOS from a Processor Expert point of view. This time it is about using a ‘native’ FreeRTOS and using the NXP MCUXpresso SDK, but the same principles would apply to every other environment for Cortex-M processors and microcontrollers. As for the FreeRTOS port, I’m using the one from https://github.com/ErichStyger/McuOnEclipseLibrary as this one already has all the needed hooks present. All the files and sources used in this article are available on GitHub.
How it works
To operating system uses a counter to measure the task execution time. So at task context switching time this counter is used to determine the time used by that task. The important point is that this time is not absolute (e.g. 37ms) but just a number of ‘ticks’ (e.g. 241 ticks). The RTOS knows how many ‘ticks’ have been used overall. And the RTOS knows how many tasks are in the system, so it can show how much percentage of the overall time has been spent in each task. One other note is that the time *includes* time spent in interrupts.
This is a very simple but still powerful way to estimate task execution time, and usually is all what you need. And it can be implemented in a very simple way: using a timer which increments a counter and a function which is used to read the counter value.
To turn on performance measurement, I have to enable two FreeRTOS configuration settings:
#define configUSE_TRACE_FACILITY 1 /* 1: include additional structure members and functions to assist with execution visualization and tracing, 0: no runtime stats/trace */
#define configGENERATE_RUN_TIME_STATS 1 /* 1: generate runtime statistics; 0: no runtime statistics */
To configure the timer and read the counter, I have to tell the function names with two macros:
#define configGET_RUNTIMER_COUNTER_VALUE_FROM_ISR   AppGetRuntimeCounterValueFromISR
#define configCONFIGURE_TIMER_FOR_RUNTIME_STATS     AppConfigureTimerForRuntimeStats
Using the Tick Counter
One very simply way to measure task execution is using the FreeRTOS tick counter itself. This can be enabled with
#define configGENERATE_RUN_TIME_STATS_USE_TICKS (1)
But this can only measure task execution time if a task executes longer than a RTOS tick period. For faster tasks this method is not useful. According to the Nyquist-Shannon Sampling Theorem I better use a 2x faster (better: 10x faster) measurement frequency.
Using the Cortex-M Cycle Counter
Another way to implement the counter is to use the Cortex-M cycle counter which is implemented on many devices and gives very good results. And best of all: no interrupts or extra timer needed.
A possible implementation is shown below:
static uint32_t prevCycleCounter, cycleCntCounter = 0;

void AppConfigureTimerForRuntimeStats(void) {
  cycleCntCounter = 0;
  McuArmTools_InitCycleCounter();
  prevCycleCounter = McuArmTools_GetCycleCounter();
}

uint32_t AppGetRuntimeCounterValueFromISR(void) {
  uint32_t newCntr, diff;

  newCntr = McuArmTools_GetCycleCounter();
  diff = newCntr-prevCycleCounter;
  prevCycleCounter = newCntr;
  cycleCntCounter += diff>>12; /* scale down the counter */
  return cycleCntCounter;
}
Using Periodic Timer Interrupt
The standard approach is to use a periodic interrupt timer which increments a counter. The recommended frequency is 10x of the FreeRTOS tick timer frequency in this case 10 kHz (100 us) for a 1 kHz tick timer:
static uint32_t perfCounter = 0;

#define PIT_BASEADDR       PIT
#define PIT_SOURCE_CLOCK   CLOCK_GetFreq(kCLOCK_BusClk)
#define PIT_CHANNEL        kPIT_Chnl_0
#define PIT_HANDLER        PIT0_IRQHandler
#define PIT_IRQ_ID         PIT0_IRQn

void PIT_HANDLER(void) {
  PIT_ClearStatusFlags(PIT_BASEADDR, PIT_CHANNEL, kPIT_TimerFlag);
  perfCounter++;
  __DSB();
}

void AppConfigureTimerForRuntimeStats(void) {
  pit_config_t config;

  PIT_GetDefaultConfig(&config);
  config.enableRunInDebug = false;
  PIT_Init(PIT_BASEADDR, &config);
  PIT_SetTimerPeriod(PIT_BASEADDR, PIT_CHANNEL, USEC_TO_COUNT(100U, PIT_SOURCE_CLOCK));
  PIT_EnableInterrupts(PIT_BASEADDR, PIT_CHANNEL, kPIT_TimerInterruptEnable);
  NVIC_SetPriority(PIT_IRQ_ID, 0);
  EnableIRQ(PIT_IRQ_ID);
  PIT_StartTimer(PIT_BASEADDR, PIT_CHANNEL);
}

uint32_t AppGetRuntimeCounterValueFromISR(void) {
  return perfCounter;
}
Summary
FreeRTOS includes a feature to measure task execution time relative to the other task in the system. What I need to provide is an initialization routine for a timer or some kind of counter plus a way to get the counter value. If you are interested in other ways to inspect the timing of FreeRTOS, have a look at Percepio Tracealyzer or the Segger SystemView. If you would like the application itself to show the performance data, have a look at the Shell/Commandline implementation described in Performance and Runtime Analysis with FreeRTOS.
Happy Performing 🙂
Links
- Project on GitHub: https://github.com/ErichStyger/mcuoneclipse/tree/master/Examples/MCUXpresso/tinyK22/tinyK22_FreeRTOS
- Performance and Runtime Analysis with FreeRTOS
- Better FreeRTOS Debugging in Eclipse
- ARM SWO Performance Counters
- McuLib on GitHub: https://github.com/ErichStyger/McuOnEclipseLibrary
- MCUXpresso IDE and SDK: https://mcuxpresso.nxp.com

Just make sure that if you’re using the performance counters that you’ve got portTICK_TYPE_IS_ATOMIC set! Otherwise a bug in the PendSV handler will prematurely re-enable interrupts during context switches, which opens up a nasty race condition.
Do you know if there’s an easy way to see how long a particular task has been blocked? I had an item on my to-do list to look into that. I don’t think it’s tracked now.
LikeLiked by 1 person
Yes, in my port I have portTICK_TYPE_IS_ATOMIC set.
About task blocking time: to my knowledge there is no dedicated event for this, but I think could be easily added. With SystemView you could report this as a user event. With Percepio there are already ‘Actor ready’ events, so they could be extended to include the blocking time, but not sure how hard this would be.
Happy New Year!
LikeLike