When Espressif released in 2014 their first WiFi ESP8266 transceiver, they took over at least the hobby market with their inexpensive wireless devices. Yet again, the successor ESP32 device is used in many projects. Rightfully there are many other industrial Wi-Fi solutions, but Espressif opened up the door for Wi-Fi in many low cost projects. Many projects use the ESP devices in an Arduino environment which basically means decent debugging except using printf() style which is … hmmm … better than nothing.
What is maybe not known to many ESP32 users: there *is* actually a way to use JTAG with the ESP32 devices :-). It requires some extra tools and setup, but with I have a decent Eclipse based way to debug the code. And this is what this article is about: how to use a SEGGER J-Link with Eclipse and OpenOCD for JTAG debugging the ESP32.

Robot with ESP32 and JTAG Debug Port
Using that approach, I have the power of Eclipse and can debug my NXP Kinetis in real-time together with the Wi-Fi part, even with multiple cores and FreeRTOS :-).

ESP32 debugging with FreeRTOS
J-Link
I’m using in this article the SEGGER J-Link for debugging. Simply because the J-Link probes are available on most developers desk and I’m using them in many of my projects, and their EDU line is affordable for students or hobbyists. Otherwise there are other solutions available using FT2232 USB-2-Serial breakout boards, for example the http://dangerousprototypes.com/docs/FT2232_breakout_board.
JTAG Connection
You have to consult the data sheet of your ESP32 device or module to identify the JTAG pins. For the ESP32 Pico-D4 which is on the TTGO Micro-32 module (see “Programming the ESP32 with an ARM Cortex-M USB CDC Gateway“) it is on the following pins:
- IO12: JTAG TDI
- IO13: JTAG TCK
- IO14: JTAG TMS
- IO15: JTAG TDO
- RST/EN: JTAG Reset
- 3.3V: VTref
Below the needed pins available on the TTGO breakout module:

esp32_jtag
The needed pins are available on a 2×15 JTAG header:

2×10 JTAG Pins (adapted from SEGGER.com)
One way is to use jumper wires to connect the probe with the board:

Debugging ESP32 with J-Link
Below with the wires annotated:

JTAG Signals to ESP32
A good idea is to use a JTAG Adapter board, e.g. the one from Adafruit. That way I can connect with the smaller 2×5 pin standard JTAG/SWD cable:

Debug Connection with Adafruit JTAG Adapter Board
💡 The ESP32 is *not* officially supported by SEGGER. It is important to mention that in my setup it worked very well using a J-Link EDU or a J-Link Pro (the ‘big’ probe in the plastic enclosure). It did *not* work with a J-Link EDU mini (not really sure why?).
Using jumper wires is working (but painful): I recommend when designing a ESP32 board to route the JTAG pins to a standard 2×5 header: that way connection with a debug probe is much easier: this is what we did for our ESP32 board which is used on our robot in combination with a NXP K22FX512 microcontroller:
Robot with ESP32 and JTAG Debug Port
Below is how make a debug connection with the TTGO Micro-32 ESP32 module:

TTGO Micro-32 JTAG Connection
Software and Tools
I recommend using OpenOCD with Eclipse/GDB for debugging: this is free of charge and easy to set up. If you already have setup the toolchain for the ESP32, it already comes with GDB and OpenOCD. Otherwise see https://docs.espressif.com/projects/esp-idf/en/latest/api-guides/jtag-debugging/index.html#setup-of-openocd
You should be able to use any Eclipse distribution. I’m using in this article the NXP MCUXpresso IDE because the ESP32 is used in combination with the NXP K22FX512 microcontroller.
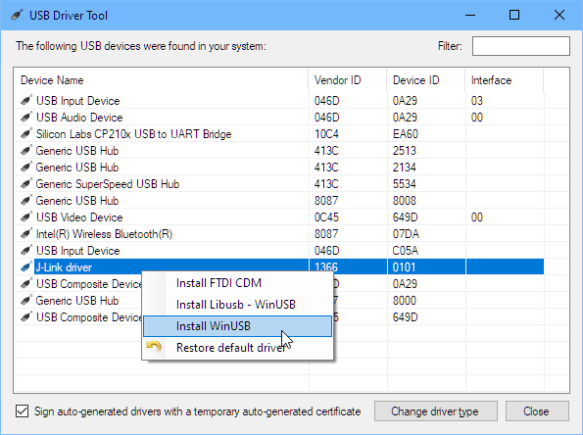
USB Driver Tool
Dealing with USB drivers for OpenOCD can be a pain, especially on Windows. The SysProgs USB Driver Tool from simplifies this a lot:
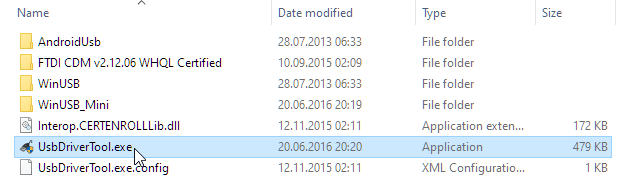
- Download the tool from https://visualgdb.com/UsbDriverTool/ and install it (actually it simply unzips the files to a folder of your choice)
- Run the tool

usb driver tool
- With the J-Link connected to the system, you should see a J-Link Driver
- Install the WinUSB driver for it:

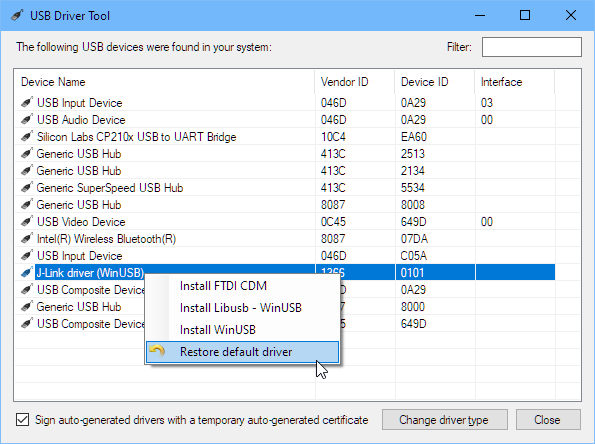
💡 Keep in mind that with this it is not a ‘normal’ J-Link anymore, so cannot be used as such. To restore the original J-Link driver, use the restore menu:
OpenOCD Configuration
I’m going to use the esp-wroom-32.cfg board configuration file.

esp-wroom-32.cfg
The default OpenOCD configuration uses a JTAG speed too high. Edit the configuration file and change the speed to 1000 kHz:
adapter_khz 1000

esp-wroom-32.cfg
Flashing with OpenOCD
Instead using the serial bootloader (see “Programming the ESP32 with an ARM Cortex-M USB CDC Gateway“), I can use OpenOCD to program the ESP32 through JTAG:
c:\esp\openocd-esp32\bin\openocd.exe -f interface/jlink.cfg -f board/esp-wroom-32.cfg -c "program_esp32 build/hello-world.bin 0x10000 verify exit"
This flashes the given binary (note the forward slashes!) at the given offset, performs a verify and then exits OpenOCD. Below an example output:
Open On-Chip Debugger  v0.10.0-esp32-20190708 (2019-07-08-11:04)
Licensed under GNU GPL v2
For bug reports, read
        http://openocd.org/doc/doxygen/bugs.html
adapter speed: 1000 kHz
Info : Configured 2 cores
esp32 interrupt mask on
Info : J-Link V9 compiled Oct 25 2018 11:46:07
Info : Hardware version: 9.10
Info : VTarget = 3.293 V
Info : clock speed 1000 kHz
Info : JTAG tap: esp32.cpu0 tap/device found: 0x120034e5 (mfg: 0x272 (Tensilica), part: 0x2003, ver: 0x1)
Info : JTAG tap: esp32.cpu1 tap/device found: 0x120034e5 (mfg: 0x272 (Tensilica), part: 0x2003, ver: 0x1)
Info : Target halted. PRO_CPU: PC=0x40000400 (active)    APP_CPU: PC=0x40000400
Info : Listening on port 3333 for gdb connections
Info : JTAG tap: esp32.cpu0 tap/device found: 0x120034e5 (mfg: 0x272 (Tensilica), part: 0x2003, ver: 0x1)
Info : JTAG tap: esp32.cpu1 tap/device found: 0x120034e5 (mfg: 0x272 (Tensilica), part: 0x2003, ver: 0x1)
Info : esp32: Debug controller 0 was reset (pwrstat=0x5F, after clear 0x0F).
Info : esp32: Core 0 was reset (pwrstat=0x5F, after clear 0x0F).
Info : Target halted. PRO_CPU: PC=0x5000004B (active)    APP_CPU: PC=0x00000000
Info : esp32: Core 0 was reset (pwrstat=0x1F, after clear 0x0F).
Info : esp32: Debug controller 1 was reset (pwrstat=0x5F, after clear 0x0F).
Info : esp32: Core 1 was reset (pwrstat=0x5F, after clear 0x0F).
Info : Target halted. PRO_CPU: PC=0x40000400 (active)    APP_CPU: PC=0x40000400
** Programming Started **
auto erase enabled
Info : Target halted. PRO_CPU: PC=0x400916EE (active)    APP_CPU: PC=0x40000400
Info : Flash mapping 0: 0x10020 -> 0x3f400020, 84 KB
Info : Flash mapping 1: 0x30018 -> 0x400d0018, 422 KB
Info : Target halted. PRO_CPU: PC=0x400916EE (active)    APP_CPU: PC=0x40000400
Info : Auto-detected flash size 4096 KB
Info : Using flash size 4096 KB
Info : Target halted. PRO_CPU: PC=0x400916EE (active)    APP_CPU: PC=0x40000400
Info : Target halted. PRO_CPU: PC=0x400916EE (active)    APP_CPU: PC=0x40000400
wrote 602112 bytes from file build/hello-world.bin in 23.465628s (25.058 KiB/s)
** Programming Finished **
** Verify Started **
Info : Target halted. PRO_CPU: PC=0x400916EE (active)    APP_CPU: PC=0x40000400
read 599168 bytes from file build/hello-world.bin and flash bank 0 at offset 0x00010000 in 16.135042s (36.264 KiB/s)
contents match
** Verified OK **
shutdown command invoked
Warn : Flash driver of esp32.flash does not support free_driver_priv()
Warn : Flash driver of irom does not support free_driver_priv()
Warn : Flash driver of drom does not support free_driver_priv()
OpenOCD GDB Server
We are going to use a GDB client-server connection with the server already running.
From a DOS prompt launch OpenOCD with the following command:
c:\esp\openocd-esp32\bin\openocd.exe -f interface/jlink.cfg -f board/esp-wroom-32.cfg
The output should be something like this:

Working ESP32 J-Link Connection
Open On-Chip Debugger  v0.10.0-esp32-20190708 (2019-07-08-11:04)
Licensed under GNU GPL v2
For bug reports, read
        http://openocd.org/doc/doxygen/bugs.html
adapter speed: 4000 kHz
Info : Configured 2 cores
esp32 interrupt mask on
Info : Listening on port 6666 for tcl connections
Info : Listening on port 4444 for telnet connections
Info : J-Link V9 compiled Oct 25 2018 11:46:07
Info : Hardware version: 9.10
Info : VTarget = 3.303 V
Info : clock speed 4000 kHz
Info : JTAG tap: esp32.cpu0 tap/device found: 0x120034e5 (mfg: 0x272 (Tensilica), part: 0x2003, ver: 0x1)
Info : JTAG tap: esp32.cpu1 tap/device found: 0x120034e5 (mfg: 0x272 (Tensilica), part: 0x2003, ver: 0x1)
Info : esp32: Debug controller 0 was reset (pwrstat=0x5F, after clear 0x0F).
Info : esp32: Core 0 was reset (pwrstat=0x5F, after clear 0x0F).
Info : esp32: Debug controller 1 was reset (pwrstat=0x5F, after clear 0x0F).
Info : esp32: Core 1 was reset (pwrstat=0x5F, after clear 0x0F).
Info : Detected debug stubs @ 3ffb39c0 on core0 of target 'esp32'
Info : Listening on port 3333 for gdb connections
The server is now waiting for connections on port 3333 which we are going to use from Eclipse in a next step.
Eclipse Launch Configuration
In Eclipse, create a new ‘GDB Hardware Debugging’ launch configuration.
In the ‘Main’ tab specify the project and the binary to be used:
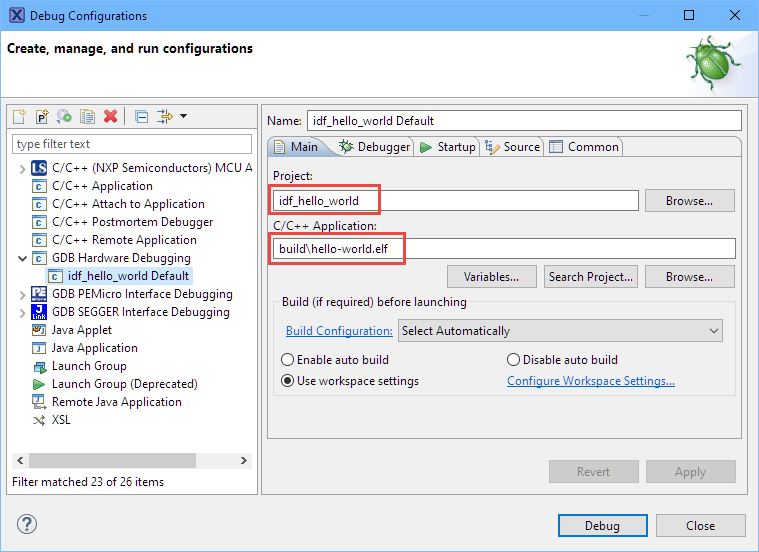
Main Launch Configuration Settings
In the ‘Debugger’ tab, specify the path to gdb:
C:/esp/toolchain/xtensa-esp32-elf/bin/xtensa-esp32-elf-gdb.exe
💡 Note the forward slashes (/) for the path!

GDB Debugger Connection Settings
In the ‘Startup’ tab use the following settings and enter the following commands:
set mem inaccessible-by-default off
mon reset halt
flushregs
set remote hardware-watchpoint-limit 2

Debugger Startup Settings
The above settings are for debugging an already flashed application on the ESP32. To program the binary, add the following after the ‘mon reset halt’:
mon program_esp32 "build/hello-world.bin" 0x10000 verify
Note that with the above notation it requires that the OpenOCD server has been started just above that ‘build’ folder location (means: with the current directory of the project).
IMPORTANT: Ideally, I would use something like this:
mon program_esp32 "${project_loc:idf_hello_world}/build/hello-world.bin" 0x10000 verify
But this does *not* work (at least in the current Eclipse version, as the path gets passed in a wrong way to OpenOCD with the slashes removed 😦 :
** Programming Started **
auto erase enabled
Error: couldn't open H:VorlesungADISgitProjectsMCUXpressoIDEidf_hello_world/build/hello-world.bin
embedded:startup.tcl:480: Error: ** Programming Failed **
The alternative (and ugly) way is to use an absolute path instead, e.g.
mon program_esp32 "H:/Vorlesung/ADIS/git/Projects/MCUXpressoIDE/idf_hello_world/build/hello-world.bin" 0x10000 verify
To save the configuration as .launch file in the project (see “Sharing Debug Configuration with Eclipse“), use the following setting:

Common Settings
That’s it for the Eclipse launch configuration.
Debugging with Eclipse
Now I can use the launch configuration to debug my target:

Debugging and using the Launch Configuration
In the running GDB server (DOS command prompt) I should see now that it accepts my connection request from Eclipse:
C:\esp\openocd-esp32\bin>openocd.exe -f interface/jlink.cfg -f board/esp-wroom-32.cfg
Open On-Chip Debugger  v0.10.0-esp32-20190708 (2019-07-08-11:04)
Licensed under GNU GPL v2
For bug reports, read
        http://openocd.org/doc/doxygen/bugs.html
adapter speed: 4000 kHz
Info : Configured 2 cores
esp32 interrupt mask on
Info : Listening on port 6666 for tcl connections
Info : Listening on port 4444 for telnet connections
Info : J-Link V9 compiled Oct 25 2018 11:46:07
Info : Hardware version: 9.30
Info : VTarget = 3.335 V
Info : clock speed 4000 kHz
Info : JTAG tap: esp32.cpu0 tap/device found: 0x120034e5 (mfg: 0x272 (Tensilica), part: 0x2003, ver: 0x1)
Info : JTAG tap: esp32.cpu1 tap/device found: 0x120034e5 (mfg: 0x272 (Tensilica), part: 0x2003, ver: 0x1)
Info : Listening on port 3333 for gdb connections
Info : accepting 'gdb' connection on tcp/3333
Error: No symbols for FreeRTOS
Info : Target halted. PRO_CPU: PC=0x40148F12 (active)    APP_CPU: PC=0x40148F12
Info : Target halted. PRO_CPU: PC=0x400916EE (active)    APP_CPU: PC=0x40148F12
Info : Flash mapping 0: 0x10020 -> 0x3f400020, 105 KB
Info : Flash mapping 1: 0x30018 -> 0x400d0018, 490 KB
Info : Target halted. PRO_CPU: PC=0x400916EE (active)    APP_CPU: PC=0x40148F12
Info : Auto-detected flash size 4096 KB
Info : Using flash size 4096 KB
Info : Target halted. PRO_CPU: PC=0x400916EE (active)    APP_CPU: PC=0x40148F12
Info : Flash mapping 0: 0x10020 -> 0x3f400020, 105 KB
Info : Flash mapping 1: 0x30018 -> 0x400d0018, 490 KB
Info : Using flash size 492 KB
Info : Target halted. PRO_CPU: PC=0x400916EE (active)    APP_CPU: PC=0x40148F12
Info : Flash mapping 0: 0x10020 -> 0x3f400020, 105 KB
Info : Flash mapping 1: 0x30018 -> 0x400d0018, 490 KB
Info : Using flash size 108 KB
Warn : negative reply, retrying
Info : JTAG tap: esp32.cpu0 tap/device found: 0x120034e5 (mfg: 0x272 (Tensilica), part: 0x2003, ver: 0x1)
Info : JTAG tap: esp32.cpu1 tap/device found: 0x120034e5 (mfg: 0x272 (Tensilica), part: 0x2003, ver: 0x1)
Info : esp32: Debug controller 0 was reset (pwrstat=0x5F, after clear 0x0F).
Info : esp32: Core 0 was reset (pwrstat=0x5F, after clear 0x0F).
Info : Target halted. PRO_CPU: PC=0x5000004B (active)    APP_CPU: PC=0x00000000
Info : esp32: Core 0 was reset (pwrstat=0x1F, after clear 0x0F).
Info : esp32: Debug controller 1 was reset (pwrstat=0x5F, after clear 0x0F).
Info : esp32: Core 1 was reset (pwrstat=0x5F, after clear 0x0F).
Info : Target halted. PRO_CPU: PC=0x40000400 (active)    APP_CPU: PC=0x40000400
Info : Detected debug stubs @ 3ffb3a30 on core0 of target 'esp32'
Info : Target halted. PRO_CPU: PC=0x400D5650 (active)    APP_CPU: PC=0x40148F12
Note: It does *not* work with a J-Link EDU mini (https://www.segger.com/products/debug-probes/j-link/models/j-link-edu-mini/), probably because it is not fast enough? Lowering the JTAG frequency did not help, OpenOCD reports LIBUSB_ERROR_TIMEOUT errors
Info : accepting 'gdb' connection on tcp/3333
Error: No symbols for FreeRTOS
Warn : Failed to send data to device: LIBUSB_ERROR_TIMEOUT.
Warn : Failed to send data to device: LIBUSB_ERROR_TIMEOUT.
Error: Sending data to device timed out.
Error: transport_write() failed: timeout occurred.
Error: jaylink_jtag_io() failed: timeout occurred.
Error: Failed to fetch AR regs!

Warn : Last read operation left 579 bytes.
Info : Target halted. PRO_CPU: PC=0x00000000 (active)    APP_CPU: PC=0x00000000
Warn : Failed to send data to device: LIBUSB_ERROR_TIMEOUT.
Warn : Failed to send data to device: LIBUSB_ERROR_TIMEOUT.
Error: Sending data to device timed out.
Error: transport_write() failed: timeout occurred.
Error: jaylink_jtag_io() failed: timeout occurred.
Warn : Last read operation left 2048 bytes.
Warn : Failed to send data to device: LIBUSB_ERROR_TIMEOUT.
Warn : Failed to send data to device: LIBUSB_ERROR_TIMEOUT.
Error: Sending data to device timed out.
Error: transport_write() failed: timeout occurred.
Error: jaylink_jtag_io() failed: timeout occurred.
Warn : Last read operation left 2048 bytes.
With this, I’m using the power of Eclipse to debug the ESP32 and can see all the FreeRTOS threads 🙂

Debugging ESP32 with Eclipse
Summary
While most people are ‘debugging’ the ESP32 in ‘Arduino printf()’ style, I prefer to use a real debugger to inspect the target state and step through the code. Eclipse with GDB is a great tool helping me to understand the code execution on the ESP32. It requires a JTAG debug probe as the SEGGER J-Link and the needed JTAG pins available on a debug header. While this is some effort, the benefits of it are priceless in my view.
Happy JTAGing 🙂
Links
- ESP32 JTAG Debugging: https://docs.espressif.com/projects/esp-idf/en/latest/api-guides/jtag-debugging/using-debugger.html
- Building with Eclipse: https://mcuoneclipse.com/2019/08/18/building-and-flashing-esp32-applications-with-eclipse/
- Espressif Pico Kit: https://docs.espressif.com/projects/esp-idf/en/latest/hw-reference/get-started-pico-kit.html

Erich,
great article. I wanted to get JTAG debugging going on my ESP32 for a while now. So today I tried to hook up two JTAG adapters (generic and j-link) up to the JTAG port of my ESP-WROVER. Ran into trouble right away (with both of them!). Could not get the JTAG interface to respond at all. Had to add a pull-up resistor on IO14: JTAG TMS to make it work. Maybe this is the same issue you had with your smaller J-Link EDU mini?
LikeLike
Good point, I have to check this out! What did you use as debug probe? The normal J-Link or the PRO?
LikeLike
So far my projects centered around Kinetis uC’s, So, most of the time I use the on-board SWD debug interfaces when dealing with our assortment of EVKs.
But to get the single-step debug going with the ESP32 I tried using the Altera/Intel USB Blaster, and an old Amontec JTAGkey2 we have at the office. At home I tried it with my J-Link Edu. Did not get very far with either.
Looking at the JTAG interface pins on the ESP32: only two have either a pull-up or pull-down resistor built in (MTDO and MTDI), while neither the MTCK nor the MTMS have any. In my opinion, those should be pulled to safe and steady levels just to avoid floating inputs.
Seems that on my board (which has the standard ESP32 USB-UART upload port as well) the state of that interface may prevent the JTAG from working… need to hook up my trusty LogicPro16 and investigate.
LikeLike
Me too: my projects are mostly around Kinetis.
I tried adding 10k pull-ups to the JTAG lines as you suggested. But adding a pull-up to the TDI does not let the ESP32 boot. I can add pull-ups to the TDO and TMS, and that still works with the ‘big’ J-Link EDU.
But it does not work with the J-Link EDU *Mini*, still the same error message from OpenOCD:
Warn : Failed to send data to device: LIBUSB_ERROR_TIMEOUT.

Warn : Failed to send data to device: LIBUSB_ERROR_TIMEOUT.

Error: Sending data to device timed out.

Error: transport_write() failed: timeout occurred.

Error: jaylink_jtag_io() failed: timeout occurred.

Error: Failed to fetch AR regs!
So the J-Link EDU Mini does not work, and I think this might be a problem of OpenOCD. It *does* work with the normal J-Link EDU (non-mini)
To my understanding and reading the information on the web, the ESP32 has internal pull-ups and pull-downs, so no external resistors should be needed. The Espressif boards with JTAG interface do not have pull resistors too.
Anyway, thanks for the idea!
LikeLike
The ESP32 Series Datasheet Version 3.1 (covers ESP32-D0WD, ESP32-D0WDQ6, ESP32-D2WD and ESP32-S0WD) states in section 2.4:
The important part here is that this happens during specific reset cycles, namely power-on-reset/watchdog reset or brownout reset. During these reset cycles it latches the state of the MTDI pin (GPIO12):
Voltage of Internal LDO (VDD_SDIO)
Pin Default 3.3V 1.8V
MTDI Pull-down 0 1
So, depending on the ESP32 board or module you are using, you need to determine what kind of SPI FLASH ROM is in use. For my ESP-WROVER this happens to be 3.3V SPI FLASH. The pin therefore needs to see a LOW level during those reset cycles to operate at all.
To throw another wrinkle in there, the ESP32 contains an EFUSE block that allows overriding some of the strapping pin settings:
Just to show that MTDI adds a bit of complexity, the manual goes on to state:
In Appendix A.4.IO_MUX, MTDI is listed as having an internal weak pull-down.
Of note are the equally important MTCK and MTMS pins, which do not come with any internal pull-up or pull-down resistors at all. Which is probably why ESPRESSIF has (jumper configurable) external 10K pull-down resistor on MTCK, and an external 10K pull-up resitor on MTMS on their ESP-WROVER-KIT board (schematics see JTAG section ESP-WROVER-KIT_V4_1.pdf).
LikeLike
Thank you so much for all the detailed information!
But none of these allowed me to use the SEGGER J-Link, I tried pull resistors in different combinations. Independently, SEGGER has contacted me and I’m exchanging information with them, and potentially we might be able to identify the isse. SEGGER is getting an ESP32 hardware so they could try it out on their side. An early indication could be that the issue is within OpenOCD not using the correct way to get the data through USB. Once I know more, I plan to post an update.
LikeLike
Erich,
LikeLike
yes?
LikeLike
Hi Erich! Did you ever get this working? I’m just getting into the ESP32 world, and I’m figuring out which way I want to approach debugging.
LikeLike
Hi Ed,
yes, it works very well with the circuit and connection shown in this article. It only does not work with the J-Link EDU (I had reported this to SEGGER).
See as well https://mcuoneclipse.com/2019/10/20/jtag-debugging-the-esp32-with-ft2232-and-openocd/ for a different way to debug it.
Erich
LikeLike
Pingback: JTAG Debugging the ESP32 with FT2232 and OpenOCD | MCU on Eclipse
Hi Erich, thank you so much for the great post!
I am currently laying out a board with the ESP 32, and this is the first time I’ve ever had to design a board with a JTAG header. I am a little confused about your photo where you highlighted the Segger J-Link pins that use used in yellow; you have highlighted both the nTRST and RESET signals, however, your photo seems to show that the nTRST is not used. Did you use both of these pins?
As an aside, I honestly can’t tell what the difference is between them from the description on Segger’s website:
nTRST — > Output –> JTAG Reset.
Output from J-Link to the Reset signal of the target JTAG port. Typically connected to nTRST of the target CPU. This pin is normally pulled HIGH on the target to avoid unintentional resets when there is no connection.
nRESET –> I/O –> Target CPU reset signal.
Typically connected to the RESET pin of the target CPU, which is typically called “nRST”, “nRESET” or “RESET”. This signal is an active low signal.
I am a little lost on what to do!
LikeLike
Hi Erich,
By the way, back in May you responded to me with:
> It only does not work with the J-Link EDU
You are showing the a J-Link EDU connected in the photos in your post. Do you mean the EDU mini? I have a regular J-Link EDU.
Thanks!
LikeLike
Hi Ed,
I’m sorry, I missed to add the ‘mini’ to that sentence (fixed now). It works for me with the ‘normal’/’big’/’grey’ J-Link EDU as in the pictures. But it did *not* work with the small EDU mini version.
Erich
LikeLike
Hi Ed,
It means that the ‘reset’ pin of the J-Link shall be connected to the reset pin of the target.
See https://mcuoneclipse.files.wordpress.com/2019/09/ttgo-micro-32-jtag-connection.png
I hope this helps,
Erich
LikeLike
Erich,
Thanks so much for the article! I believe I have this ‘mostly’ working. Except that it is not breaking (or not getting to) app_main. It breaks on this line of code:
} else if (default_chip.size > g_rom_flashchip.chip_size) {
This is inside the esp_flash_init_default_chip() function.
Any idea what I might have done wrong?
LikeLike
if you press continue, then it runs to main?
So it must be something stopping the debugger. Can you check the Console view output in Eclipse for the output/logs of the J-Link? It should tell you why it stopped. Or check the GDB logs (see https://mcuoneclipse.com/2016/07/01/board-bring-up-tips-gdb-logs-and-traces-in-eclipse/). Anything useful there?
LikeLike
Erich,
-If I hit run, it keeps breaking at this same place. I’ve made sure all breakpoints are removed and I still see the same thing.
-I don’t see much in the logs that is helpful to me. Do you see anything thing that stands out to you?
** Programming Finished **
** Verify Started **
Info : Target halted. PRO_CPU: PC=0x4009171A (active) APP_CPU: PC=0x40000400
read 732400 bytes from file C:/_DEV/REDACTED/3_Firmware/ESP_Now/build/ESP32_Now.bin and flash bank 0 at offset 0x00010000 in 17.194674s (41.596 KiB/s)
contents match
** Verified OK **
Info : Target halted. PRO_CPU: PC=0x400E241C (active) APP_CPU: PC=0x400812F0
Info : Detected debug stubs @ 3ffb4288 on core0 of target ‘esp32’
Info : dropped ‘gdb’ connection
Info : accepting ‘gdb’ connection on tcp/3333
Info : JTAG tap: esp32.cpu0 tap/device found: 0x120034e5 (mfg: 0x272 (Tensilica), part: 0x2003, ver: 0x1)
Info : JTAG tap: esp32.cpu1 tap/device found: 0x120034e5 (mfg: 0x272 (Tensilica), part: 0x2003, ver: 0x1)
Info : esp32: Debug controller 0 was reset (pwrstat=0x5F, after clear 0x0F).
Info : esp32: Core 0 was reset (pwrstat=0x5F, after clear 0x0F).
Info : Target halted. PRO_CPU: PC=0x5000004B (active) APP_CPU: PC=0x00000000
Info : esp32: Core 0 was reset (pwrstat=0x1F, after clear 0x0F).
Info : esp32: Debug controller 1 was reset (pwrstat=0x5F, after clear 0x0F).
Info : esp32: Core 1 was reset (pwrstat=0x5F, after clear 0x0F).
Info : Target halted. PRO_CPU: PC=0x40000400 (active) APP_CPU: PC=0x40000400
** Programming Started **
auto erase enabled
Warn : keep_alive() was not invoked in the 1000ms timelimit. GDB alive packet not sent! (1071). Workaround: increase “set remotetimeout” in GDB
Info : Target halted. PRO_CPU: PC=0x4009171A (active) APP_CPU: PC=0x40000400
Warn : keep_alive() was not invoked in the 1000ms timelimit. GDB alive packet not sent! (1581). Workaround: increase “set remotetimeout” in GDB
Info : Target halted. PRO_CPU: PC=0x4009171A (active) APP_CPU: PC=0x40000400
wrote 733184 bytes from file C:/_DEV/REDACTED/3_Firmware/ESP_Now/build/ESP32_Now.bin in 22.254133s (32.174 KiB/s)
** Programming Finished **
** Verify Started **
Info : Target halted. PRO_CPU: PC=0x4009171A (active) APP_CPU: PC=0x40000400
read 732400 bytes from file C:/_DEV/REDACTED/3_Firmware/ESP_Now/build/ESP32_Now.bin and flash bank 0 at offset 0x00010000 in 17.160501s (41.679 KiB/s)
contents match
** Verified OK **
Info : Detected debug stubs @ 3ffb4288 on core0 of target ‘esp32’
Info : Target halted. PRO_CPU: PC=0x400E241C (active) APP_CPU: PC=0x400812E7
LikeLike
And here’s the last bit of my GDB log:
[message truncated to 5 lines. More lines can be set in the Preference->Debug->GDB eclipse preference page.]
489,703 (gdb)
489,709 91^done,locals=[{name=”cfg”,value=”{host_id = SPI1_HOST, cs_num = 0, iomux = false, input_de\
lay_ns = 0, speed = ESP_FLASH_40MHZ}”},{name=”err”,value=”0″}]
489,709 (gdb)
489,739 92-var-update 1 var1
489,739 93-var-update 1 var2
489,749 92^done,changelist=[]
489,749 (gdb)
489,750 93^done,changelist=[]
489,750 (gdb)
489,767 94-thread-info 7
489,768 95-thread-info 8
489,768 96-thread-info 9
489,815 94^done,threads=[{id=”7″,target-id=”Thread 1073459512″,details=”Name: dport”,frame={level=”0\
“,addr=”0x40093184″,func=”vPortTaskWrapper”,args=[{name=”pxCode”,value=”0x0″},{name=”pvParameters”,v\
alue=”0x0″}],file=”C:/_DEV/_Tools/ESP-IDF/Tools/components/freertos/port.c”,fullname=”C:\\_DEV\\_Too\
ls\\ESP-IDF\\Tools\\components\\freertos\\port.c”,line=”142″},state=”stopped”}]
489,815 (gdb)
489,840 95^done,threads=[{id=”8″,target-id=”Thread 1073412788″,details=”Name: esp_timer”,frame={leve\
l=”0″,addr=”0x40093184″,func=”vPortTaskWrapper”,args=[{name=”pxCode”,value=”0x0″},{name=”pvParameter\
s”,value=”0x0″}],file=”C:/_DEV/_Tools/ESP-IDF/Tools/components/freertos/port.c”,fullname=”C:\\_DEV\\\
_Tools\\ESP-IDF\\Tools\\components\\freertos\\port.c”,line=”142″},state=”stopped”}]
489,840 (gdb)
489,851 96^done,threads=[{id=”9″,target-id=”Thread 1073458380″,details=”Name: ipc1, State: Running @\
CPU1″,frame={level=”0″,addr=”0x400812e7″,func=”start_cpu1_default”,args=[],file=”C:/_DEV/_Tools/ESP-\
IDF/Tools/components/esp32/cpu_start.c”,fullname=”C:\\_DEV\\_Tools\\ESP-IDF\\Tools\\components\\esp3\
2\\cpu_start.c”,line=”456″},state=”stopped”}]
489,851 (gdb)
LikeLike
unfortunately this does not show anything useful why the target has halted.
LikeLike
Thanks for the blog. Working fine with ESP 32 DEVKIT C.
LikeLiked by 1 person
Great, thanks for confirming it.
LikeLike
Erich, nice work. Thanks.
I’ve tried to install the Expressif IDF Plugins for Eclipse in MCUXpresso IDE version 11.3.1 but it fails with message “Missing requirement: Espressif IDF Plugins for Eclipse 2.1.1.202106040310 (com.espressif.idf.feature.feature.group 2.1.1.202106040310) requires ‘org.eclipse.equinox.p2.iu; org.eclipse.cdt.cmake.is.core 0.0.0’ but it could not be found”.
Have you managed to installing the plug-in in MCUXpresso IDE version 11.3.1?
LikeLike
Hi Victor,
no, I did not try to install the Espressif IDF plugin in Eclipse: I’m using normal ‘make’ projects and then call the idf.py from Eclipse. That worked very well.
LikeLike
Hi Erich,
I followed the steps from your post https://mcuoneclipse.com/2019/08/18/building-and-flashing-esp32-applications-with-eclipse/ and managed to setup the projects for compiling and flashing. Idf-tools version 4.3 packs a batch file prepared for setting all required environment variables so I simply launched the batch and launched the MCUXpresso IDE from there. No need to make permanent PATH adjustments.
The sdkconfig.h file is still marked as unresolved external, but the rest I tested is working fine for me now.
The built-in terminal also worked well.
One note, a preconfigured Eclipse copy is packed with the tools package that works out of the box. With version 4.2, which is the one I use on Linux, I installed and configured Eclipse manually, yet it was easy and smooth following their guide.
Thanks again for this great work you do and for sharing it.
LikeLiked by 1 person
Hi Victor,
many thanks for the feedback, appreciated. Yes, permanent PATH changes are not good and I avoid that whenever possible. For me the easiest way is to start the IDF environment (ESP-IDF Command Prompt) on Windows and launch Eclipse from there. The IDF command prompt sets up all the correct environment locally, so I don’t have to change anything.
LikeLike
Don’t know how much ESPRESSIF relies on having a plain-vanilla Eclipse installation (could be the MCUXpresso flavour interferes due to some NXP customizations?). Once I had tried the VSC/PlatformIO combination as an alternate ESP32 IDE, it quickly became my preferred choice. Might be worth checking out if you can’t resolve this, or don’t fancy installing another Eclipse IDE copy.
LikeLiked by 1 person
I believe it is more of a problem of the Espressif plugin with its dependency to CMake: I was never able to have a good CMake working environment inside Eclipse. I agree that VSC is a very good alternative, and it supports CMake out of the box. But PlatformIO is not needed at all (actually it it did not install successfully on my machine). Not sure if you have seen my series on VSC already? https://mcuoneclipse.com/2021/06/02/visual-studio-code-for-c-c-with-arm-cortex-m-part-7-freertos/
LikeLike
Glad to know I wasn’t the only one fighting with it.You are correct in that PIO is not absolutely essential. I usually recommend PIO to point out a simple upgrade path/alternative to the Arduino IDE, which for some reason most stumble upon first when starting out with micro-controllers or the ESP32. I did not have any issues during the PIO installation and found the breath of supported frameworks/platforms/boards astounding. This to me is the greatest benefit, rather than having to deal with multiple vendor provided IDEs for each architecture. And yes, I’ve been following your series about the VSC with great interest (good job by the way, keep the updates comping please!) as I am currently working on a project that involves combining working in both, the MCUXpresso IDE and the VSC.
LikeLiked by 1 person
Hi Ralf,
great that you are already aware of the series! I have limited time for new articles because it is the ‘hot’ phase with lots of exams at the university which keeps me very busy, but I plan to continue the series as soon as possible. PIO is for sure great for everyone coming from Arduino. As for myself, I’m not coming from the Arduino land so this did not show any benefit to me. Yes, PIO seems to support lots of platforms but that was not relevant for me: I tried to use it for my realtime and industrial applications and somehow it did not fit.
LikeLike
I have a Debian 10 Linux machine, in fact a VM, with esp-idf installed and I’m using Eclipse with the Expressif IDF Plugins working with no issue so far. I have not configured the HW debugger there.
I also tried VSC + PlatformIO on windows and it did not work for me. Neither basing it in esp-idf tools nor basing it in the Arduino tools.
Probably I’m too used to the full IDEs I know (CodeWarrior, KDS, Eclipse, IAR, uVision, etc.) that failing in my first and only attempt to get VSC+PIO working just discouraged me from continuing with that line of doing.
LikeLiked by 1 person
Hi,
Great post! For me, I ony got the Jtag scan fail error with J-Link and usb blaster. I guess some multiple gpio prevent jtag. Did you erase esp32 flash before jtag debug ?
LikeLiked by 1 person
Hi,
thank you for the feedback! Yes, in case the existing/running application on the ESP32 uses the JTAG pins, you won’t be able to connect/debug it. What I’m doing in such a case is using the ESP32 bootloader over UART to load a simple (the ‘hello world’) IDF application which does not use any pins: after that I can use the JTAG debugger.
I hope this helps?
Erich
LikeLike
Unavailable resetting or halting cpu with jtag was the root proble I thought, because I could not connect the debugger with the chip soldered myself(w/o USB) other than the dev kit. In that case Is manual resetting effective ? Or does it come from the wrong jtag reset configuration ?
LikeLiked by 1 person
Are you using OpenOCD? I have frequently the problem that OpenOCD is not able to halt the processor if it is constantly resetting, because OpenOCD is very slow, and not fast enough to halt the processor fast enough. As for the reset: check if you have pull resistors too strong or added too much of of a C to the reset circuit which can slow down the reset too.
LikeLike
Hi Erich,
Thank you for your quick reply.
Yes, openocd-esp32 on Linux. Little bit hard to modify compile error.
After the flashing hello world or erase-flash, I got
Info : clock speed 1000 kHz
Info : JTAG tap: esp32.cpu0 tap/device found: 0x00000007 (mfg: 0x003 (Fairchild), part: 0x0000, ver: 0x0)
Warn : JTAG tap: esp32.cpu0 UNEXPECTED: 0x00000007 (mfg: 0x003 (Fairchild), part: 0x0000, ver: 0x0)
Error: JTAG tap: esp32.cpu0 expected 1 of 1: 0x120034e5 (mfg: 0x272 (Tensilica), part: 0x2003, ver: 0x1)
crazy.
Anyway, it seems there was no decent jtag communication with this bode.
LikeLiked by 1 person
You are right, this does not look right. It should not give you something different than a Tenscilia for an ESP32. I would check with a different machine (Windows, if possible, with a pre-built OpenOCD), additionally with a solid breakout board to single out hardware/connection issues.
I hope this helps.
LikeLike
My logic analyzer did not show any decent jtag protocols(tdi,tdo) from the chip. Should I add -c option to openocd to reset the target, or j-link logic voltage level issue or …
$ openocd-esp -f interface/jlink.cfg -f target/esp32.cfg -c “init; reset halt”
LikeLiked by 1 person
you can try that, but I don’t think it will help. Get a prebuilt OpenOCD and try with that one.
LikeLike
Thank you for your reply. I noticed there is ~/.espresif/tools/openocd-esp32/. Is this what your mean prebuild openocd ? Or idf.py openocd ? But idf.py openocd gave me the error came from the default wrong interface selection(ftdi). I can’t change this for now. As for the .espressif tool openocd direct, just gave me the error as follows,
~/.espressif/tools/openocd-esp32/v0.11.0-esp32-20211220/openocd-esp32/bin/openocd -f interface/jlink.cfg -f target/esp32.cfg -c “init ;reset halt”
Open On-Chip Debugger v0.11.0-esp32-20211220 (2021-12-20-15:42)
Licensed under GNU GPL v2
For bug reports, read
http://openocd.org/doc/doxygen/bugs.html
Info : J-Link V9 compiled May 7 2021 16:26:12
Info : Hardware version: 9.40
Info : VTarget = 3.875 V
Info : clock speed 1000 kHz
Info : TAP esp32.cpu0 does not have valid IDCODE (idcode=0x0)
Info : TAP esp32.cpu1 does not have valid IDCODE (idcode=0x0)
Info : TAP auto0.tap does not have valid IDCODE (idcode=0x0)
Info : TAP auto1.tap does not have valid IDCODE (idcode=0x0)
:
Please ignore the wrong VTarget voltage because I connect j-link vsupply to the board ldo regulator(5v pin w/o usb connected), and connect j-link vtref to the 3.3v of the esp32 dev kit c board. If you mean prebuild openocd on the win, I don’t have any tools for now. Of course I added a line ‘adapter speed 1000’ in the esp32.cfg.
LikeLiked by 1 person
I was under the impression that you had a custom OpenOCD/built it yourself. So using the IDF one from Espressif is the right thing to use, because Espressif updated/changed it to support the ESP32. What J-Link are you using? I noticed that it only worked for me with the ‘large’ EDU version, not with the mini one for some unknown reasons. Other than that, I recommend you try with an FDDI connection (see for example https://mcuoneclipse.com/2019/11/09/open-source-ftdi-ft2232-jtag-and-uart-adapter-board/) or better use the ESP-Prog (https://docs.espressif.com/projects/espressif-esp-iot-solution/en/latest/hw-reference/ESP-Prog_guide.html) which I’m using too.
LikeLike
Thank you for your quick reply. I’m using the segger j-link edu. And no problem with this adapter for stm32f1, f4, and nxp. As for the custom ocd, hmmm, .espressif ocd-esp32 might be the genuine binary tool except adding a adapter speed modification. I have read your article, thanks. After reading your article, I got the openocd-esp32 on the espressif git and compiled. Until then, as I’m esp32 newbie and I couldn’t believe jtag on a so tiny chip. Anyway I found the espressif ocd-esp32 binary. And this is too difficult for me. I’m waiting for the esp-prog and a adafruit ft232r board delivery. Until then, I’m going to try pull up or pull down according to the segger’s j-link manual. It seems my esp32 completely ignore the jtag tap signal.
LikeLiked by 1 person
I have the J-Link EDU working with the ESP32, but not the J-Link EDU mini. I have contacted SEGGER, but they where puzzled by this too, but because ESP is not officially supported, they were not able to help much. And yes, the J-Link work very, very well for all my NXP and STM devices too, but they are mostly using SWD and not JTAG as the ESP32.
LikeLike
I have never seen such a large edu. I have grey small one. And I guess both Segger and Espressif, I don’t know well though, just only tell us to ask their communiy site.
For sure I have met reseting issues with swd or jtag so far. In such case, after checking connectionsI could succeed. But this time it is too difficult. My esp32 ignore jtag and I don’t know well about ESP architecture. That is why I want to study the chip. No way :-).
I really apreciate your kindful help. I’m going to try various connections. I would post here if I could succeed. Thank you. Have a nice day.
LikeLiked by 1 person
Great, thank you.
LikeLike
> It did *not* work with a J-Link EDU mini (not really sure why?).
I wonder if it is because of the WinUSB requirement. Segger’s wiki only mentions it being supported for EDU v11. It is not mentioned for the EDU Mini (so I assume it’s not supported?)
See: https://wiki.segger.com/J-Link_Model_Overview#J-Link_EDU
LikeLiked by 1 person
That’s an interesting angle and point! I was able to connect, but later it gave errors and did not work. So I assumed it must be something with the electrical signals or with the timing/performance.
LikeLike
Hello Erich, I’m using a ESP32-S2-DevKitM-1R with a Jlink-EDU. I did all steps but got stuck in this one and got this error about halt target:
D:\Worspace-ESP\dsaaf>openocd -f interface/jlink.cfg -f target/esp32s2.cfg -c “program_esp build/dsaaf.bin 0x10000 verify exit”
Open On-Chip Debugger v0.11.0-esp32-20211220 (2021-12-20-15:43)
Licensed under GNU GPL v2
For bug reports, read
http://openocd.org/doc/doxygen/bugs.html
Info : J-Link V10 compiled Aug 9 2021 10:30:48
Info : Hardware version: 10.10
Info : VTarget = 3.219 V
Info : clock speed 1000 kHz
Info : JTAG tap: esp32s2.cpu tap/device found: 0x120034e5 (mfg: 0x272 (Tensilica), part: 0x2003, ver: 0x1)
Info : esp32s2: Core was reset.
Info : starting gdb server for esp32s2 on 3333
Info : Listening on port 3333 for gdb connections
Info : JTAG tap: esp32s2.cpu tap/device found: 0x120034e5 (mfg: 0x272 (Tensilica), part: 0x2003, ver: 0x1)
Error: esp32s2_soc_reset: Couldn’t halt target before SoC reset
** Unable to reset target **
shutdown command invoked
What could be wrong? Is the target OK?
LikeLiked by 1 person
The target looks ok, but I have to admit I have not used any of the s2 parts on my side yet. What I notice is that the J-Link firmware you are using looks somewhat outdated from 2021. I suggest that you update the firmware.
LikeLike
Any information on whether this will work on J-link Base (and Base Compact)?
The website says it’s identical to ‘big’ J-link Edu, and also the big Edu version seems discontinued
LikeLike
I can confirm that it works with the J-Link EDU (big white box) or the J-Link BASE (same box, but black). But not with the J-Link EDU Mini.
I heard that the J-Link EDU (white box) should be available again?
LikeLike