
It is great if vendors provide a starting point for my own projects. A working ‘blinky’ is always a great starter. Convenience always has a price, and with a ‘blinky’ it is that the code size for just ‘toggling a GPIO pin’ is exaggerated. For a device with a tiny amount of RAM and FLASH this can be concerning: will my application ever fit to that device if a ‘blinky’ takes that much? Don’t worry: a blinky (or any other project) can be easily trimmed down.

Binky on NXP LPC845-BRK Board
I use a ‘blinky’ project here just as an example: the trimming tips can apply to any other kind of projects too.
For this tutorial I’m using the NXP LPC845 on the BRK (breakout) board:
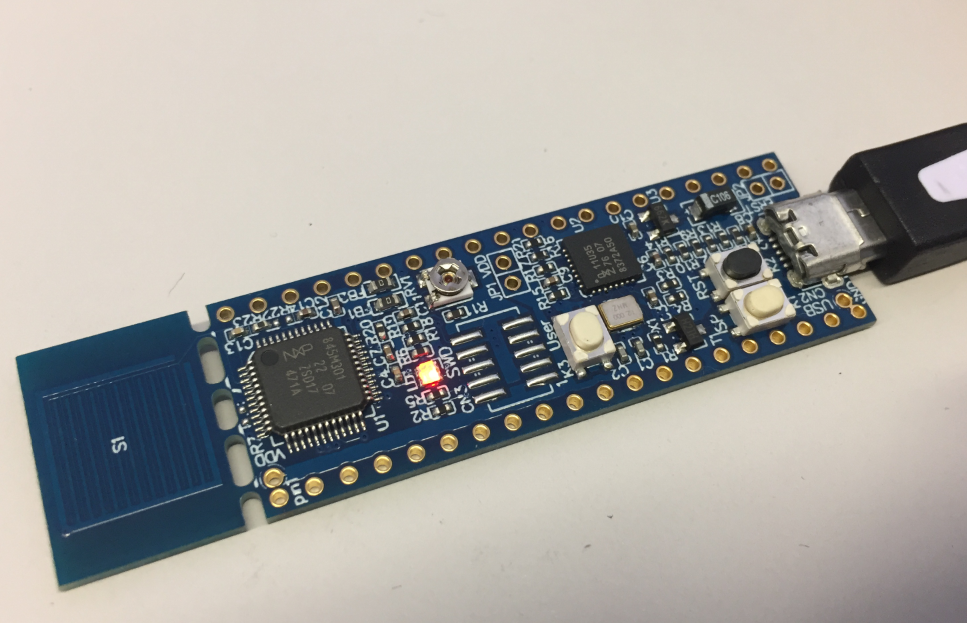
NXP LPC845-BRK Board
Blinky
I’m using the Eclipse based NXP MCUXpresso IDE:

SDK board selection
I have created the ‘blinky’ project with the vendor default settings:

blinky
A ‘blinky’ is supposed to blink a LED, just a good starter for any project. Building that rather minimal project gives this as code size:
Memory region         Used Size  Region Size  %age Used
   PROGRAM_FLASH:       10536 B        64 KB     16.08%
            SRAM:        2424 B        16 KB     14.79%
That information is shown in the console that way too, divided up in text, data and bss:
   text	   data	    bss	    dec	    hex	filename
  10532	      4	   2420	  12956	   329c	lpc845breakout_led_blinky.axf
10K for a blinky looks exaggerated. But we are going to trim this now in the next steps.
Size Information
For the meaning of the size information, have a read at “text, data and bss: Code and Data Size Explained“. The normal way to see what is using space on my device is to check the linker map file (*.map):
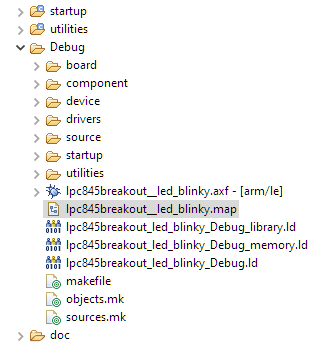
Linker Map File
But that map file is rather hard to read and more for the experts: it lists the sections with the address and size:
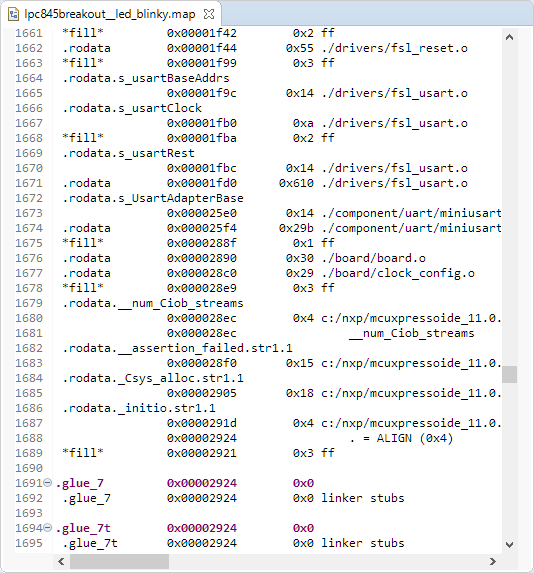
Linker Map File Content
With the MCUXpresso IDE V11, there is a nice ‘Image Info’ view which is basically a better viewer for the map file information:
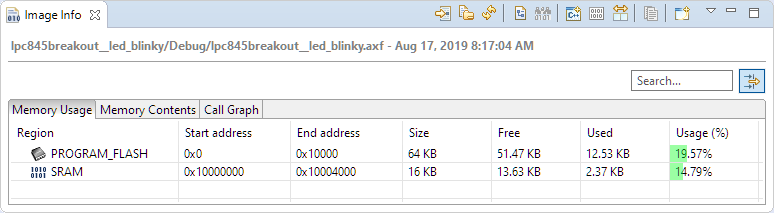
Image Info View
I can filter and sort the data which gives me an idea how much space is used for code and data:
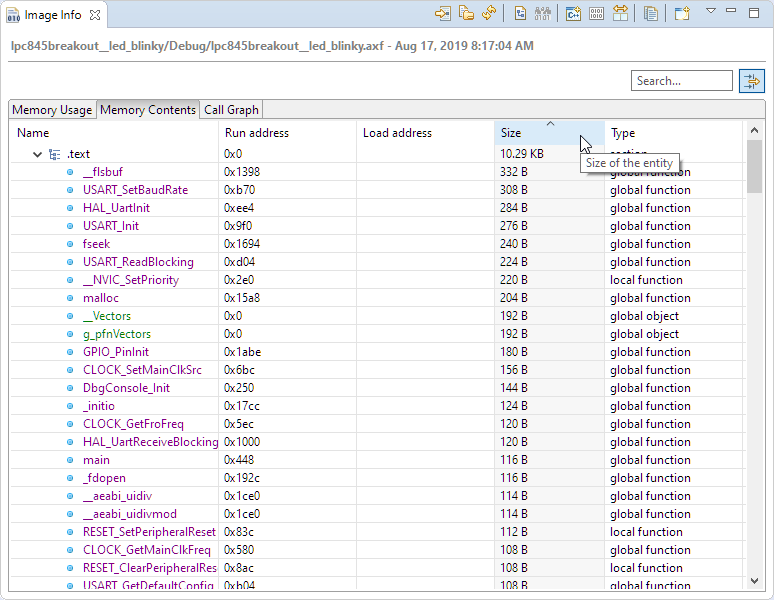
Image Info Memory Content
Of course it requires some knowledge about what the application is supposed to do. I always go through that list of items in the view to see if there is anything there I would not expect: maybe the application is using something which can be removed.
Source Code
For a simple blinky, that is rather not small. The first thing is to check what the program is doing. The main.c has this:
/*
 * Copyright 2017 NXP
 * All rights reserved.
 *
 * SPDX-License-Identifier: BSD-3-Clause
 */

#include "board.h"
#include "fsl_gpio.h"

#include "pin_mux.h"
/*******************************************************************************
 * Definitions
 ******************************************************************************/
#define BOARD_LED_PORT 1U
#define BOARD_LED_PIN 2U

/*******************************************************************************
 * Prototypes
 ******************************************************************************/

/*******************************************************************************
 * Variables
 ******************************************************************************/
volatile uint32_t g_systickCounter;

/*******************************************************************************
 * Code
 ******************************************************************************/
void SysTick_Handler(void)
{
    if (g_systickCounter != 0U)
    {
        g_systickCounter--;
    }
}

void SysTick_DelayTicks(uint32_t n)
{
    g_systickCounter = n;
    while (g_systickCounter != 0U)
    {
    }
}

/*!
 * @brief Main function
 */
int main(void)
{
    /* Define the init structure for the output LED pin*/
    gpio_pin_config_t led_config = {
        kGPIO_DigitalOutput,
        0,
    };

    /* Board pin init */
    BOARD_InitPins();
    BOARD_InitBootClocks();
    BOARD_InitDebugConsole();

    /* Init output LED GPIO. */
    GPIO_PortInit(GPIO, BOARD_LED_PORT);
    GPIO_PinInit(GPIO, BOARD_LED_PORT, BOARD_LED_PIN, &led_config);

    /* Set systick reload value to generate 1ms interrupt */
    if (SysTick_Config(SystemCoreClock / 1000U))
    {
        while (1)
        {
        }
    }

    while (1)
    {
        /* Delay 1000 ms */
        SysTick_DelayTicks(1000U);
        GPIO_PortToggle(GPIO, BOARD_LED_PORT, 1u << BOARD_LED_PIN);
    }
}
Basically the code is initializing the pins, clocks, sets up the SysTick timer and then does the ‘blinky’ in a loop, using the Systick counter to delay the blink period.
Debug Console
But what I can see is that it initializes a debug console (and the UART hardware for it):
BOARD_InitDebugConsole();
Getting rid of that gets us down to:
Memory region Used Size Region Size %age Used
PROGRAM_FLASH: 5616 B 64 KB 8.57%
         SRAM: 2400 B 16 KB 14.65%
💡 Look for functions which get called but not used. In many cases demo applications setup some communication channels, but then they are not used. The linker does a good job removing unused objects (functions/variables), but only if they are not referenced.
Semihosting and printf()
The next thing to look at is if there is any semihosting or printf(). The project is using the ‘Redlib’ which is an optimized library compared to the ‘standard’ newlib or the smaller-standard newlib-nano:
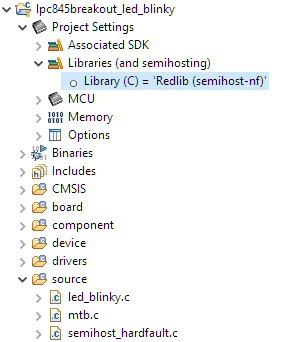
Redlib
Still, that library might add-up to the code size because it is using semihosting (sending messages through the debugger). Looking at the Memory view I can see all these standard I/O functions needed for that directly or indirectly:
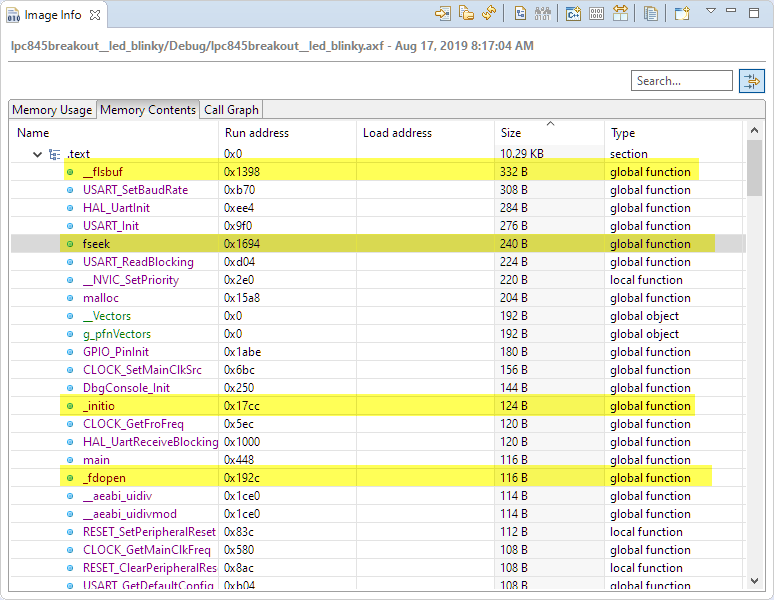
stdio functions
Having all the hooks for that functionality only makes sense if using it, and this is not used by the ‘blinky’. So getting rid of that semihosting and all the unused standard I/O means to use the ‘none’ variant:
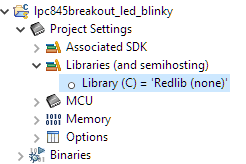
Library without standard I/O
This gets us down to this:
Memory region         Used Size  Region Size  %age Used
   PROGRAM_FLASH:        3372 B        64 KB      5.15%
            SRAM:        2208 B        16 KB     13.48%
💡 avoid using printf() and all its variants, including semihosting. Or use a smaller variant or implementation. See the links at the end of this article for more background on this.
DEBUG and NDEBUG
The next thing is to check the compiler defines if they have the DEBUG listed. And indeed, this is the case:
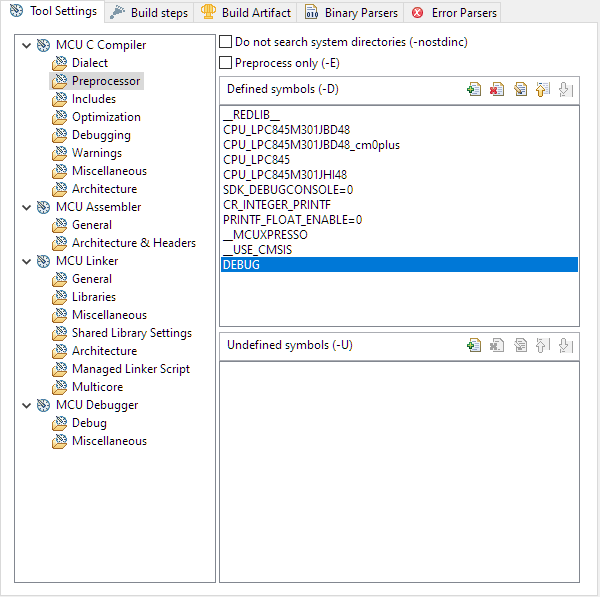
DEBUG define
With that define set, there is a lot of extra code in the SDK and example drivers which checks for good values with the ‘assert()’ macro:
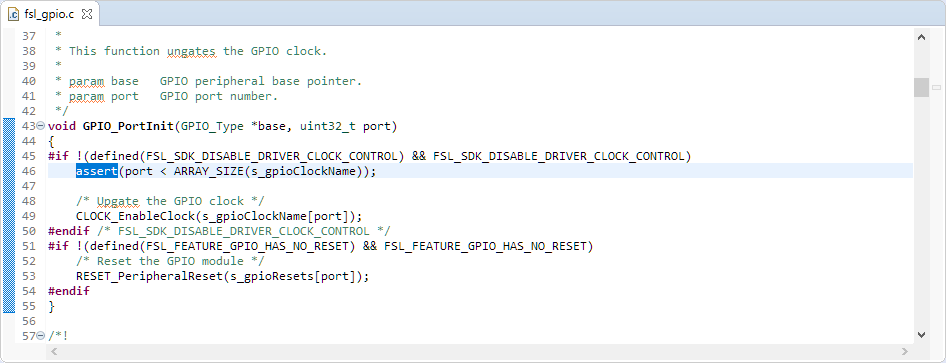
Assert() usage in SDK code
Here again the Image information view is helpful: it shows me all the places where assert() is used:
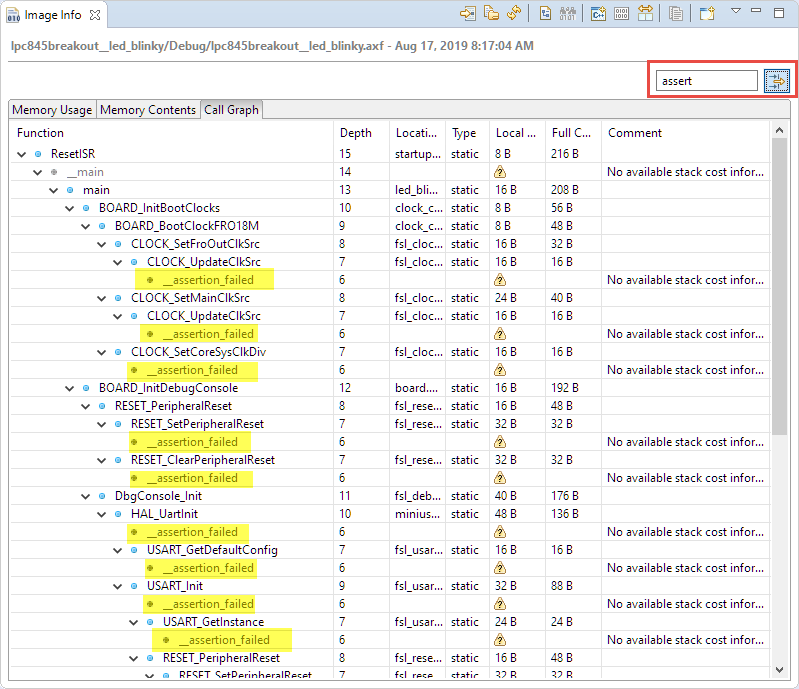
assert usage
It is actually a good practice to have asserts in the code to catch programming errors early. But all the assert() code really adds up. To turn off the extra code (and safety belt!), I change the macro to NDEBUG:
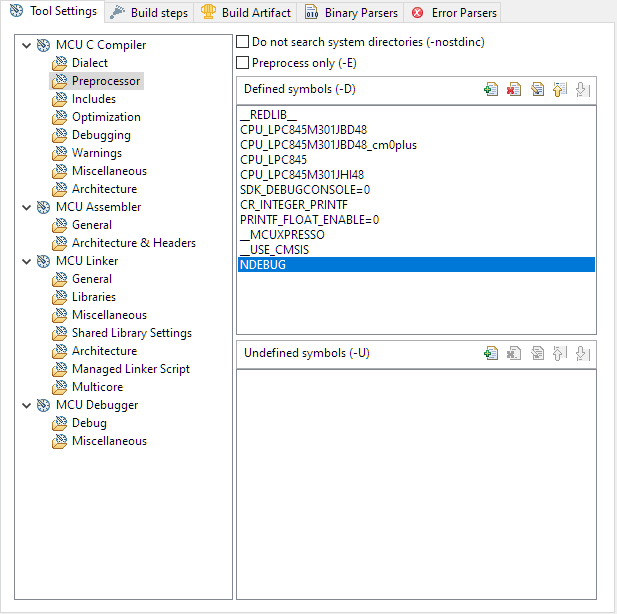
NDEBUG
This gets us down to this:
Memory region         Used Size  Region Size  %age Used
   PROGRAM_FLASH:        3144 B        64 KB      4.80%
            SRAM:        2208 B        16 KB     13.48%
Interrupts and Vectors
Again the Image Info view is a good starting point. I’m checking the used interrupts. The Blinky is using the SysTick interrupt which is expected. But there are still UART interrupts used?
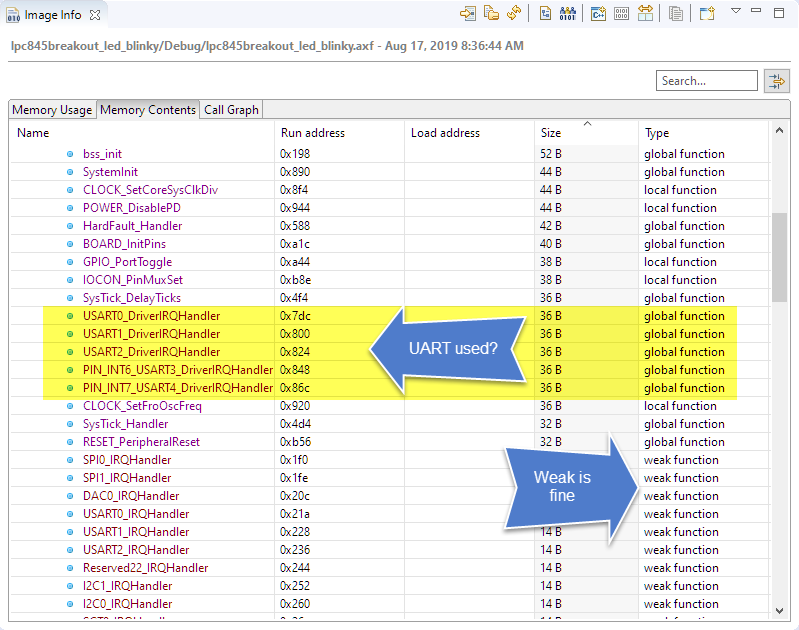
Interrupts used
Most interrupts are implemented as ‘weak’: implemented as default/empty, which can be overwritten by the application. But the UART ones do not make sense, as the blinky is not using any UART communication?
It turns out that the NXP SDK has the UART transactional API turned on by default:
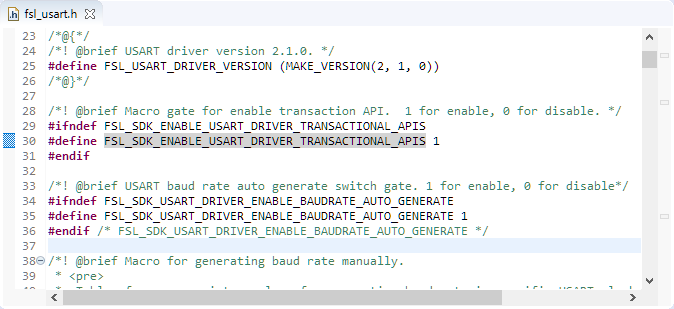
UART Transactional API setting
The transactional API allows to send/receive UART data in communication chunks/transactions. But we don’t need that in our blinky, so let’s turn it off:

Turning Off UART Transactional API
Which gives:
Memory region         Used Size  Region Size  %age Used
   PROGRAM_FLASH:        2964 B        64 KB      4.52%
            SRAM:        2184 B        16 KB     13.33%
💡 There would be now the option to remove CMSIS support which adds up about 300 bytes to the above code. But I consider that CMSIS (setting interrupt priority, common clock settings) as very useful, so I don’t touch it here. The largest function in the application is the one used by the SysTick code to set the priority of the timer to the lowest priority which would save another 220 bytes:
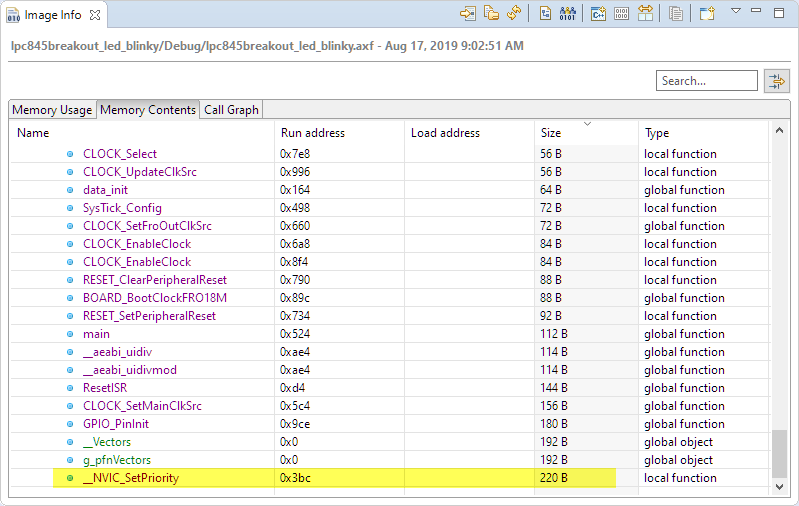
CMSIS as largest single function code size contributor
Optimizations
So far I have stripped off unwanted or unused functionality. Next I could turn on compiler optimizations. By default, the project is setup to -O0:

Compiler Optimizations
-O0 means no optimization: code is straight forward and easy to debug.
-O1 mainly optimizes the function entry/exit code and is able to reduce code size a bit without really impacting debugging. In this example it cuts down code size by half!
Memory region         Used Size  Region Size  %age Used
   PROGRAM_FLASH:        1540 B        64 KB      2.35%
            SRAM:        2184 B        16 KB     13.33%
-O2 optimizes more and tries to keep things in registers as much as possible. Because the functions in the applications are rather small, the improvement is not that big:
Memory region         Used Size  Region Size  %age Used
   PROGRAM_FLASH:        1516 B        64 KB      2.31%
            SRAM:        2184 B        16 KB     13.33%
-O3 optimizes the most with extra inlining. -O3 is targeting speed, so no wonder the code size increases again:
Memory region         Used Size  Region Size  %age Used
   PROGRAM_FLASH:        1792 B        64 KB      2.73%
            SRAM:        2184 B        16 KB     13.33%
The best option for code size optimization is -Os (optimize for size):
Memory region         Used Size  Region Size  %age Used
   PROGRAM_FLASH:        1456 B        64 KB      2.22%
            SRAM:        2184 B        16 KB     13.33%
That looks now pretty reasonable! Of course there are now ways to cut off more for a ‘bare-bare-blinky’, but everything in place (startup code, clock and GPIO initialization) makes sense for a real application, so I stop here now.
RAM: Heap and Stack
What does not look right is the SRAM usage. The ‘heap’ is using a big chunk:
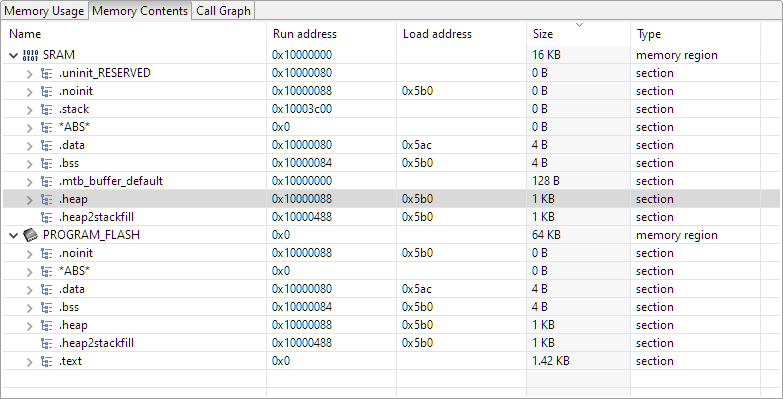
heap memory usage
That heap is used for dynamic memory allocation (malloc()). The general rule for embedded programming is to avoid it. But it is here by default. It can be turned off in the linker settings: The demo uses 1K for heap and stack each. As I’m not using malloc(), I can set the heap size to 0x0. For the reserved stack that really depends on the applications. On ARM Cortex the MSP is used for the startup/main and for the interrupts (see “ARM Cortex-M Interrupts and FreeRTOS“). 0x100 (256 bytes) should be plenty for my blinky.

Heap and Stack Size
This gets me down to this:
Memory region         Used Size  Region Size  %age Used
   PROGRAM_FLASH:        1456 B        64 KB      2.22%
            SRAM:         392 B        16 KB      2.39%
If it is about reducing the stack size further, I can look at the Call Graph information which gives me information about how much stack space is used:
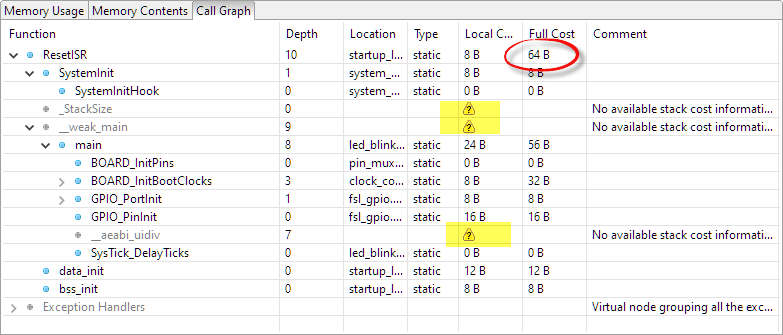
Call Graph with Stack Size
There are a few items with unknown size information (marked with a ‘?’) because they are in the library. A way to verify the real stack usage would be to write a pattern (e.g. 0xffff’ffff) and then run the application for a while:
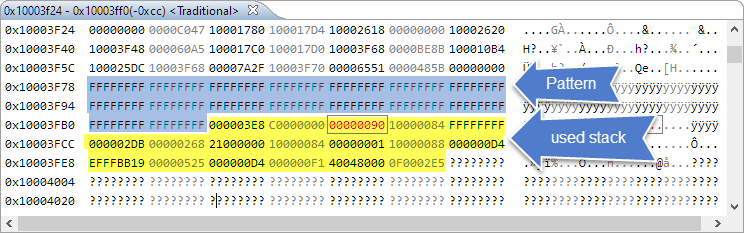
Used Stack
This shows that 72 bytes are actually used. With a bit of a margin, setting the stack size to 128 bytes in this case looks reasonable. This gives:
Memory region         Used Size  Region Size  %age Used
   PROGRAM_FLASH:        1456 B        64 KB      2.22%
            SRAM:         264 B        16 KB      1.61%
💡 Be really careful with this! Stack overflows are the probably the most common problem in embedded applications. If you can, give as much RAM you can spend for the stack. If cutting the size down, make sure you did enough analysis to justify your stack size.
MTB
There is one thing left which uses RAM space: the MTB buffer. The Micro Trace Buffer is used for tracing which can be very useful (see “Debugging ARM Cortex-M0+ Hard Fault with MTB Trace“). The buffer can be disabled with a macro:
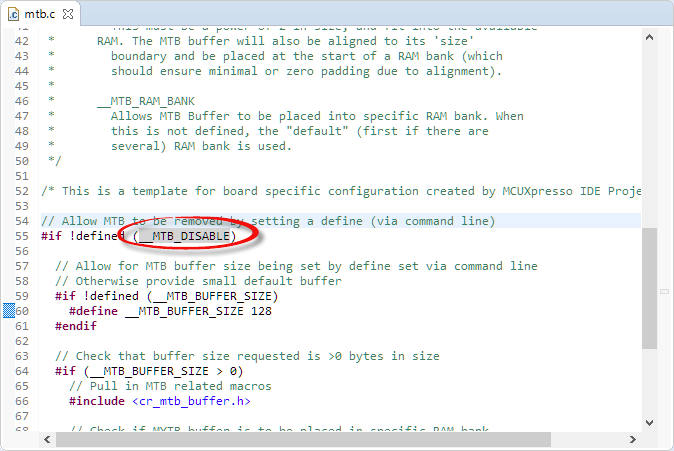
mtb.c
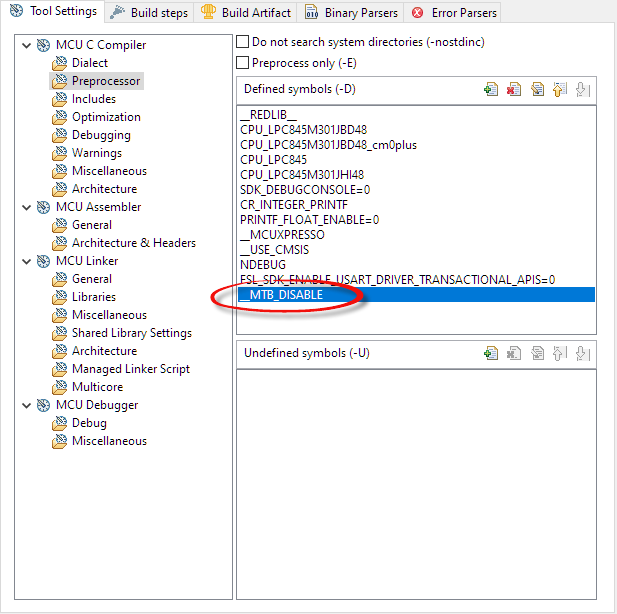
__MTB_DISABLE
Which gets me down to this:
Memory region         Used Size  Region Size  %age Used
   PROGRAM_FLASH:        1456 B        64 KB      2.22%
            SRAM:         136 B        16 KB      0.83%
I think here we can be happy 🙂
Summary
Vendor examples are great: they give me a good starting point. They are not optimized, and this is intentional. But they might come with features and functions I don’t need. Knowing different ways to optimize the application with cutting off features or tuning settings can be very useful to optimize RAM and FLASH usage. In this tutorial I showed how to bring a ‘blinky’ down to around 1KB Flash and around 136 bytes of SRAM. Of course this all depends on features and usage, but I think this is a pretty reasonable state now to add extra functionality for my application.
I hope these tips might be useful for your projects.
Happy Optimizing 🙂
Links
- text, data and bss: Code and Data Size Explained
- Unboxing the NXP LPC845-BRK Board
- Tutorial: Blinky with the NXP LPC845-BRK Board
- Semihosting (again!) with NXP Kinetis SDK V2.0
- Why I don’t like printf()
- XFormat, a Lightweight printf() and sprintf() Alternative
- Optimizing the Kinetis gcc Startup
- New NXP MCUXpresso Eclipse IDE v11.0

Erich, your articles are always informative. But this is probably the cleanest, neatest, easiest to understand overview of how to simply strip out unnecessary junk that I have ever read. Brilliant !
LikeLiked by 1 person
Thank you 🙂 ! I try to keep things understandable, but as a non-native speaker this is sometimes hard. And I always feel I might be too much in the details. But I always try to improve, so seems I’m on the right track.
LikeLike
From command line one can use:
arm-none-eabi-nm –print-size –size-sort –radix=d target.elf
It gives interesting result for STM32 HAL:
134218896 00001100 T HAL_RCC_OscConfig
More than 1k just for clock initialization! To be fair, this function configures 5 or 6 different clock sources.
LikeLike
indeed! It is all about compromises: code size increases with features or convenience too.
LikeLike
I’m with @Geoff Sokoll – Simply Brilliant ! I’ve been working on using zip in an embedded very low power (VLP) design and was looking at using a max32650, 1MB ram, VLP, now I’m back to using a MCU with support. I can’t find any LTE CAT M1 ‘stuff’ here, you need to try that environment.
LikeLike
Thank you!
LikeLike
Hi Erich, I have a problem of compilation in the linker file when I change the Redlib (Semihost) by Redlib (None) I change the properties in the header file in the project. I don’t know why doesn’t work in my LPC824, and this only have 32kB of Flash. Any suggestion?, and I tried to create a new project with this system library by default and I have the same problem with the linker, previously I check this blog https://community.nxp.com/thread/389104 and followed step by step his instructions. I’m using the last version of MCUXpresso.
Thanks.
LikeLike
What’s your error message? Keep in mind that if you use ‘none’ then no stubs for I/O read/write are provided. So if you are still using printf() and other I/O calls, the likely will fail at the link stage.
And you don’t have to follow the complicated steps in https://community.nxp.com/thread/389104, as I think they are outdated with the newer IDEs: you simply can right-click on the project and select the library you want, see https://mcuoneclipse.files.wordpress.com/2018/05/redlib-semihost-with-message-buffers.png?w=584&h=526
LikeLike
Sorry, I wanted to use sprintf () but Redlib (None) doesn’t support this. I found this post which also helped me. https://community.nxp.com/thread/389070
Thanks for your post Erich is great!!
LikeLike
Ok, great this has been sorted out.
LikeLike
Pingback: assert(), __FILE__, Path and other cool GNU gcc Tricks to be aware of | MCU on Eclipse
Erich, wonder if you’ve seen this … this week the “image info” panel removes the “memory usage” whenever I load the output AXF file. It’s there till the file is loaded. I’m sure it wasn’t doing this a couple weeks ago because I remember seeing the %full, but now it’s gone)
(running v11.2.1)
Thanks.
LikeLike
Ian,
no, I don’t see this. But I’m on 11.3.0 but not sure if it would make a difference. Does it happen for a brand new project too? What I could imagine that maybe there is something with the .axf section info causing the Memory Usage not showing the data. Maybe you see an indication of an exception in the .metadata/.log file?
LikeLike
Nothing in the .log file 😦
LikeLike
What are you running as host? I remember seeing an issue reported in the forums recently about a Mac OS graphic/graphic card problem.
Other than that, you might report the issue in the NXP forum with screenshots/etc so the engineering team could have a look.
LikeLike
I just found something perhaps to add to this list, since people reading it are likely trying to squeeze their project to make more space (like me!).
The Kinetis Flash memory starts at 0x0, but my default PE generated linker starts the .text section at 0x410 (after the cfmprotrom section). Interrupts only extend to 0xC0, so there is 832B unused flash in between. I added a new section to my linker and moved some big lookup-tables and other constants there. I’m not sure if/how I could put code there (in addition to in .text)
MEMORY {
m_interrupts (RX) : ORIGIN = 0x00000000, LENGTH = 0x000000C0
m_info (RX) : ORIGIN = 0x000000C0, LENGTH = 0x00000340 /* 0xC0 to 0x400 was unused (832B) */
m_cfmprotrom (RX) : ORIGIN = 0x00000400, LENGTH = 0x00000010
m_text (RX) : ORIGIN = 0x00000410, LENGTH = 0x000073F0
m_nvs1 (RX) : ORIGIN = 0x00007800, LENGTH = 0x00000400
m_nvs2 (RX) : ORIGIN = 0x00007C00, LENGTH = 0x00000400
m_data (RW) : ORIGIN = 0x1FFFFC00, LENGTH = 0x00001000
}
.info :
{
__vector_table = .;
. = ALIGN(4);
*(.tables) /* .tables section (extra section for constants like lookup-tables) */
. = ALIGN(4);
} > m_info
And in my source.c I added this to my long lookup-tables:
// Tables and such
const LEDstep_struct patterns[P_NUM_PATTERNS] __attribute__((section(“.tables”))) = LED_PATTERNS;
Now I magically have a lot more space for code and my DEBUG target doesn’t fail to link with .text overflowed error!
Are there any downsides to doing this?
LikeLiked by 1 person
Just be careful about the fixed bytes around $040E that set flash protection, etc
LikeLiked by 1 person
Hi Paul,
Yes, I have used that one too for PE projects and Kinetis. And as Ian pointed out: be careful with the flash protection area around 0x410. I believe the original memory map is that way to accommodate different devices easier, because the number of vectors and table entries depend on the device used. The MCUXpresso just defines one area for flash and manages this in the linker file. Either way works, as long the area around 0x400 does not brick the chipl
LikeLike