
A few days ago NXP has released a new version of their Eclipse IDE flagship: the MCUXpresso IDE v11.0.
NXP MCUXpresso IDE V11.0.0
The previous v10.3.1 was released back in Feb 2019, and the 11.0 now in June this year matches up with the Fall university semester. I appreciate that the releases are about every 6 months, so this gives me time to use it in my university lecture material and lab work. I had the weekend for trying it out, and I’m very pleased.
On a top level
There are lots improvements in this release for which the release notes are a good starting point. A few things noteworthy on the top level:
- The Eclipse framework has been moved to 4.10.0v201812 with CDT 9.6.0. As a consequence, this is now 64bit on Windows too. It runs on Windows (7,8,10), Ubuntu (16.04 & 18.04 LTS) plus on MacOS (10.11 or later).
- The ARM toolchain has been updated to GCC8 with the 2018q4-major release$
- The MCUXpresso Config tools have been integrated with version 6
- The IDE supports the latest NXP SDK 2.6 release
- Both SEGGER J-Link (v6.44i) and PEMicro debug probe (v4.13) software has been updated
- Extended support for Cortex-M33 based MCUs which includes SWO Trace
As always, the release notes and the user manual are a good source of information.
Below are some times which I have found very useful:
Develop Perspective
The default ‘Develop’ Eclipse perspective has an improved layout. There is is third column in the layout.
Develop Perspective
The ‘Outline’ and ‘Terminal’ views are now by default included in this perspective.
A new ‘Analysis’ menu gives an easy access to trace, SWO and Power views:
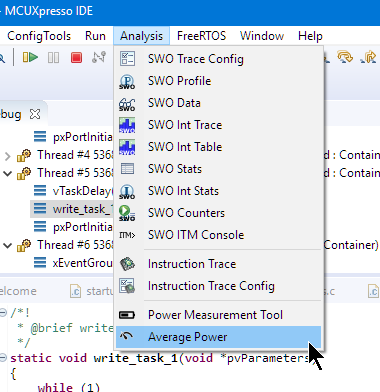
Analysis Menu
Image Info
This is a new feature/view in the MCUXpresso IDE. It is a kind of ‘super symbol browser’ and very useful to get an overview about the application. It works both for the image of a project or I can load an external image for analysis.
One tab shows the memory areas and how much they are used:
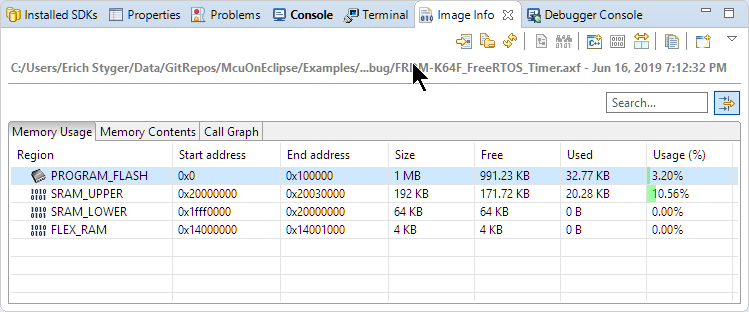
Image Info Memory Usage
The ‘Memory Content’ tab shows all the symbols, kind of super linker map file which can be sorted or I can search for items. Best of all: I can double-click on an item and it jumps to the source file for it (if applicable).

Image Info Memory Contents
If the application is compiled -fstack-usage, then it shows the call graph with the needed stack size (nice!):
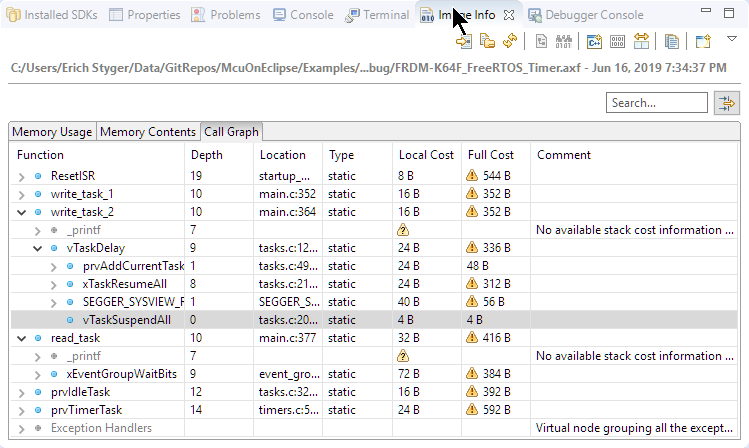
Image Info Call Graph
The view can even compare multiple binaries, very useful to find differences:
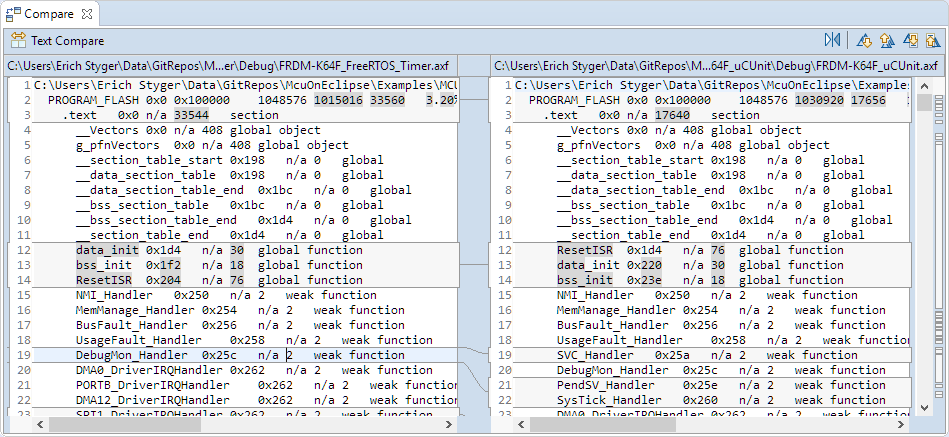
Comparing two images
Heap and Stack Usage
The MCUXpresso IDE already has excellent (even improved, see next) support for Heap and Stack usage for FreeRTOS projects, it features now as well a view for baremetal (no RTOS) heap and stack usage.

Heap and Stack Usage
Similar to the FreeRTOS views the allocation is shown with green/orange/red color bars. Using the green icon in the toolbar the data can be updated while the target is running. Technically this only works for the heap, as the stack pointer cannot be read by the debugger without halting the target. Which heap symbols are used for the heap monitoring can be configured in the project settings:

Heap Symbols
FreeRTOS
The FreeRTOS menu has been updated and shows up with new icons and all the supported views:
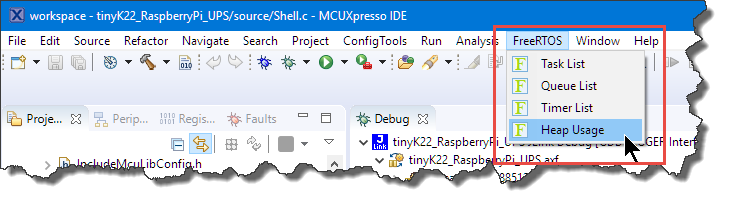
FreeRTOS Menu
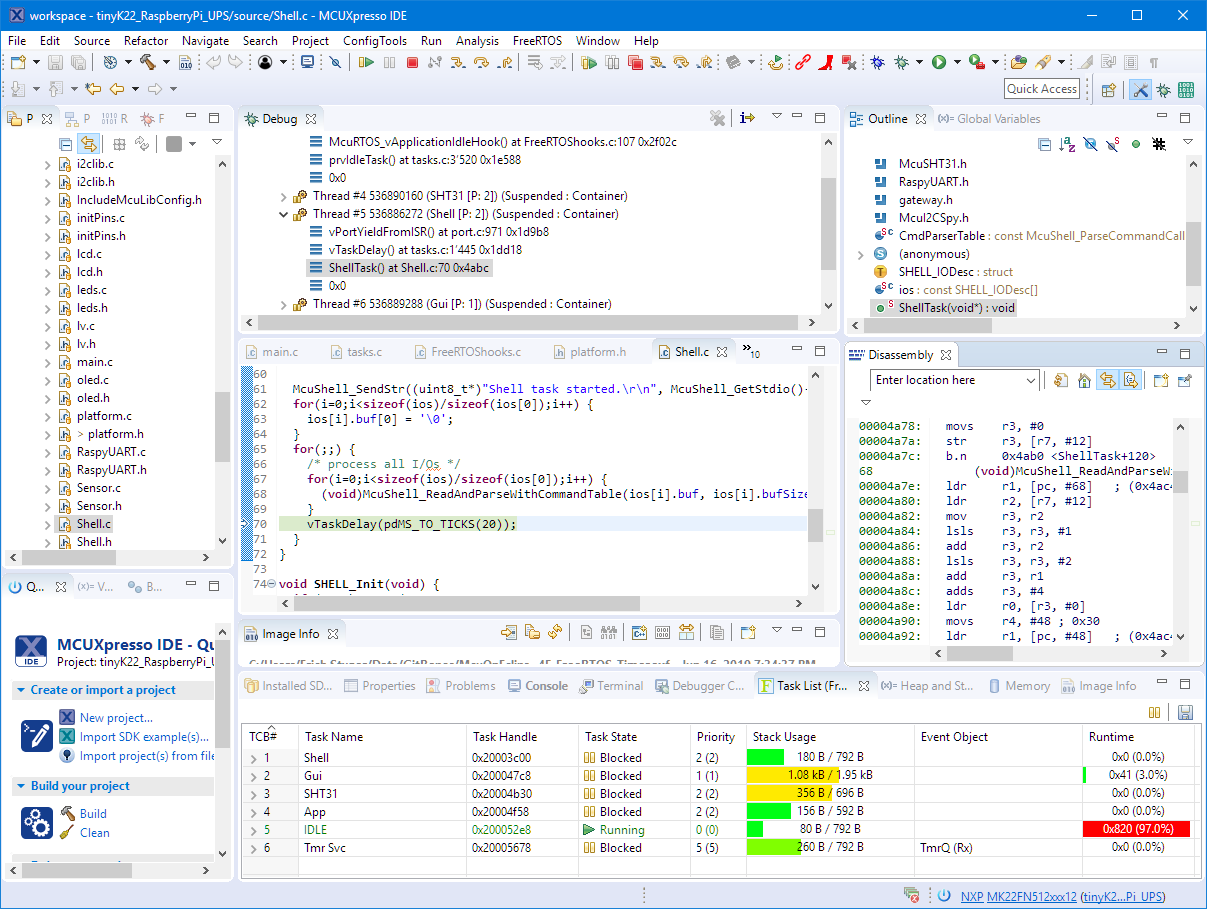
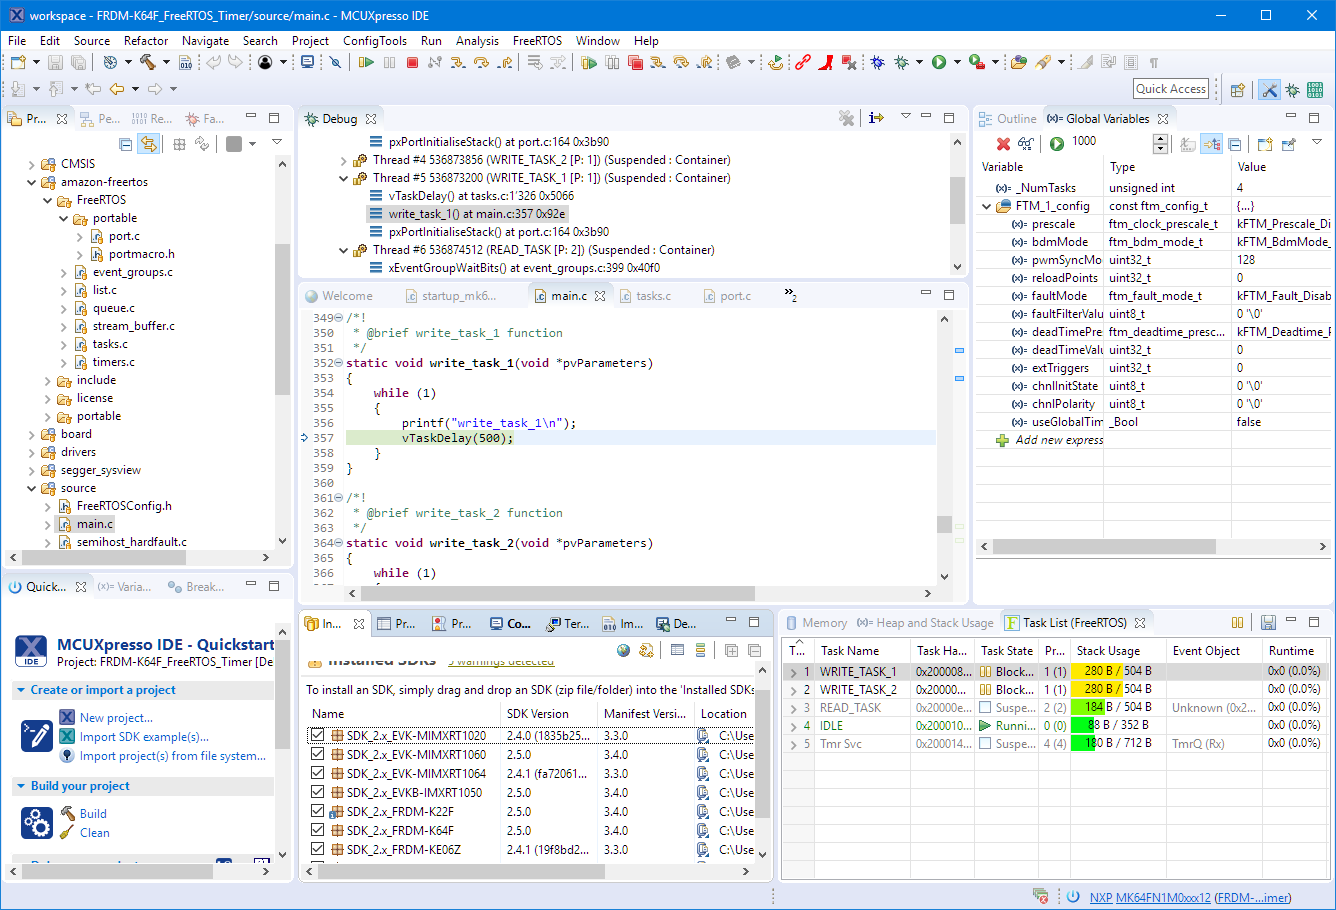
The views do support FreeRTOS V10. I’m using the latest and greatest FreeRTOS V10.2.1 and it works perfectly with all the different views.
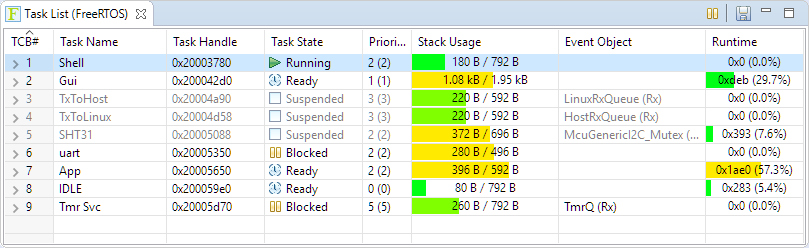
FreeRTOS Task List View
The FreeRTOS Queue List view supports shoing the queue data in the view, including semaphore and mutex:
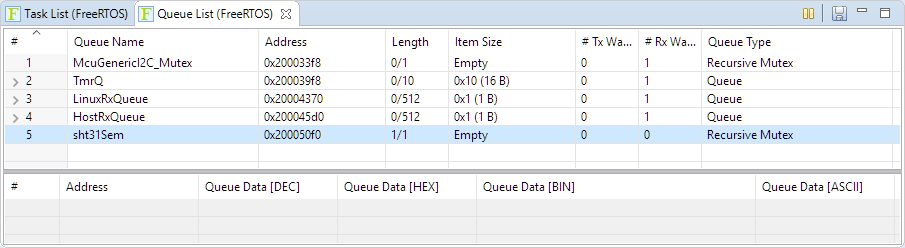
Queue List
The FreeRTOS timer list shows the status of the timer queue with the callbacks configured:

FreeRTOS Timer List
The Heap view supports all the standard FreeRTOS heaps:

FreeRTOS Heap View
It supports FreeRTOS Heap 5 (splitted memory heaps) as well:

FreeRTOS Heap 5 Support
Overall, the views look clean and integrate very well with the IDE.
For slow targets and debug connections, there is now a ‘timeout’ value setting in the IDE preferences:
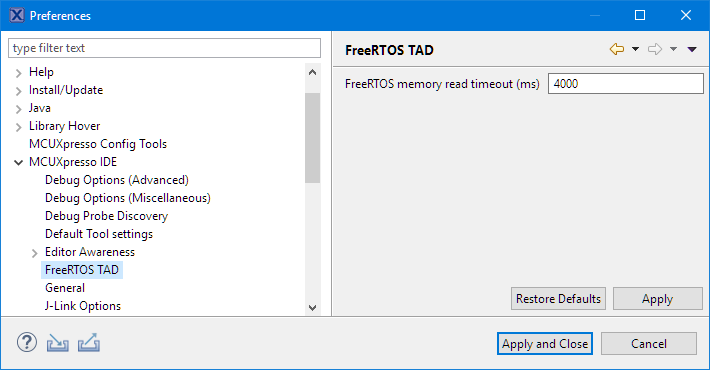
FreeRTOS Memory Read Timeout
Launch Configurations
The LinkServer (e.g. LPC-Link2) launch configuration is a new icon, and the configurations (as needed) get migrated to a new format:

Migrate Launch Configuration
More important, the settings have been overhauled and make it easier to select and find things, or is using standard Eclipse CDT settings to be uniform across different debug probes. This makes things like attaching to a target, configure the reset handling or custom startup behavior easier to configure.

LinkServer Launch Configuration
Editor Syntax Coloring
The new IDE includes editor color coding for the Linker map (.map) and command (*.ld) files:

Editor Coloring for Linker File
Both work together with the Outline view:

Map file with outline view
Live Variables
The support for live variables (including drawing graphs) is now supported for P&E and SEGGER debug probes in addition to the LinkServer connection:
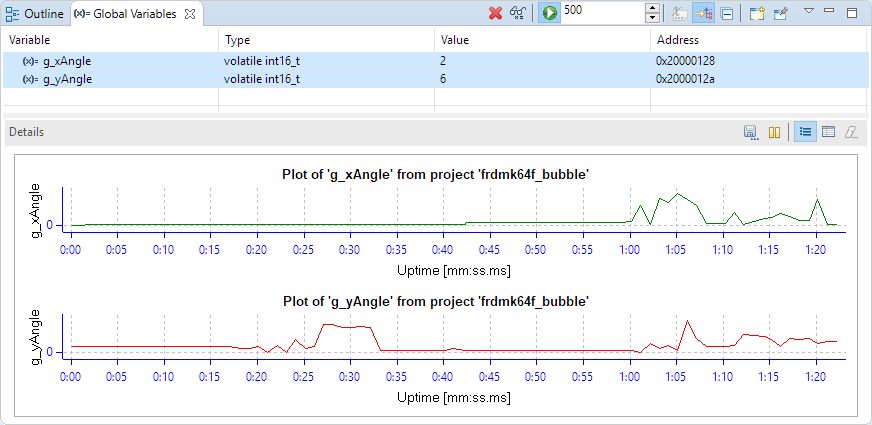
Live Variables
MCUXpresso SDK
The IDE supports the new SDK 2.6.0 which gets rolled out the same time.
The SDK components are now grouped in tabs and on the right there is a new summary pane:
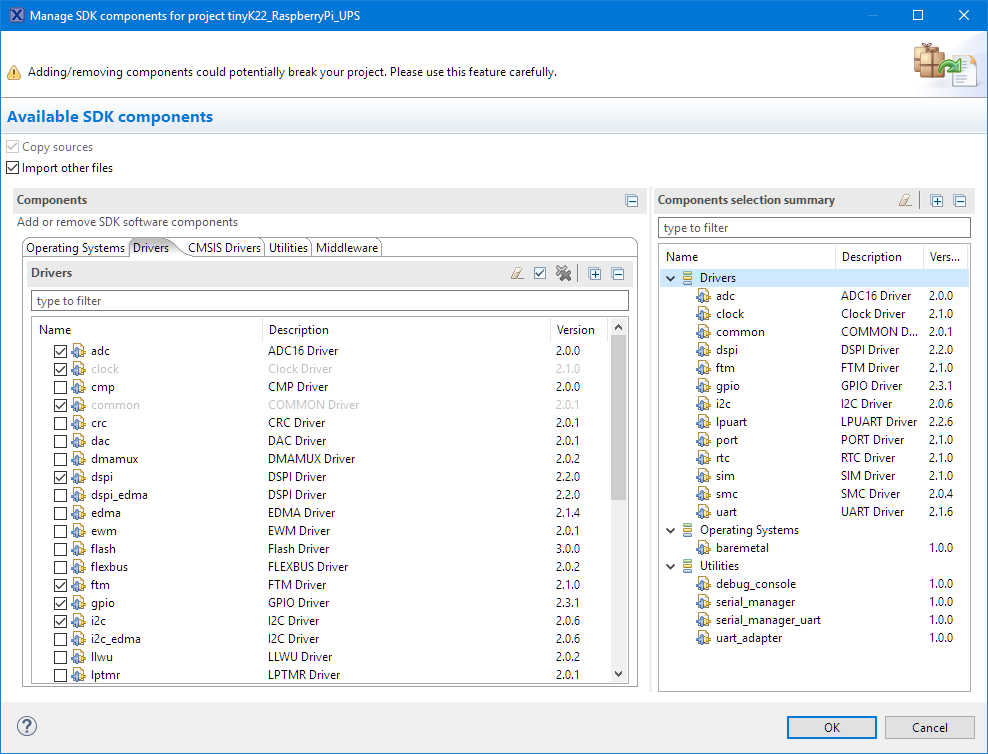
SDK Components
With a button, details of the SDK can now be put as hidden:

SDK Hide Details
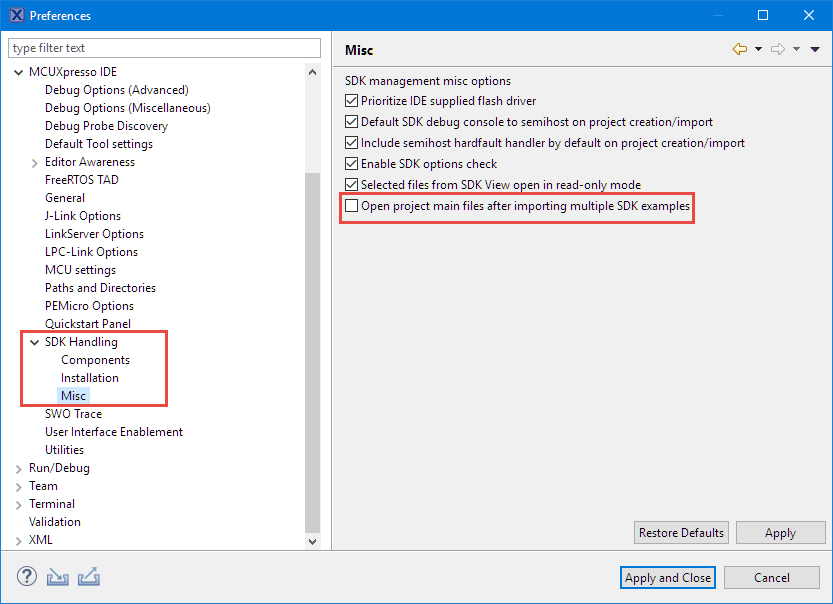
Creating or importing an SDK example now automatically opens the main file in the editor. This and other options can be configured in the IDE workspace settings:
SDK Options
Fixup Parsers
Another imporant thing with that IDE: it solves a long-standing (and most of the time hidden) issue with CDT and include path resolution, causing ‘unresolved include’ in the Eclipse Editor. There is now a ‘Fixup Parser’ project context menu which can be applied to such projects:

Fixup Parsers
Summary
I have been moved and used the new IDE for most of my projects (not all yet, because lack of time), and I have found no issues: the launch configurations get migrated, and that’s it. Installation of the IDE does not require uninstalling the previous version, and as a good practice I will keep the previous V10.3.1 for a while anyway.
The V11 of the MCUXpresso IDE is again a big step forward: new Eclipse version and 64bit, updated ARM toolchain, extended debugging support for P&E and Segger in addition to the LinkServer connection. The Global Variables view now supports live variables and graphing for P&E and SEGGER in addition to the LinkServer connection. The new views with the Build Analysis, Image Info, Stack usage and Call Analysis are very useful. And for bare metal applications it includes a heap and stack usage view too.
Happy Xpressing 🙂
Links
- MCUXpresso IDE web page: http://www.nxp.com/mcuxpresso/ide
- MCUXpresso SDK web page: http://mcuxpresso.nxp.com/
- Community article about the new release: https://community.nxp.com/community/mcuxpresso/blog/2019/06/14/new-mcuxpresso-software-releases-now-available

The 64bit demand is a problem here; we have tools (Visual Basic for one) that won’t run on 64bit so it looks like we’ll now be forced to have different machines for MCUXpresso and other work.
LikeLike
I was not aware that Visual Basic runs on 32bit only, interesting. The 64bit requirement comes from the latest Eclipse release trains which are 64bit only going forward.
You could stick with the IDE 10.3.1 for a while for sure, as an option. For sure better than having dedicated machine?
LikeLike
That’s what I’ll be doing for now (still 10.2 actually) but I worry eventually we’ll need support for a newer chip that requires updated MCUXpresso.
VB6 is what we use – compiled programs still run in 64bit Win10, but the IDE itself is really unhappy in that environment. I don’t really want to be rewriting 10-20 year old programs in a newer IDE but it looks like I might have to, some time.
LikeLike
You mention “standard Eclipse CDT settings to be uniform across different debug probes”; we use the additional file load feature of P&E debugger – is that still available? I hope the standard settings hasn’t eliminated it!
LikeLike
What this means (as far as I see) is that the ‘startup’ tab is now the same for all connections. And that features previouly only present for the LinkServer connection (e.g. flash tool) are for all other connections the same and supported. What is common to all connections is as well the ‘Other Symbols’ tab where I can specify multiple symbol files for the debug session.
So this is really about getting similar things to all the other debug probes.
As for the ability to load multiple binaries in the ‘main’ tab for P&E: this is still there and available 🙂
LikeLiked by 1 person
Hi Erich,
have you tried to use a Segger Jlink with this new version?
I wanted to debug my IMXRT1021, but the IDE always fails to launch the debug session:
“Failed to execute MI command: -exec-run”.
Did you notice any problems?
LikeLike
I have used it with a few (smaller) projects on the i.MX RT1052 (EVK, not the B version) so far, and did not notice any issues with using a SEGGER J-Link (external EDU probe).
But I have not tried it yet for the other i.MX RT I have.
LikeLike
Thanks for your comment! I use a J-Link EDU (V10.1) as well.
By accident I realized that projects without semihosting or with semihosting and NewlibNano work just fine.
It seems quite strange to me, but I will take a closer look. Pointing the IDE to a newer/older version of the J-Link tools or a newer gdb did not change anything.
LikeLike
I have had issues with MCUXpresso 11.0 using a Jlink debugger. I am trying to debug a new PCB with a KV11. I received the same error. “Failed to execute MI command: -exec-run”. I found by accident a work around but try this first. I have not tried this yet.
Remove all run debug settings in project settings in 11.0
Using the quickstart panel click the dropdown arrow on Jlink icon and select Debug using Segger J-Link probes. This should work.
If not, do the same procedure with MCUXpresso 10.3 and start a debug session.
This should create an entry in project Run/Debug Setting, close 10.3 and open 11.0 on the same project . Import the debug settings when asked.
LikeLike
agreed. At least in the past it helped me to delete the .launch file and let the IDE create a new one. It happend to me that I made some changes which resulted in bad behaviour. Another suggestion is to keep the project and its files in a version control system: that way I always see what has changed and I can revert changes easily.
LikeLike
Did u notice increase in memory usage of your project after upgrading to newest version? I got exactly the same optimalisation set, both on release and on 2 different mcuxpresso version i got 2 different memory usage, and it’s not slight difference, it’s more than 7k of memory.
LikeLike
There is a new ARM toolchain in that release, so it is natural that there might be some slight changes. 7K byte altough sounds large (but depends on your overall application size).
It might depend on the library you are using, and what functions (e.g. printf()) are used.
I did not notice any major size changes, it is more in the noise range. Just as a data point (newlib, but not using printf()), with -Os (Optimize for size):
V10.3.1:
text data bss dec hex filename
146880 2960 53080 202920 318a8 tinyK22_RaspberryPi_UPS.axf
V11.0.0:
text data bss dec hex filename
146904 2960 53080 202944 318c0 tinyK22_RaspberryPi_UPS.axf
So 24 bytes more code for a 140 KByte application.
You might need to have a look at the map file what makes the difference for you?
LikeLike
I just installed it and tried it on a project I just shipped to a customer. Went from 35% flash usage to 40%. This was for an LPC802 processor (a real headache job due to documentation errors).
LikeLike
Pingback: Black Magic Open Source Debug Probe for ARM with Eclipse and GDB | MCU on Eclipse
Pingback: Using Eclipse to Program Binary Files to an Embedded Target | MCU on Eclipse
Hello,
I am trying to study KV4 and KV5 Kinetis but having problem.
Coming from STM32 and used CubeMX, every init is done graphically.
After moving to MCUXpresso 11, the init especially for PWM is quite limited.
Then I found your tutorial on PWM using Processor Expert,
Is this still compatible to MCUXpresso 11?
Or is there anyway to configure the PWM graphically?
Or is it inside MCUXpresso, but I may have not dig in deeply?
LikeLike
Hello,
there are currently only a limited set of drivers and middleware supported by the graphical tool (NXP MCUXpresso Config tools), mostly UART or GPIO (this depends on the device used). I’m currently not using the KV4 or KV5, so really cannot comment on these devices much. Processor Expert still runs in MCUXpresso IDE 11, but requires some expert knowledge and an installation, described in https://mcuoneclipse.com/2017/04/09/mcuxpresso-ide-installing-processor-expert-into-eclipse-neon/. You better go with KDS (Kinetis Design Studio, legacy too) if you want to explore it. The KV3 and KV4 are present/listed in KDS 3.2.0, but not all devices as it seems. I guess the only way forward is to learn the SDK until NXP is providing full support?
LikeLike
Hello again. I cannot seem to find KV4.
How were you able to add KV4?
LikeLike
Are you using KDS V3.2.0? I do have KV40F, KV43F, KV44F, KV45F, KV46F and KV56F plus KV58F listed.
I believe they came with the the corresponding SDKs installed. Can you check as well the KDS update site?
Freescale KDS Update Site – http://nxp.com/lgfiles/updates/Eclipse/KDS
using Help > Install New Software
I see that at least the KV5x updates I have installed from the SDK folder C:\nxp\KSDK\SDK_1.3_MKV58F1M0xxx24\tools\eclipse_update
So look for such an ‘eclipse_update’ folder in your SDKs.
LikeLike
Hello
Sorry for many questions.
I installed first KSKD 1.3.0 and installed in the default location
C:\Freescale\KSDK_1.3.0.
Update KSD using KSDK_1.3.0_Eclipse_Update.zip located at
C:\Freescale\KSDK_1.3.0\tools\eclipse_update
After update my list of devices got more:
I also try what you suggested :
Freescale KDS Update Site – http://nxp.com/lgfiles/updates/Eclipse/KDS
using Help > Install New Software
The list says “all items are installed”
I still cannot find KV4 and KV5, how were you able to add those?
LikeLike
It seems I got at least the KV5 ones from the following SDK: SDK_1.3_TWR-KV58F220M
So you would have to install the SDK for the TWR-KV58F220M: https://www.nxp.com/support/developer-resources/evaluation-and-development-boards/tower-development-boards/mcu-and-processor-modules/kinetis-modules/kinetis-kv5x-mcu-family-tower-system-module:TWR-KV58F220M
LikeLike
Pingback: Visualizing Global Variables while Target is Running with Eclipse and MCUXpresso IDE | MCU on Eclipse
Pingback: Seeed Studio Arch Mix NXP i.MX RT1052 Board | MCU on Eclipse
Pingback: Restoring Default Firmware on Seeed Arch Mix NXP i.MX RT1052 Board | MCU on Eclipse
Pingback: Tutorial: How to Optimize Code and RAM Size | MCU on Eclipse
Pingback: Building and Flashing ESP32 Applications with Eclipse | MCU on Eclipse
Pingback: DIY Stepper Motor Clock with NXP LPC845-BRK | MCU on Eclipse
Pingback: Programming the ESP32 with an ARM Cortex-M USB CDC gateway | MCU on Eclipse
Pingback: NXP MCUXpresso IDE 11.0.1 available | MCU on Eclipse
Pingback: Investigating ARM Cortex® M33 core with TrustZone® – Setting up your environment and creating your first project with MCUXpresso IDE | MCU on Eclipse
Pingback: Stack Canaries with GCC: Checking for Stack Overflow at Runtime | MCU on Eclipse