
For some projects it is not possible to have the device under debug available on my desk: the board might be in another room, on another site or in a place where physical access is not possible or even dangerous. In that case an IP-based debug probe (see Debugging ARM Cores with IP based Debug Probes and Eclipse) is very useful: as long as I can access its IP address, that works fine. It is an excellent solution even if the board is moving or rotating: hook it up to a WLAN access point and I still can use it as it would be on my desk.
But what if I have a debug probe only connected to USB? This article shows how to turn a USB debug probe into a IP-based debug solution: that way I can easily debug a board from remote, connected to the network:

IP Based Debugging with USB Debug Probe
But IP-based debug probes are more expensive than USB based ones.
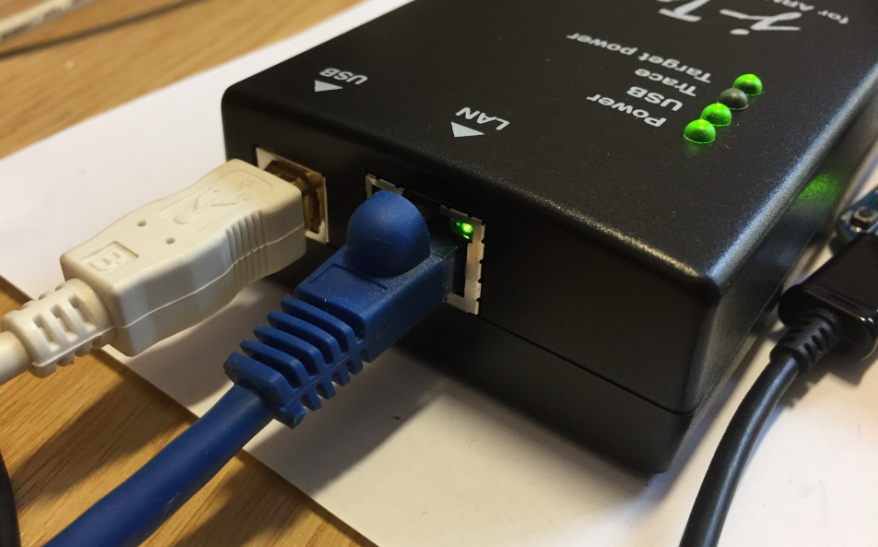
LAN Port
Such a probe is a very good investment, but what if you don’t have one available?
Overview
The block diagram below shows how to set up a remote debug connection to a board:
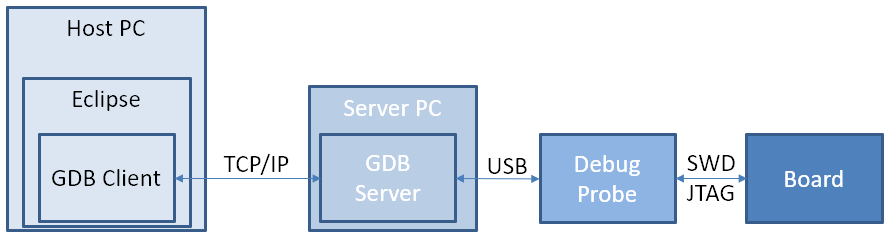
Remote Debugging
A server PC is configured to run a GDB server talking to the local (USB) Debug probe. With this, any host PC with Eclipse and GDB Client can connect to it over TCP/IP and debug the board.
Preconditions
All I need is:
- A SEGGER J-Link or P&E Multilink debug probe. This can any external probe or using an evaluation board debug probe circuit (e.g. J-Link OpenSDA or P&E OpenSDA)
- A host machine attached to this debug probe. That host machine needs to be accessible on the network
- Eclipse CDT with a J-Link or P&E support, e.g. the GNU MCU Eclipse plugins (they are used e.g. in NXP Kinetis Design Studio) or the NXP MCUXpresso IDE (I’m using 10.3.1 in this article)
Server PC
On the server PC I need to start the GDB server (see Command Line Debugging with GDB).
For Segger I can use the JLinkGDBServerCL (Command Line) or JLinkGDBServer (GUI). On Windows it uses a GUI which shows the configuration:

J-Link GDB Server Configuration
Then it will wait for a remote debugger connection:

GDB Server Waiting for Connection
For P&E I have to start the ‘pegdbserver_console’:

pegdbserver_console.exe in NXP MCUXpresso IDE 10.3.1
You need to know the hostname (or IP address) of the machine which runs the server in the next step. In my case the server machine has the following IP address: 192.168.0.112.
Host PC
On the Host PC, using Eclipse CDT with the GNU MCU Eclipse plugins, uncheck ‘start the J-Link GDB Server locally’ and enter the remote IP address (default port is 2331):

Remote Debugging in GNU MCU Eclipse
In MCUXpresso IDE 10.3.1 enter the IP address, use manual server startup with ‘start server’ option disabled:

Remote Debugging in MCUXpresso IDE 10.3.1
For P&E there is a similar setting here:

PEMicro Remote GDB Settings
Remote Debugging
With this I can debug the remote target as it would be connected locally. The SEGGER Server will show the connection status like this:

Connected to GDB Server
And with this I can do remote debugging 🙂 :
💡 Do not use the ‘blue’ debug icon in the MCUXpresso IDE: use the ‘Debug’ button in the launch configuration instead.

Remote Debugging with NXP MCUXpresso IDE
Summary
It is very easy to do IP-based remote debugging. I need to run the P&E or SEGGER GDB server on a machine and then I can connect from everywhere to that server and debug that board, without having physical access to it. This is especially useful with sharing a board on a machine or if that board is not accessible otherwise. The price (instead using a real IP-based debug probe) is that I need a remote host machine. If there is no IP-based debug probe at hand, this should be a very doable solution. Of course with high latency networks this will impact debug performance, but this is expected.
💡 The approach described here needs a network connection which usually is available inside a company network, but not to the outside world behind the firewalls. For debugging boards beyond the firewall I can use a SEGGER server, see Remote Board Debugging: J-Link Remote Server with Eclipse
Happy IPing 🙂
Links
- Debugging ARM Cores with IP based Debug Probes and Eclipse
- Command Line Debugging with GDB
- Remote Board Debugging: J-Link Remote Server with Eclipse
- GNU MCU Eclipse
- MCUXpresso IDE: http://www.nxp.com/mcuxpresso/ide
- MCUXpresso IDE V10.3.1 available
- SEGGER: http://segger.com/
- PEMicro: http://pemicro.com/

I had similar situation where I had to remotely debug a project installed on a site located at ~30km away of our desk. The PC server was a Raspbery Pi connected to a JLink in USB. We knew the public IP of the site but were not able to remotely reach the RPi because the router denied all external access. But we figured out a way. Thanks to the JLinkRemoteServer utility, the -UseTunnel option runs a tunnel mode service brought by Segger for free :). A simple SystemD service let us the ability to auto manage the utility at boot time or when failure occurred. I was then able to remotely debug the project from Eclipse IDE from anywhere. Very satisfying.
LikeLike
Hi Max,
interesting, I did not think about running the GDB server on a Raspy, but indeed SEGGER provides a (unsupported) package for ARM Systems. Very cool!
I searched for that topic and have found this: https://forum.segger.com/index.php/Thread/4167-SOLVED-ARM-Running-the-JLinkGDBServer-program-on-Raspberry-Pi-3/
Do you have any other advice how to set this up?
Thanks in advance!
LikeLike
Hello Erich,
I haven’t got any issue to detect the target board (which is a STM32F1). Even if it it not officially support by SEGGER, the ARM binaries worked quite good on RPi on first try. Sometime the tunnel mode does not work for 1 hour and I believe it is because of sever downtime. But how can I complain, the tunnel mode is a free service after all.
LikeLike
excellent, thank you!
LikeLike
Hi Erich,
Not sure if you have a post about this issue/question I have.
I just started using evaluation board NXP FRDM-KE15Z & learning some of the example source code that I got from the SDKs. I’m using MCUXpresso IDE to build, flash & debug.
I want/need to use an external terminal emulator such as Hyperterm, Realterm or Putty instead of all “printf()” debug results showing-up on the small MCUXpresso console window.
I already have 2 connection out of the 4-port USB hub on 1 USB port of my laptop: 1 for FRDM-KE15Z board & 1 for PEmicro Multlink.
When I “imported SDK example” to create a new project, I check the “UART” box, instead of “semi-host” for debug terminal.
PROBLEM: I can’t make any Hyperterm / Putty or Realterm RS-232 connection. Only TCP/IP channel is available which I don’t know how to configure.
Can I actually be able to open PC dumb terminal to have all “printf()” results be displayed in this setup?
Please advise.
Thanks,
MI
LikeLike
I don’t have any KE15Z board at hand, so cannot try out thing myself.
Hi MI,
Check that the OpenSDA USB CDC device is showing up in your (Windows?) device manager. Depending on the debug firmware on the OpenSDA, it should show up as SEGGER or P&E USB CDC (virtual COM) port.
Then connect to that port with your puTTY, Hyperterm, Termite, …
I hope this helps,
Erich
LikeLike
Dear Professor Erich Styger
I annoy you because I can not find a solution.
I installed MCUExpresso 10.3.1 then imported a project from 10.0.0, compiled and executed debug in a FRDM-K64 correctly.
After a few hours of work, the following problem arises:
303,622 15^error,msg=”localhost:2331: No connection could be made because the target machine actively refused it.”
I went through and executed almost all the instructions on the mcuoneclipse and other websites, I also reinstalled the IDE and configured the firewall individually for the GDB exe , but without success.
The debug with MCUExpresso 10.0.0 continues to work correctly in the same machine.
The OS is Windows 7 x64 and the probe is SEGGER EDU mini via SWD.
Would you have some other movement for me to do?
Thanks a lot.
Martin Chute (63)
Buenos Aires. Argentina.
this is the entire GDB session:
050,219 2-list-thread-groups
050,229 2 ^ done, groups = [{id = “i1”, type = “process”}]
050,229 (gdb)
050,994 3-gdb-version
051,001 ~ “GNU gdb (GNU Tools for Arm Embedded Processors 7-2018-q2-update) 8.1.0.20180315-git \ n”
051,002 ~ “Copyright (C) 2018 Free Software Foundation, Inc. \ n”
051,007 ~ “License GPLv3 +: GNU GPL version 3 or later \ nThis is fre \
e software: you are free to change and redistribute it. \ nThere is NO WARRANTY, to the extent allowed \
ed by law. Type \ “show copying \” \ nand \ “show warranty \” for details. \ N ”
051,010 ~ “This GDB was configured as \” – host = i686-w64-mingw32 –target = arm-none-eabi \ “. \ NType \” sho \
w configuration \ “for configuration details.”
051,011 ~ “\ nFor bug reporting instructions, please see: \ n”
051,011 ~ “. \ N”
051,013 ~ “Find the GDB manual and other documentation resources online at: \ n . \ n ”
051,013 ~ “For help, type \” help \ “. \ N”
051,014 ~ “Type \” apropos word \ “to search for commands related to \” word \ “. \ N”
051,014 3 ^ done
051,015 (gdb)
051,016 4-environment-cd C: / Users / home / Documents / CWKW_MCUEx1031_Projects / frdmk64f_agm01_freertos_1_ \
sensorfusion_freertos_agm01
051,024 4 ^ done
051,024 (gdb)
051,025 5-gdb-set breakpoint pending on
051,034 5 ^ done
051,034 (gdb)
051,035 6-enable-pretty-printing
051,044 6 ^ done
051,044 (gdb)
051,044 7-gdb-set python print-stack none
051,054 7 ^ done
051,054 (gdb)
051,054 8-gdb-set print object on
051,064 8 ^ done
051,064 (gdb)
051,064 9-gdb-set print sevenbit-strings on
051,074 9 ^ done
051,074 (gdb)
051,074 10-gdb-set charset ISO-8859-1
051,084 10 ^ done
051,084 (gdb)
051,084 11-gdb-set dprintf-style gdb
051,094 11 ^ done
051,094 (gdb)
051,094 12-gdb-set target-async off
051,104 12 ^ done
051,104 (gdb)
051,104 13-gdb-set auto-solib-add on
051,114 13 ^ done
051,114 (gdb)
051,120 14symbol-file C: \\ Users \\ home \\ Documents \\ CWKW_MCUEx1031_Projects \\ frdmk64f_agm01_freertos_ \
1_sensorfusion_freertos_agm01 \\ Debug \\ frdmk64f_agm01_freertos_1_sensorfusion_freertos_agm01.axf
051,128 & “symbol-file C: \\\\ Users \\\\ home \\\\ Documents \\\\ CWKW_MCUEx1031_Projects \\\\ frdmk64f_agm01 \
_freertos_1_sensorfusion_freertos_agm01 \\\\ Debug \\\\ frdmk64f_agm01_freertos_1_sensorfusion_freertos_ \
agm01.axf \ n ”
051,133 ~ “Reading symbols from C: \\ Users \\ home \\ Documents \\ CWKW_MCUEx1031_Projects \\ frdmk64f_agm01_ \
freertos_1_sensorfusion_freertos_agm01 \\ Debug \\ frdmk64f_agm01_freertos_1_sensorfusion_freertos_agm01 \
.axf … ”
051,151 ~ “done. \ N”
051,191 14 ^ done
051,192 (gdb)
051,192 & “\ n”
051,192 ^ done
051,192 (gdb)
051,192 15-target-select remote localhost: 2331
052,226 15 ^ error, msg = “localhost: 2331: No connection could be made because of the target machine activel \
and refused it. ”
052,227 (gdb)
052,227 & “\ n”
052,228 ^ done
052,228 (gdb)
052,229 16-gdb-exit
052,237 16 ^ exit
LikeLike
Usually this message tells that the gdb binary ins not available or the launch configuration is not correct or corrupted somehow.
I suggest you delete the launch configuration and you let the IDE create a new fresh one?
Can you try this?
LikeLike
I had already done it, but just in case I did it again, with these results:
[06-3-2019 06:40:12] Executing Server: “C:\Program Files (x86)\SEGGER\JLink_V642b\JLinkGDBServerCL.exe” -nosilent -swoport 2332 -select USB=801006172 -telnetport 2333 -singlerun -endian little -noir -speed auto -port 2331 -vd -device MK64FN1M0xxx12 -if SWD -halt -reportuseraction
SEGGER J-Link GDB Server V6.42b Command Line Version
JLinkARM.dll V6.42b (DLL compiled Feb 5 2019 17:31:40)
Command line: -nosilent -swoport 2332 -select USB=801006172 -telnetport 2333 -singlerun -endian little -noir -speed auto -port 2331 -vd -device MK64FN1M0xxx12 -if SWD -halt -reportuseraction
—–GDB Server start settings—–
GDBInit file: none
GDB Server Listening port: 2331
SWO raw output listening port: 2332
Terminal I/O port: 2333
Accept remote connection: localhost only
Generate logfile: off
Verify download: on
Init regs on start: off
Silent mode: off
Single run mode: on
Target connection timeout: 0 ms
——J-Link related settings——
J-Link Host interface: USB
J-Link script: none
J-Link settings file: none
——Target related settings——
Target device: MK64FN1M0xxx12
Target interface: SWD
Target interface speed: auto
Target endian: little
Connecting to J-Link…
$$UserActionStart$$: Terms of use
$$UserActionEnd$$: Terms of use
J-Link is connected.
Server has been shut down.
and then………..
515,575 2-list-thread-groups
515,575 3-gdb-version
515,579 2^done,groups=[{id=”i1″,type=”process”}]
515,581 (gdb)
515,582 ~”GNU gdb (GNU Tools for Arm Embedded Processors 7-2018-q2-update) 8.1.0.20180315-git\n”
515,582 ~”Copyright (C) 2018 Free Software Foundation, Inc.\n”
515,588 ~”License GPLv3+: GNU GPL version 3 or later \nThis is fre\
e software: you are free to change and redistribute it.\nThere is NO WARRANTY, to the extent permitt\
ed by law. Type \”show copying\”\nand \”show warranty\” for details.\n”
515,591 ~”This GDB was configured as \”–host=i686-w64-mingw32 –target=arm-none-eabi\”.\nType \”sho\
w configuration\” for configuration details.”
515,592 ~”\nFor bug reporting instructions, please see:\n”
515,593 ~”.\n”
515,594 ~”Find the GDB manual and other documentation resources online at:\n.\n”
515,594 ~”For help, type \”help\”.\n”
515,595 ~”Type \”apropos word\” to search for commands related to \”word\”.\n”
515,595 3^done
515,596 (gdb)
515,596 4-environment-cd C:/Users/casa/Documents/CWKW_MCUEx1031_Proyectos/frdmk64f_agm01_freertos_1_\
sensorfusion_freertos_agm01
515,605 4^done
515,605 (gdb)
515,606 5-gdb-set breakpoint pending on
515,616 5^done
515,616 (gdb)
515,616 6-enable-pretty-printing
515,626 6^done
515,626 (gdb)
515,626 7-gdb-set python print-stack none
515,636 7^done
515,636 (gdb)
515,637 8-gdb-set print object on
515,646 8^done
515,646 (gdb)
515,646 9-gdb-set print sevenbit-strings on
515,656 9^done
515,656 (gdb)
515,656 10-gdb-set charset ISO-8859-1
515,666 10^done
515,666 (gdb)
515,666 11-gdb-set dprintf-style gdb
515,676 11^done
515,676 (gdb)
515,677 12-gdb-set target-async off
515,686 12^done
515,686 (gdb)
515,687 13-gdb-set auto-solib-add on
515,696 13^done
515,696 (gdb)
515,702 14symbol-file C:\\Users\\casa\\Documents\\CWKW_MCUEx1031_Proyectos\\frdmk64f_agm01_freertos_\
1_sensorfusion_freertos_agm01\\Debug\\frdmk64f_agm01_freertos_1_sensorfusion_freertos_agm01.axf
515,710 &”symbol-file C:\\\\Users\\\\casa\\\\Documents\\\\CWKW_MCUEx1031_Proyectos\\\\frdmk64f_agm01\
_freertos_1_sensorfusion_freertos_agm01\\\\Debug\\\\frdmk64f_agm01_freertos_1_sensorfusion_freertos_\
agm01.axf\n”
515,716 ~”Reading symbols from C:\\Users\\casa\\Documents\\CWKW_MCUEx1031_Proyectos\\frdmk64f_agm01_\
freertos_1_sensorfusion_freertos_agm01\\Debug\\frdmk64f_agm01_freertos_1_sensorfusion_freertos_agm01\
.axf…”
515,737 ~”done.\n”
515,777 14^done
515,777 (gdb)
515,778 &”\n”
515,778 ^done
515,778 (gdb)
515,778 15-target-select remote localhost:2331
516,802 15^error,msg=”localhost:2331: No connection could be made because the target machine activel\
y refused it.”
516,803 (gdb)
516,804 &”\n”
516,804 ^done
516,804 (gdb)
516,805 16-gdb-exit
516,813 16^exit
LikeLike
Does it work for a project you import from the SDK? Just trying to find out of it is related to your project or to your setup.
And: I have seen such kind of strange things with firewalls/virus scanners: can you try to turn them off for a try?
LikeLike
Yes, the project is imported from the 2.5 SDK generated by the NXP tool online, to import the content example I used the Quickstart Panel without alerts or errors. I just deleted the workspace and the installed SDK to start everything again, but still doing the same.
I reinstalled the IDE ..
I reinstalled the SDK.
I reinstalled the SDK project.
The IDE 10.0.0 with SDK 2.2 on the same machine works fine.
The IDE 10.3.1 with the 2.5 SDK worked fine for approximately 4 hours until the problem appeared.
It seems that something in the windows registry or some other resource was altered but only for the IDE 10.3.1 or the SDK 2.5 .. !!
I understand that the error message that it throws can be originated for several reasons, but given the rebelliousness of this case it would be implying some kind of problem or omission in the MCUExpresso IDE.
The minimum conditions for a correct global operation should be verified at least in the installation process, in order to alert or correct. I think that new versions should never have old problems because then they are not new versions, they are new problems. Nor can it be said that these problems are because “it is free” that luckily it is, it must be that the commercial maelstrom does not allow companies to be responsible with their products.
Without a doubt, our work is what we call “no man’s land” on these sides 🙂
At your orders and thank you very much Erich.
LikeLike
Solved for me, Preferences -> C / C ++ -> Debug -> GDB -> Non-stop mode (Note: Requires non-stop GDB): by default this option is checked and should not.
LikeLike
Hi Martin,
this is very interesting (and not expected by me).
I’m wondering why this option should cause a problem after hours of usage?
I do have that option set/enabled by default on my side, and did not see any issues with it.
But it is good to know for the next time that this option might have an impact. And not sure who to plame: the GDB or the SEGGER J-Link?
Obviously that option seems to cause the Segger J-Link to freak out and to terminate the connection.
I did not spot anything in your gdb traces, so not sure what is really causing this?
Thanks!
Erich
LikeLike
Hi, Erich
Yes, I do not think that this option is the cause of the problem, just when it changes it started to work, but after a while it stopped working and after another time it started to work again, something is affecting in a random way the beginning of the connection, the version 10.0.0 never stops working, being the same PC, the same Segger probe and the same version of GDB server, possibly the flow execution of the McuExpresso 10.3.1 reveals some incompatibility of times in OS W7 in this PC, unfortunately I will not continue using it, later if NXP discovers any sensitivity to W7, I will try it again.
Thanks
Martín
LikeLike
That’s really strange. But it could be possibly a problem in the J-Link DLL too. I noticed some weird things in some versions of the DLL which sometimes go away after upgrading it. The other thing I belive could be a problem is that the J-Link DLL might not be fully reentrant: I faced issues when I was using J-Link with different IDEs. But never was able to really have a reproducible case.
LikeLike
Pingback: Debugging Failure: Check List and Hints | MCU on Eclipse
Have you tried using usbip, should be a bit more straightforward.
LikeLike
No, I have not used usbip, and did not know about it (thanks for the hint!). I did not need it as my other approaches work very well and are reliable. But looking at usbip page there are no changes since 2011?
LikeLike
It’s part of the Linux mainline now, tools are included in linux-tools.
https://developer.ridgerun.com/wiki/index.php?title=How_to_setup_and_use_USB/IP
LikeLiked by 1 person
Hello Erich,
Which debugger would you recommend: P&E Multilink or Segger J-Link? I use Kinetis microcontrollers and want to trace to FreeRTOS.
Thanks
LikeLike
Hi Matheus,
each probe has its advantages: The new P&E Multilink has included power measurement and is very compact. While the SEGGER probes come with many extra tools which can be used outside of the IDE. As for tracing FreeRTOS: only the J-Link comes with the ability to use SystemView, so if this is what you want, then the preference would be to use a J-Link.
LikeLike