By default, the FreeRTOS threads do not show up with the SEGGER J-Link debug connection in the Eclipse based NXP S32 Design Studio IDE. But don’t worry: Here is how to get it working with SEGGER J-Link debug connection:

FreeRTOS Threads in Eclipse Debug View
This article shows how to enable FreeRTOS thread aware debugging in the NXP S32 Design Studio (S32DS) for ARM. I’m using the version 2018.R1 build 180504:

S32DS 2018.R1 Build 180504
By default, threads are not shown in the Debug view:

Debug view with no FreeRTOS Threads
The first thing is to add the following to the SEGGER debug configuration inside S32DS, under ‘Other options’:
-rtos GDBServer/RTOSPlugin_FreeRTOS

Segger other option
This command line will load the tread awareness plugin/DLL for the SEGGER GDB server. Because that plugin is not installed with S32DS, I have to add it to the IDE. The easiest way to get that plugin is to install the J-Link software from segger.com and copy that GDBServer folder where it has been installed it:

GDBServer Plugins
Then copy that folder where S32DS has installed the SEGGER JLinkGDBServerCL.exe:

SEGGER GDBServer Plugins in S32DS
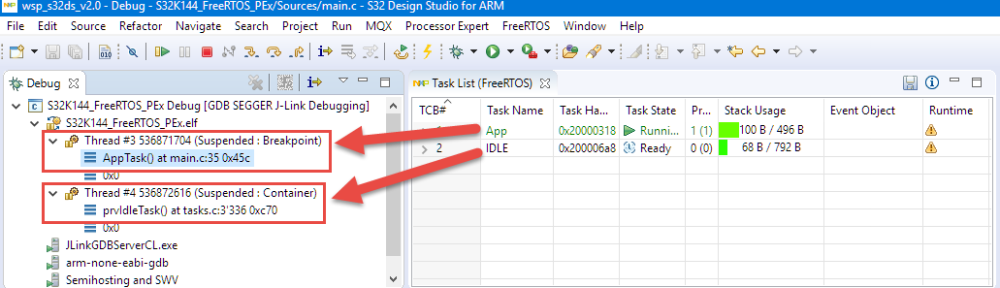
With this, when I debug a FreeRTOS application, I have all the FreeRTOS tasks shown in the Eclipse debug view, which makes debugging much, much easier 🙂 :
FreeRTOS Threads in Eclipse Debug View
Happy threading 🙂

Hi Erich,
Does this work for KDS (3.2) also?
Once upon a time I could see the threads in KDS , but they went away and I can’t find them…
Brynn
LikeLike
Yes, this is even simpler in KDS. You only have to add
-rtos GDBServer/RTOSPlugin_FreeRTOSto the debugger settings.LikeLike
I added the ‘-rtos …’ option, but I also had to upgrade my segger jlink directory before it would work. Thanks!
LikeLike
Yes, the ‘rtos’ folder is missing in the original install. Or did you had to update the other Segger files too?
LikeLike
I had the RTOS folder and the Segger Jlink directory already, and in the past the threads showed up in the debugger. Then they quit showing at some point (I may have installed MCUXpresso, or a KDS update, or S32, or something related).
I re-added the ‘-rtos …’ option, but that didn’t fix it. I noticed that your version of the Jlink directory was newer than mine, so I installed the latest from Segger (which looks slighty newer than even yours). Then it started working again 🙂 .
Brynn
LikeLike
Pingback: Tutorial: Using Runtime Statistics with Amazon FreeRTOS V10 | MCU on Eclipse
Is it possible to achieve the same, but using MQX instead of FreeRTOS?
Thank you!
LikeLike
I would think so, but I’m not using MQX. But in any case you need a different set of plugins tailored for MQX.
LikeLike
As I can see, there is no “RTOSPlugin_MQX.dll” in GDBServer directory.
Of course, I have installed MQX TAD plugin, and it’s working fine; the only thing I miss is obtaining the stacktrace for all inactive threads (like CodeWarrior did long time ago, before all toolchain headache with KDS, MCUXpresso…)
LikeLike
That plugin would come from SEGGER, so I think you would have to ask them to create such a plugin. I believe they made the speces open (would have to check), so you even could do it yourself if you want.
LikeLike
Hi Erich,
I can not debug S32K in S32DS by Segger J-Link tool.
Even on board OpenSDA J-Link or stand alone Segger J-Link tool.
I have check the Segger J-Link tool is V9 and PC driver support up to V6.42.
I new create a project by “Create S32DS project from example” and choose RTM SDK v2.0.0.
Thanks for your help.
LikeLike
That might be more a question to the SEGGER support line, but: I would check the error message. Maybe you have a driver installation problem?
LikeLike
Hi Erich,
I think not quite belong to Segge, because I can erase/program S32K by J-Flash Lite.
You can find below link is Google drive contains the log file and snapshot.
https://drive.google.com
Thank you.
LikeLike
Your sceenshot shows that the source file is not found: you probably have stripped of debug information or configured your project not adding debug information/symbolics.
Or you have not configured the paths correctly. I suggest you try with one of the installed example projects.
LikeLike
Hi Erich,
I found an interesting thing when creating the project code from “S32DS Application Project” and “S32DS Project from Example”.
There is a configuration option different in properties>Run/Debug>J-Link>Common.
If choose the option “Save as Shared file” and will show that the source file is not found.
But change to “Local file” and debug success with other error.
LikeLike
That option really saves the settings as .launch file in the projects. I have not seen any difference using that option. What ‘other error’ do you get?
LikeLike