
With debugging FreeRTOS applications in Eclipse, it is a big to have views available showing all the threads, queues, timers and heap memory allocation. One of the best Eclipse plugins are the one NXP provides for FreeRTOS: they are free of charge and give me pretty much everything I need. However, if you are not that familiar with FreeRTOS itself, here are a few tips to get more out of the plugins.

Better FreeRTOS Debugging in Eclipse
Outline
In this article, I show several tips and FreeRTOS configuration settings, how to make debugging FreeRTOS in Eclipse easier. There are several settings in FreeRTOS which stores more information in the kernel: while this usually has a small price (RAM, ROM, execution time), it greatly simplifies debugging FreeRTOS applications. And if you are concerned about the overhead, you can turn it off after debugging.
Version Used
I’m using in this article Kinetis Design Studio V3.2.0 (Eclipse Luna) with the plugin version 1.0.1.201610061345 which is available from the following Eclipse update site:
http://nxp.com/lgfiles/updates/Eclipse/KDS

FreeRTOS Kernel Awareness
For installation, see FreeRTOS Kernel Awareness for Eclipse from NXP.
For FreeRTOS, I’m using the latest FreeRTOS V9.0.0 with some V9.01 extensions (see “McuOnEclipse Components: 12-Mar-2017 Release“). If you want to have the source code, it is available for example on GitHub (https://github.com/ErichStyger/McuOnEclipseLibrary/tree/master/lib/FreeRTOS/Source).
Task Control Block
In FreeRTOS, the Task Control Block (TCB) has information about the task (priority, name, etc. There is a number in that TCB which gets incremented each time a TCB (or task) is created, kind of ‘process ID’. That ID is only present if the following define is set to one (enabled) in FreeRTOSConfig.h:
#define configUSE_TRACE_FACILITY 0 /* 1: include additional structure members and functions to assist with execution visualization and tracing, 0: no runtime stats/trace */
Latest version of the FreeRTOS task list view needs that the legacy API names are disabled:
#define configENABLE_BACKWARD_COMPATIBILITY 0
If that define is set to 0, then the TCB numbers are not available and not shown:

Task Control Block with no TCB number
Enable that configUSE_TRACE_FACILITY or use the following setting in the component:

Enabled Trace Facility
And now it shows the TCB number in the view:

TCB Numbers Shown
💡 Be aware that this setting not only adds the TCB number, but turns on other debugging features: it will increase the RAM and ROM footprint for your application.
The TCB numbers itself do not offer big value, but I can see in which order the tasks have been created, if I’m interested in that information.
Task Name
Maybe you see the task names truncated or as ‘Unknown’:

Unknown Task Names
Then check the following setting in FreeRTOSConfig.h (it has to be set to >0):
#define configMAX_TASK_NAME_LEN 12 /* task name length in bytes */
It defines how many characters (including the zero byte) are used for the task name string. The same setting can be found here:

Task Name Length
💡 Don’t use a task name too long, as it consumes more RAM. A number of about 10-15 bytes should be enough.
Runtime Information
FreeRTOS has a feature to show the performance of each task (Runtime information). By default, the view might show nothing:

Performance Analysis
To measure the performance, FreeRTOS is measuring how long a task is running: basically it stores the runtime when the task gets switched out. So each task counts its execution time. To use this, the following configuration define in FreeRTOSConfig.h needs to be turned on:
#define configGENERATE_RUN_TIME_STATS 0 /* 1: generate runtime statistics; 0: no runtime statistics */
Depending on what other functions you use (e.g. vTaskGetRunTimeStats()), I recommend to have the following defines enabled too:
#define configUSE_STATS_FORMATTING_FUNCTIONS      1
#define configUSE_TRACE_FACILITY                  1
In addition to that, I have to provide a timer to measure the time. As a non-standard FreeRTOS feature, in the McuOnEclipse FreeRTOS port I can use the RTOS tick counter as time base with the following define:
#define configGENERATE_RUN_TIME_STATS_USE_TICKS 1 /* 1: Use the RTOS tick counter as runtime counter. 0: use extra timer */
Using the McuOnEclipse FreeRTOS component, I can use the following settings:

Using Runtime Statistics
💡 Using runtime statistics increases the RAM and ROM footprint of your application too.
Using the RTOS tick counter only will count tasks which run longer than the tick period (e.g. 1 ms) and usually is not precise enough. In the example below every task runs less than the tick period, so the timing shows up as zero: The Main, Led and TmrSvc tasks are running less than 1 ms (tick period) and do not get counted. The IDLE task itself runs for more than 1 ms, so it counts for 0x1ba8 milliseconds:

Runtime with 1 ms counter
Typically, the time base for the performance measurement should be at least 10 times faster than the RTOS tick period. I can use a dedicated timer (say with a 0.1 ms period):

Runtime Counter

Runtime Counter with 0.1 ms Period
With this, I get better measurement of the tasks:

Runtime Timing
💡 Keep in mind that the extra timer is affecting the overall system load.
Queues, Mutex and Semaphore
In FreeRTOS, both mutex and semaphores are in fact queues (with no data). Unlike tasks (which get a name at creation time), queues have no name by default. Then you get this:

No Queue Registry Information
As indicated in the dialog, I have to set the following define to a value greater zero:
#define configQUEUE_REGISTRY_SIZE 10
That same setting is here:

Queue Registry Size
The value defines how many queue names I’m able to register, or the number of queues present in the system at any time. I have to give the queues (and semaphore, and mutex) a name using the vQueueAddToRegistry() function:
sem = xSemaphoreCreateBinary(); if (sem==NULL) { /* semaphore creation failed */ for(;;){} /* error */ } vQueueAddToRegistry(sem, "MySemaphore");With this, the queues show up with names:
Queues with Names
Additionally, if a task is waiting on a queue/semaphore/mutex, it is displayed with its name in the task list:
Task waiting on queue object
Stack High Address
By default on ARM Cortex-M, FreeRTOS only records in the TCB for the task stack


- start of stack area
- current stack pointer
- maximum used stack location
But not the end of the stack. So the debugger does not know the real stack size allocated for the task. In the screenshot below I have allocated 400 bytes for the Main task, but it does not show that:

Stack Usage with no stack size
To solve this, have the following set to 1 in FreeRTOSConfig.h
#define configRECORD_STACK_HIGH_ADDRESS 1 /* 1: record stack high address for the debugger, 0: do not record stack high address */
The same setting can be found here:

Record Stack High Address
With that settings, I get (almost) correct settings:

Showing Task Stack Size
💡 The stack size (392 bytes) is almost correct (should be 400 bytes), probably because the first and last entry is not counted.
Heap Usage
FreeRTOS supports by default up to 5 different heap allocation methods (schemes).

FreeRTOS Heap Schemes
The normal way is just to have one of them in the build, and the others deleted/removed from the project.
Because this is very painful and makes it hard to switch between the different memory schemes, the McuOnEclipse FreeRTOS port adds the following macro in FreeRTOSConfig.h which identifies the memory scheme:
#define configUSE_HEAP_SCHEME 4 /* either 1 (only alloc), 2 (alloc/free), 3 (malloc), 4 (coalesc blocks), 5 (multiple blocks) */
The NXP FreeRTOS Heap Usage view in Eclipse tries to ‘guess’ the used heap scheme based on the heap buffer variable name (if it is present, which name is used). Because of this, there is this information icon:
Heap Usage Information Icon
Keep in mind that if using the Memory Scheme 1 (only allocation of memory blocks), there is no information available about the memory blocks allocated:

no memory block details for FreeRTOS Heap Scheme 1
The reason is obvious if you check the implementation in heap_1.c: because memory blocks do not need to be freed, there is no such thing like a list of memory blocks allocated necessary. All what the heap knows is the total size of the heap and a variable (xNextFreeByte) pointing to the free area: simple, fast and deterministic :-).
To help the view to identify the correct heap scheme used, I can add a variable to my code which tells the view which scheme is used:

Helper for Memory Scheme
To add the helper, use something like this to the application code:
const uint8_t freeRTOSMemoryScheme = configUSE_HEAP_SCHEME;You have to make sure that this variable is not optimized by the linker (e.g. use it in your application code). A convenient way is to use the following setting which takes care of everything:
Heap Indication Constant
💡 There is a bug in the version 1.0.1 of the NXP Kernel Awareness Plugin: if the variable freeRTOSMemoryScheme is present, it is always read with a value of 5 which is wrong. That bug has been reported and should be fixed in the next version. Until then, best if freeRTOSMemoryScheme is not used.
Faster Debugging
If having one of the FreeRTOS views open, it means the view fetches the data from the target when I stop or step with the debugger. This can take up to a second or more, so makes debugging very slow. One solution is to put the views into the background. I was at Embedded World Nürnberg this week, and saw a demo of MCUXpresso IDE: it features a new version of the FreeRTOS plugins, and it has ‘pause’ button. That way, I can keep the views in the foreground, but they are paused and do not read from the target:
Pause Button
Thread Aware Debugging
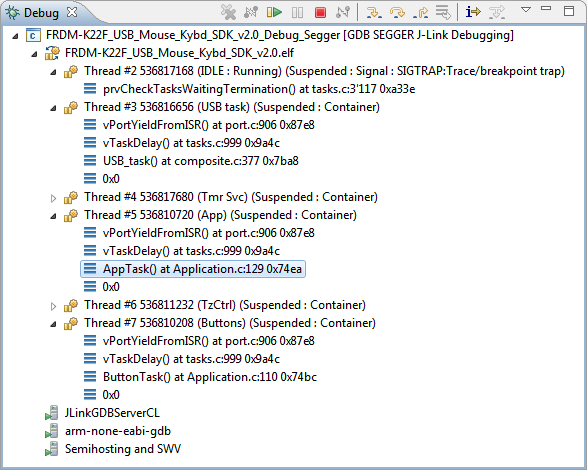
By default, Eclipse shows only one thread or task in the debug window. The OpenOCD, P&E and Segger debug connections can support thread aware debugging: with this I can debug each task in its own context:
FreeRTOS Thread Awareness with Segger GDB
The following articles describe how to enable this for Eclipse or the SEGGER Ozone Debugger:


- FreeRTOS Thread Debugging with Eclipse and OpenOCD
- P&E ARM Cortex-M Debugging with FreeRTOS Thread Awareness and Real Time Expressions for GDB and Eclipse
- FreeRTOS Thread Debugging with Segger GDB in Eclipse
- FreeRTOS ARM Thread Debugging with Eclipse and GDB
- FreeRTOS Kernel Awareness with Ozone
FreeRTOS Task C Additions
FreeRTOS has a way to include extra helpers using the following at the end of the task.c file:
#if( configINCLUDE_FREERTOS_TASK_C_ADDITIONS_H == 1 && configUSE_TRACE_FACILITY==1) #include "freertos_tasks_c_additions.h" #ifdef FREERTOS_TASKS_C_ADDITIONS_INIT static void freertos_tasks_c_additions_init( void ) { #ifdef FREERTOS_TASKS_C_ADDITIONS_INIT FREERTOS_TASKS_C_ADDITIONS_INIT(); #endif } #endifThis can be enabled in the FreeRTOS component using two settings:
Task C Addition Settings
An example implementation of such a task C additions file can be found on GitHub: https://github.com/ErichStyger/McuOnEclipse_PEx/blob/master/Drivers/freeRTOS/gdbBacktraceDebug/freertos_tasks_c_additions.h
FreeRTOS Tracing
FreeRTOS features instrumented trace. One solution is to use Percepio Tracealizer:
Another solution is the SEGGER SystemView:
Scheduler time spent in Segger SystemView
The following articles point to the latest articles:


- Percepio FreeRTOS Tracealyzer Plugin for Eclipse
- Segger SystemView: Realtime Analysis and Visualization for FreeRTOS
Summary
I hope this article helps you to debug FreeRTOS application. There are several settings shown above which really makes life easier. On top of that, there are tracing solutions with FreeRTOS which help beyond ‘stop-mode’ debugging.
Only keep in mind that the debugging helpers are not coming for free: to reduce the footprint of the application, I recommend to turn them off. There are more things to be considered if optimizing FreeRTOS applications: if there is enough interest, I could write an article about that topic too. Simply let me know 🙂
Happy Debugging 🙂
Links
- FreeRTOS Kernel Awareness for Eclipse from NXP
- FreeRTOS: http://www.freertos.org/
- Percepio FreeRTOS Tracealyzer Plugin for Eclipse
- Segger SystemView: Realtime Analysis and Visualization for FreeRTOS
- FreeRTOS Thread Debugging with Eclipse and OpenOCD
- P&E ARM Cortex-M Debugging with FreeRTOS Thread Awareness and Real Time Expressions for GDB and Eclipse
- FreeRTOS Thread Debugging with Segger GDB in Eclipse
- FreeRTOS ARM Thread Debugging with Eclipse and GDB
- FreeRTOS Kernel Awareness with Ozone

Excellent!
I just have a couple of questions, though. I’m not using the MCU on Eclipse components, so I don’t have a way of configuring all this exactly as you mentioned in the article, nevertheless, I’m trying to add all these configurations by hand and I’m experiencing a couple of issues.
The first one is regarding the “configRECORD_STACK_HIGH_ADDRESS” addition. I have added it to my config file but nothing happens. Is there anything else to be done besides adding this #define?
The other issue is with the runtime. I have added an LPTMR module and it is counting every 0.1ms, I have verified that with a GPIO. For the configuration of the LPTMR, I created a function called “ConfigureTimerForRunTimeStats” and to get the value a function called “GetRunTimeStatsTimerValue”, both functions are being called from FreeRTOS. Additionally, I have added the following two #defines to the FreeRTOS config file:
“#define portCONFIGURE_TIMER_FOR_RUN_TIME_STATS() ConfigureTimerForRunTimeStats()”
“#define portGET_RUN_TIME_COUNTER_VALUE() GetRunTimeStatsTimerValue()”
But, the warning icons are still there, nothing changes.
Could you help me with this issues, please!!
Thanks!!
LikeLike
Hi Manuel,
The McuOnEclipse FreeRTOS is bleeding edge, so the configRECORD_STACK_HIGH_ADDRESS is not part of v9.0.0, but in the upcoming v9.0.1. You find the latest version on GitHub: https://github.com/ErichStyger/McuOnEclipseLibrary/tree/master/lib/FreeRTOS/Source. If you insist using your version of FreeRTOS (v9.0.0 I asssume?), then you have patch your version with the changes.
Best if you get the version from that GitHub repo and search for configRECORD_STACK_HIGH_ADDRESS. It is used in FreeRTOS.h (3 times), FreeRTOSConfig.h (1 time) and task.c (4 times).
You can use that version of FreeRTOS directly, as it does not need Processor Expert, and works nicely with the NXP SDK (I have an example project here: https://github.com/ErichStyger/mcuoneclipse/tree/master/Examples/KDS/FRDM-K64F120M/FRDM-K64F_McuLib_MCUXpressoSDK).
I hope this helps,
Erich
LikeLike
Pingback: Embedded World Nürnberg 2017 Impressions: MCUXpresso, Hexiwear, NTAG, LPC800-DIP and Alan Hawse | MCU on Eclipse
Hi Erich,
congratulations on such a detailed post with a very handful tool for FreeRTOS. I am trying to use it with MKL26Z128VLH4 in my custom board, but I am facing a problem to debug it. I designed it following the same basic circuit of FRDM-KL26Z with a 10-pin SWD connector. However, when I try to flash or debug it, I see the message: “Device is secured. Erase to unsecure?” and it never succeeds. If I populate this same board with a MKL25Z128VLH4, it works flawlessly. I compared MKL25 and MKL26, but I can’t find any hardware difference related to the vital signals. Have you ever had such a problem?
Best Regards,
Marcelo
LikeLike
Hi Marcelo,
the message “device is secure” shows up if the debug interface is not able to talk to the device. There could be many reasons for this, I have listed some in https://mcuoneclipse.com/2012/05/28/device-is-secure/, https://mcuoneclipse.com/2012/11/04/how-not-to-secure-my-microcontroller/ and https://mcuoneclipse.com/2012/10/26/unsecuring-the-kl25z-freedom-board/
LikeLike
Hi Erich,
I’m a huge fan of your blog. MCoE has been so helpful for me, and all the other kinetis embedded developers I know.
I have been trying to develop a project for the MKL26Z (currently just with the FRDM board) that merges together my application code, FreeRTOS, and the Freescale/NXP USB stack. (CDC app) The specifics of my application (and other issues) have led me to avoid Processor Expert for this project, so it is bare metal.
I have no problems with my application and FreeRTOS, but I have been unable to get anything working when I merge in the USB stack, I get stuck in the default interrupt handler in many different ways when I call the usb init routines.
I would love to look at an example project combining these three things – FreeRTOS, USB-CDC, and not processor expert. Do you know of any or where I can find one?
I’m running KDS v3.2 and KSDK 1.3.0 with my project but I can install another IDE/SDK if needed.
Thanks very much!
James
LikeLike
Hi James,
many thanks for your kind words, appreciated :-).
I think (need to check) I have a FRDM-KL26Z with FreeRTOS and USB CDC running, but I have used Processor Expert. If you don’t want to use Processor Expert, you simply could delete the .pe file and you are not using Processor Expert, would that work? Other than that, I would not use the SDK 1.3.0 (it is simply too old and too complicated). Better go with the SDK v2.0, and there should be a USB CDC example (with FreeRTOS) in that SDK already (I have not checked, but it would be worthwile to check this). If I find time, I could dig out my FRDM-KL26Z board and give it a try, but it won’t be possible in the next days due other priorities 😦
LikeLike
Hi Erich,
I have just tried the FreeRTOS Task aware debugging in the MCUxpresso IDE and I am seeing the same error as I saw when trying that plugin with KDS version 3:
Ignoring packet error, continuing…
Ignoring packet error, continuing…
Is there a likely cause of this error that you could suggest?
LikeLike
The problem above occurs when I set a breakpoint and the debugger reaches the breakpoint
LikeLike
Hi Chad,
I don’t remember seing that.
what version are you using?
I have
FreeRTOS Task Aware Debugger for GDB 1.0.2.201704260904 com.nxp.freertos.gdb.tad.feature.feature.group NXP Semiconductors, Inc.
Possible reasons:
– outdated FreeRTOS: I have seen some issues with older FreeRTOS versions. I’m using the McuOnEclipse FreeRTOS port, and that one has a few extra hooks to make debugging easier with debug helpers. I always have them turned on,
– run control: what debug interface (P&E? Segger?) are you using? Make sure you have the latest versions installed. It could be that stepping/breakpoints are not working properly.
– the FreeRTOS views many reads from the targets. Does the problem occur as well if the views are not open or behind other views? The V1.0.2 plugin has a ‘pause’ button to silence it, maybe this helps?
Other than that: there is a FreeRTOS_TAD_logs folder inside the workspace, maybe this gives some clues. If this does not help, maybe open up a question in the NXP forum with the log file/information. I can try to ping the contact I have for the plugin in NXP so he could have a look.
LikeLike
I have just tested it again after removing Segger RTT from the project and it works as expected. I am using FreeRTOS 9 in stock MCUXpresso with the latest Segger software JLink_V614g with a Jlink pro. So for now I will assume it was something to do with the RTT code competing with the segger plugin.
LikeLike
That’s at least some good information. I would increase the task stack size because the Segger RTT might use some extra stack?
LikeLike
In case others are having trouble getting the configGENERATE_RUN_TIME_STATS to work, you may have to remove the “static” keyword from ulTotalRunTime. For some reason with my near vanilla Eclipse Neon.3 CDT workspace and FreeRTOS v9.0.0, the plugin was unable to find ulTotalRunTime otherwise.
// Notice that “static” is commented out:
PRIVILEGED_DATA /*static*/ uint32_t ulTotalRunTime = 0UL;
LikeLike
Hi Dan,
thanks for sharing! Interestingly, somehow I have not seen this. How did it manifest? Did you had some messages on the Console log about this?
Thanks,
Erich
LikeLike
Hi Erich, thank you so much for putting all the work into your posts. I am sure it helps lots of people. I have a question and maybe you have already thought about it. Would you be able to do a comparison between third party debuggers (JLink, P&E) and the native LPC-Link 2 CMSIS-DAP for debugging FreeRTOS?
Thanks,
Hans
LikeLike
Hi Hans,
such a comparison does not really make sense for debugging FreeRTOS, as they are all providing about the same experience. The differences (at least todate) are very minimal, e.g. for P&E and Segger you can turn off the thread debug awareness. From the speed perspective they are all more or less the same. Segger has the advantage of having ‘unlimited’ flash breakpoints and other useful tools, while P&E has good options and gdb support. The LPC-Link2 has the advantage of a very low price point of about US$20. In any case, I recommend to have one probe of each: that saved my life several times in case one probe for whatever reason had a problem. I hope that helps?
LikeLike
Pingback: Troubleshooting Tips for FreeRTOS Thread Aware Debugging in Eclipse | MCU on Eclipse
Hi Erich,
Seems FreeRTOS is the main stream of the SDK.
I am new in the FreeRTOS. Could you advise doucments for the MCUXpresso + FreeRTOS for studying?
Thanks a lot.
Best Regards,
Kent
LikeLike
Hi Kent,
I suggest you have a look at the tutorials at FreeRTOS.org (https://freertos.org/) and https://freertos.org/Documentation/RTOS_book.html
Erich
LikeLike
Hi Erich,
I have found a training presentation “FTF-DES-N1956” but cannot find the hands-on project.
Is that possible to share us the hands-on file?
Thanks a lot.
Best Regards,
Kent
LikeLike
Hi Kent,
the actual project is at https://github.com/ErichStyger/mcuoneclipse/tree/master/Examples/KDS/FRDM-K22F/FRDM-K22F_USB_Mouse_Kybd_SDK_v2.0
But I have posted as well the original material here:
https://github.com/ErichStyger/mcuoneclipse/tree/master/Examples/KDS/FRDM-K22F/FTF-DES-N1956
Erich
LikeLike
Hi Erich,
Thnanks a lot.
Happy X’mas ~
Best Regards,
Kent
LikeLike
Pingback: Performance and Runtime Analysis with FreeRTOS | MCU on Eclipse
Pingback: Understanding FreeRTOS Task Stack Usage and Kernel Awarness Information | MCU on Eclipse
Pingback: Show FreeRTOS Threads in Eclipse Debug View with SEGGER J-Link and NXP S32 Design Studio | MCU on Eclipse
Pingback: Tutorial: Using Runtime Statistics with Amazon FreeRTOS V10 | MCU on Eclipse
Pingback: First Steps with the LPC55S69-EVK (Dual-Core ARM Cortex-M33 with Trustzone) | MCU on Eclipse
Pingback: Enable Default FreeRTOS Debugging for LinkServer Debug Connections | MCU on Eclipse
Pingback: Getting Started with Microsoft Azure RTOS (aka ThreadX) | MCU on Eclipse