
From time to time I face some problems which are really hard to find. Mostly these kind of bugs are very timing sensitive and depend on interrupt execution order. Maybe a dangling pointer is overwriting memory, code is running wild, or some functions are not reentrant as they should be. For these kind of bugs, good tools are worth their weight in gold. The Percepio FreeRTOS+Trace and the Segger SystemView have helped me many times to narrow down such kind problems in my applications. Another ultimate tools is hardware trace: Now I have a Segger J-Trace Pro for ARM Cortex-M in my arsenal of bug extinguishing weapons on my desk:
Dear bugs, look what I have on my desk. Your hiding time is over! 🙂

tracing-cortex-m4-with-j-trace
Package
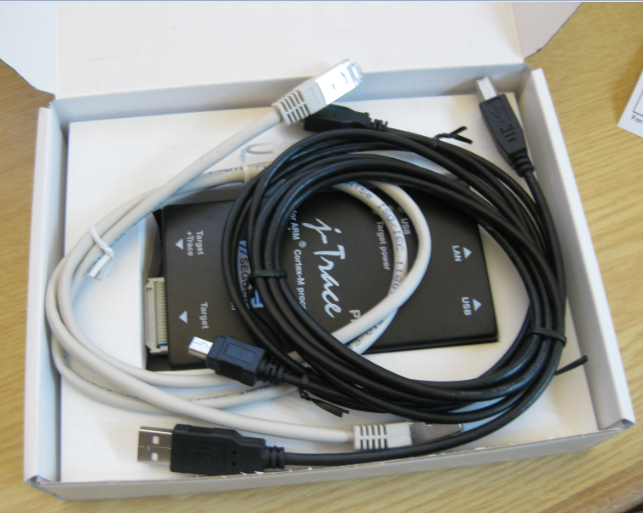
The unit came with all the cables: two USB, Ethernet, 20 pin and 19 pin Cortex ribbon cables plus a 5V/700mA USB power supply (for the small debug board, more about this later):
j-link-trace-package-open
The box includes the ‘Cortex-M Trace Reference Board‘, powered by a ARM Cortex-M4F (STM32F407VE). For this one there is the provided 5V USB power supply, the J-Trace itself gets power through the USB plug. The unit has both a USB and Ethernet/LAN host connection:

j-link-trace-with-usb-power-supply-and-cortex-m-trace-reference-board
The reference board is actually a really cool thing: I board I can use with the tutorials and don’t have to mess up with my hardware first (more about this later).

cortex-m-trace-reference-board
💡 The reference board is sold separately too, but did not find it in the Segger web shop. The trace test points are available on the board, and if more pins would be available (e.g. for a header row), that could be a cool general purpose board too.
Main features of the trace unit:
- ETM Tracing and Cortex-M debugging
- USB 2.0 (480 MBit/s) and Gigabit Ethernet interface
- ‘Unlimited’ streaming to the host
- 64 MByte on-board trace memory
- Supports all Cortex-M (M0, M0+, M1, M3, M4, M7)
- 50 MHz JTAG speed
- Can be use like a normal J-Link debugging probe
As with other Segger probes, there is Windows, Linux and Mac OS host support. I have used the J-Trace under Windows.
Debugging
The probe can be used like a normal Segger J-Link debugging probe, e.g. with the NXP Kinetis Design Studio or any IDE which supports the Segger J-Link probes. What I noticed compared to the Segger EDU or the OpenSDA implementation that it is much faster downloading :-).
Unlike the ‘normal’ Segger J-Link units, I do not need a SWD cable adapter as 20pin Cortex Debug+ETM connector (labeled “Target+Trace”):
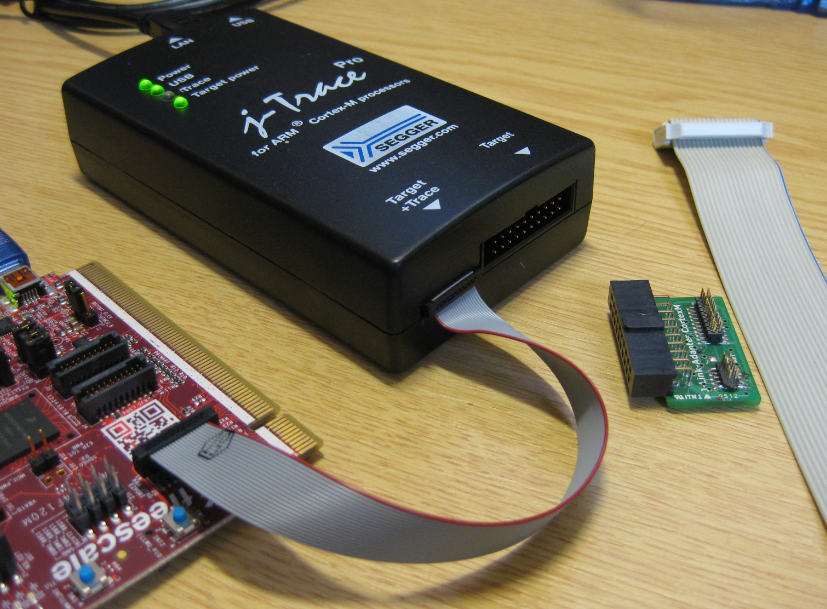
debugging-with-arm-debugetm-cable
I still could use the J-Link adapter board if needed on the ‘Target’ port (but that will be for debugging only). This makes sense if need access to the signals or want to use the 10pin debug cable instead (note that the J-Link Adapter Board is not part of the J-Trace package):

debugging-with-j-link-adapter
There are several status LEDs on the unit which are very helpful to solve possible oversights like target not powered. The ‘Trace’ LED is on when the units collects trace:

status-leds
Debugger? Ozone!
The Eclipse based Kinetis Design Studio does not include trace capabilities. CodeWarrior does, but all my current NXP projects are running either with LPCXpresso or with the NXP Kinetis Design Studio, and CodeWarrior is kept only for legacy and maintenance projects. I saw that the Segger documentation and tutorials mention Ozone. Ozone is Segger’s own debugger which of course supports the J-Link debug probes.
In case of an ’emulated’ J-Link like the OpenSDA J-Link (or J-Link EDU) firmware a dialog pops up:

ozone-license-with-oem-j-link
When I first saw the news about Segger providing their own debugger, I was kind of thinking: “Why yet another debugger?”. Well, after using it a for a few days I think it is a actually a good things: it is small (14 MByte download), it is very snappy and fast, and does its job very well:
ozone-debugger
The download/installation comes with a few CMSIS-SVD files, but I can download and add more SVD files (see for example “CMSIS-SVD Register Files with Eclipse MARS and EmbSysRegView“).
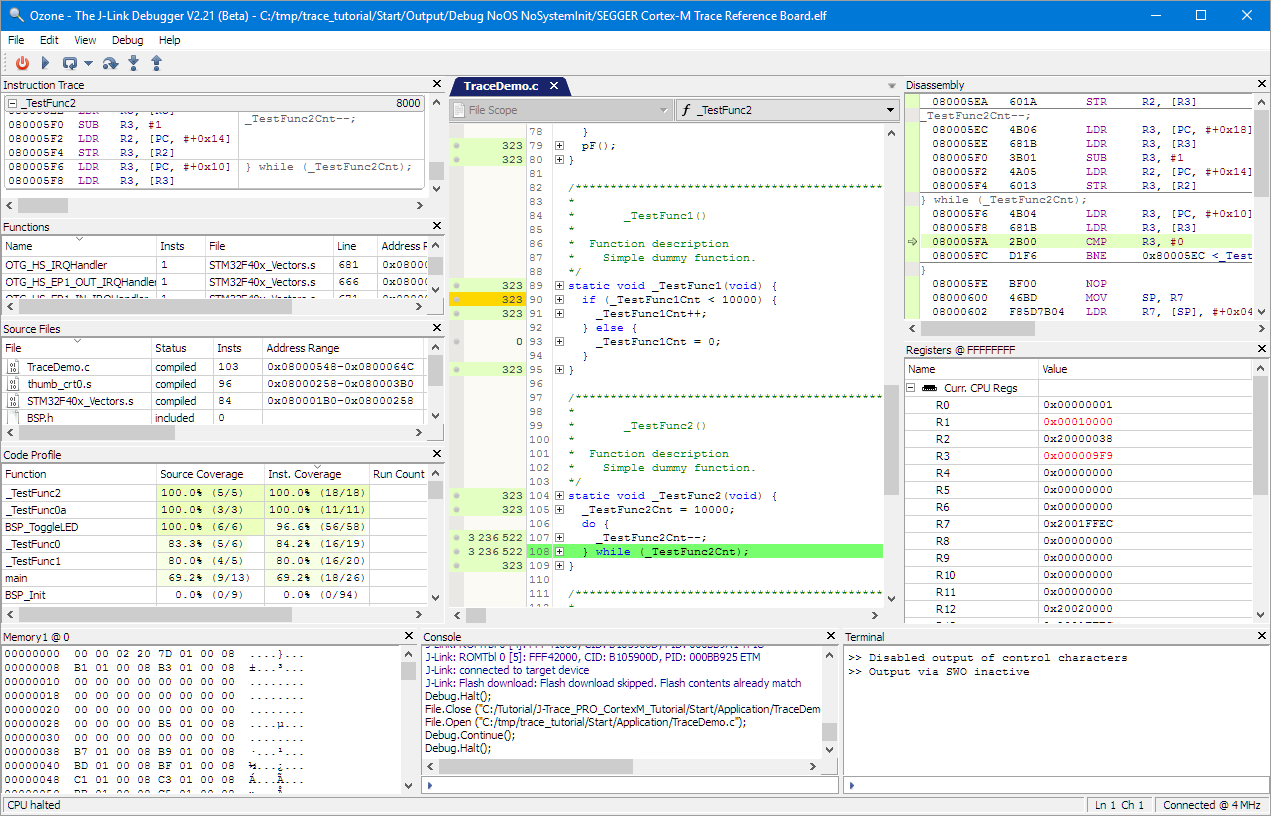
And with the J-Trace tutorial, I was indeed able to get the trace demo working in less than 15 minutes :-), using the reference board:

tracing-the-stm32
Ozone Views
Ozone features all the usual views I expect (source, memory, console/terminal, registers, disassembly, call stack) and many more:

ozone-views
Views can be moved around and put over each other to have a ‘tabbed’ view. Views can be moved out of the main window, such as to be placed on a separate monitor display.

tabbed-views
The source view offers line numbers, setting breakpoint. What I really like is that I can unfold a source line and it directly shows the disassembly code:

source-view
I miss the ability to jump directly to symbols (aka ‘go to declaration/definition’), but I understand that this is more of an IDE feature.
The debugger has an easy way to attach to an already running application (this is usually a big pain in other debuggers):

start-debugger-menu
The ‘Download & Reset Program’ does exactly that. There is no way in the UI to specify say a temporary breakpoint on main().
Scripting
Ozone has a nice scripting engine: It seems that pretty much everything is scriptable:

scripting
Actually the Ozone project files are kind of C files written in that scripting language: that way I can easily change the debugger:

ozone-project-file
Trace View
The instruction trace shows the executed instructions and shows it synced with the source and disassembly view:

instruction-trace
It automatically groups the trace instructions by the functions:

trace-grouped-by-function-names
Trace gets streamed to the host application (Ozone) is almost ‘unlimited’ that way, and I was able to collect trace for a long time.
Code Profile View
The Code Profile view shows source and instruction coverage based on the instruction counters:

code-profile-view
The execution counters can be turned on in the source view:

show-execution-counters
Eclipse
While I wish that would work the same way in Eclipse, unfortunately there is no Ozone Eclipse plugin (yet?). Just imagine: getting the instruction trace and profiling information into Eclipse, that would be fabulous :-).
I’m working with Ozone in the following way: I build the project in Eclipse and have the .elf file/project configured in Ozone for debugging. When I rebuild the .elf file, Ozone automatically detects the change and reloads it:

reload-program
Again, an Eclipse plugin would be the preferred solution, but the above way works well.
Summary
The J-Trace works really nice in combination with the Ozone debugger. First I thought that this Ozone debugger is not necessary. But it makes sense, plus it can be used with Eclipse or any other IDE.
I was able to get trace with Ozone, J-Trace and the Cortex-M Trace Reference board in a very short time early this Sunday morning. But I have spent the rest of the day to get trace out of my TWR-K64F120M board, so I have to come up with a follow-up article. This is why I think Segger includes that trace reference board as a starting point: Getting trace out of the Tower board was not easy because of wrong board documentation and example code, and trace pins used for other board components. This is not the fault of Segger, but it made it clear to me why Segger provides that reference board: “it simply works”.
The follow-up article about tracing Kinetis with the J-Trace has to wait for a few days until I find time to publish it, so stay tuned. And to all the bugs out there: You have a few days more to hide, but not more! 🙂
Happy Tracing 🙂
Links
- Segger J-Trace Pro for ARM Cortes-M: https://www.segger.com/jtrace-pro-cortex-m.html
- ARM CoreSight ETM-M4 description: http://infocenter.arm.com/help/topic/com.arm.doc.ddi0440c/DDI0440C_etm_m4_r0p1_trm.pdf
- Community discussion about ETM on Kinetis: https://community.nxp.com/thread/349983 and https://community.nxp.com/thread/300553
- ETM on Freescale Tower Boards: https://community.nxp.com/thread/349983
- Cortex-M Debug Adapters: http://infocenter.arm.com/help/topic/com.arm.doc.faqs/attached/13634/cortex_debug_connectors.pdf
- J-Trace and Ozone tutorial video: https://www.youtube.com/watch?v=hl7WdxnD9k0
- Segger Ozone: https://www.segger.com/ozone.html

Nice tutorial, thanks for sharing it.
What you say about TRACE Tool from iSYSTEM ?
LikeLike
Hi Erich, great review, have you considered using the ethernet port? I received my Jlink Pro today. ( just the Jlink for now) I opted for the Jlink-Pro incase in future I might need Galvanic isolation from the target due to safety or noise issues. The other situation where debugging over ethernet could be useful but also the ability to debug something that is somewhere on a network and not in proximity to the development machine. This leads to the question, could you trace debug something if its located in another country ?
LikeLike
Yes, I do consider using the Ethernet port (I just had not had the time yet). I wanted to use it for a project where I need galvanic isolcation. Using a WLAN router and the Segger connected I can do remote debugging without wire/physical connections for safety reasons.
About your question: I think that will depend to some extend on network packet latency and network bandwidth. But as long as the needed ports are open and you can access the hardware (VPN, maybe?). Have you considered the Segger Remote tool (https://www.segger.com/pr-j-link-remote-server.html)?
LikeLike
Do we have a cheap alternative of J-link debugger for Cortex-M
We are using gnu arm debugger with J-Link as GDB server, we are looking for paid alternative but not as costly as J-Link base. we can’t use J-Link lite cortex-m as its license says that it can be used only with eval kit with which it came.
LikeLike
Have a look at the J-Link EDU (for educational and non-commercial usage), maybe this fits what you are doing?
LikeLiked by 1 person
I have a J-Link EDU as I only began approaching ARM last year, while I own a ton of stuff for AVR.
The EDU version works great, but as I plan to start designing around ARM µCs, also thanks to this article, I think I’ll get myself a J-Trace 🙂
LikeLike
The only downside I see is that the J-Trace as a tracing unit is not well supported in open IDE’s as Eclipse.
LikeLike
Hello Erich,
This looks interesting. The disassembly live in the code is nice. If you expand the section does it automatically step through the assembly?
Do you think it could be scripted to optionally start System Viewer or is the scripting only for dealing with the chip itself?
How does the call stack behave with FreeRTOS or any RTOS? Are you able to see multiple tasks and their call stack?
Thank you,
Jason
LikeLike
Hi Jason,
yes, if you expand the assembly code setion, it does a assembly stepping in this section automatically. I have not tried much of the commands, but there are things like Target.GetReg which are dealing with the target, or things like Target.ReadU8 so this is definitely possible. The call stack does (at least currently) does not show multiple task thread stacks, it just shows the current context. But maybe this is something Segger considers as a future feature already?
LikeLike
Hi Jason,
ups, sorry! Ozone *does* support RTOS awareness, see bottom of https://www.segger.com/ozone.html. I have not tried that yet, but certainly is able to do this. I will check it out myself too.
Erich
LikeLike
Pingback: FreeRTOS Kernel Awareness with Ozone | MCU on Eclipse
Pingback: Tutorial: Using Single Wire Output SWO with ARM Cortex-M and Eclipse | MCU on Eclipse
Pingback: Tutorial: Getting ETM Instruction Trace with NXP Kinetis ARM Cortex-M4F | MCU on Eclipse
Hello Erich,
we bought the same j-trace pro from Segger to trace a K64 project with a multi-stage bootloader. Therefore we need to “Attach to Running Program”. We are testing with the STM32 reference board and the TraceDemo project. Unfortunately the trace capability only seems to work with the option “Download & Reset Program”, but not with “Attach to Running Program”. Do you have a similar experience, or have we made something wrong?
Best Regards, Peter
LikeLike
Hi Peter,
I have not used ‘attach’ (yet) with trace. But what comes to my mind is that you would need to turn on trace on the hardware. The attach itself (in my view) would not turn that on. You might need to write a custom script to turn on trace when you attach.
I hope hope this helps,
Erich
LikeLike
Pingback: What is “Realtime Debugging”? | MCU on Eclipse
Pingback: Debugging ARM Cores with IP based Debug Probes and Eclipse | MCU on Eclipse