I kind of hoped that after “Why I don’t like printf()” and all my other articles about printf and semihosting, that topic would be 200% handled and I won’t have to deal with any more. Well, I was wrong and underestimated how the Kinetis SDK is interfering with semihosting. And I underestimated how many of my readers are still using semihosting (even as there are other and better alternatives), so I keep getting questions and requests for help. That’s ok, and I hope I can help :-).
So here is yet again another post about how to turn on semihosting with Eclipse, GNU ARM Embedded and the Kinetis SDK v2.0. This time with the FRDM-K64F board:
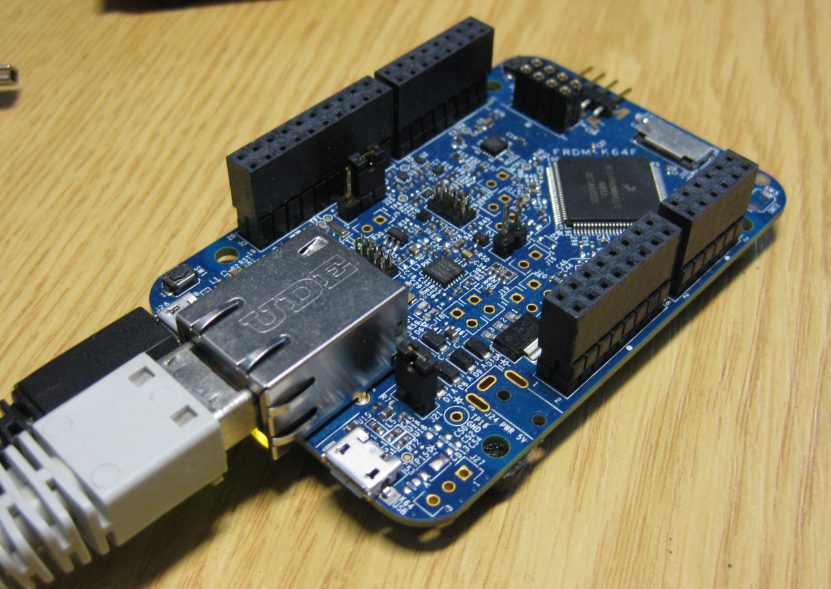
FRDM-K64F Board
In this post I’m using:
- NXP FRDM-K64F Board
- GNU ARM Embedded toolchain and libraries
- GNU ARM Eclipse build and debug plugins
- Eclipse based Kinetis Design Studio V3.2.0
But things should be applicable to any other/similar configuration.
Creating Project
I create a new project with File > New > Kinetis SDK V2.x menu and wizard for the board I want to use. I include all drivers:

Project Creation
Exclude from Build
The SDK debug console and sbrk implementation conflicts with semihosting in the ARM libraries, so exclude from the build:

Exclude from build
For this, right-click on the file and check that check box (see “Exclude Source Files from Build in Eclipse“):

Excluded from Build
rdimon.specs
In the linker settings of the project, turn on semihosting library with rdimon:
-specs=rdimon.specs

Nano Library with Rdimon
Additionally I have the newlib-nano (–specs=nano.specs) turned on.
Disable Debug Console in Compiler Settings
Because the SDK debug console is still used in many places of the SDK, turn it off with the following defined symbol:
SDK_DEBUGCONSOLE=0

Added Define to disable debug console
Add missing include SDK Sources
The SDK sources lack an important header file include, so add
#include <stdio.h>
to fsl_debug_console.h:

Added Missing Include
Example
In main.c I have added an example code:
#include "board.h"
#include "pin_mux.h"
#include "clock_config.h"
#include <stdio.h>

static int i = 0;
/*!
 * @brief Application entry point.
 */
int main(void) {
  /* Init board hardware. */
  BOARD_InitPins();
  BOARD_BootClockRUN();
  //BOARD_InitDebugConsole();

  /* Add your code here */
  for(;;) {
    printf("hello world!\r\n");
    fprintf(stdout, "Stdout output: %d\r\n", i);
    fprintf(stderr, "StdErr output: %d\r\n", i);
    i++;
  }
  for(;;) { /* Infinite loop to avoid leaving the main function */
    __asm("NOP"); /* something to use as a breakpoint stop while looping */
  }
}
- Do not forget to include <stdio.h>
- Disable call to BOARD_InitDebugConsole()
Debugger settings for semihosting
In the debugger launch configuration, turn on semihosting (shown below for Segger J-Link, P&E Multilink is similar):
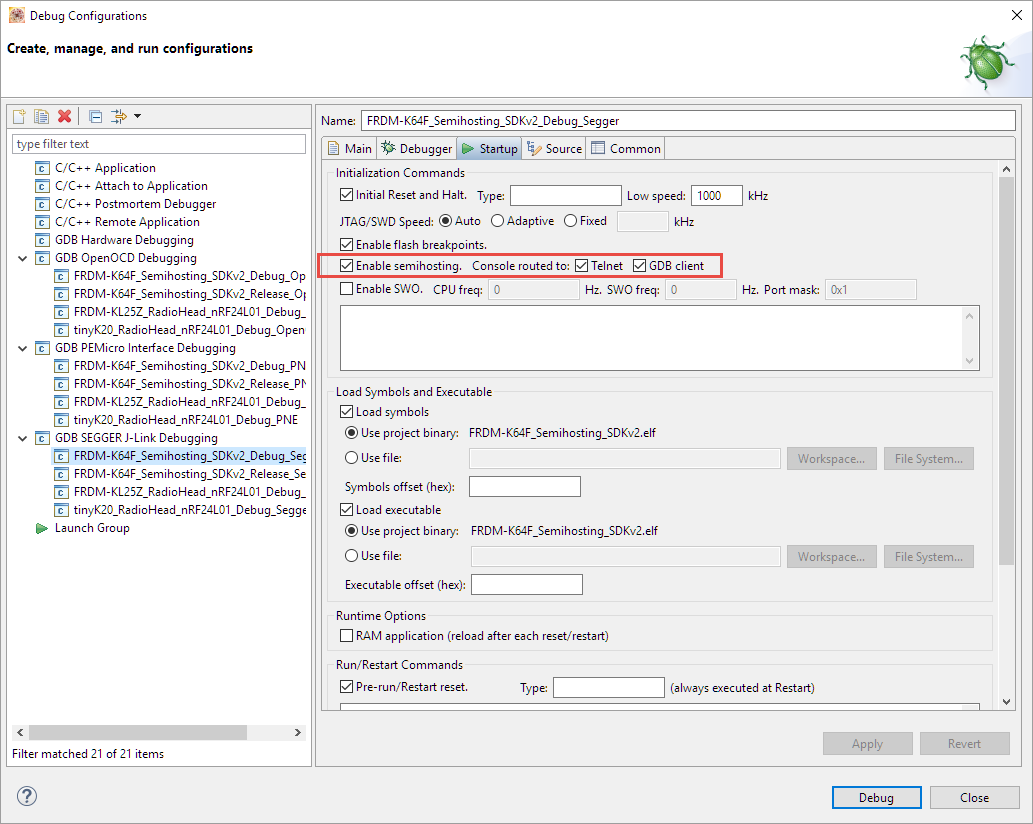
Semihosting in the Debugger Settings
Semihosting Output
In the debugger, now the semihosting output is visible with clicking on the semihosting ‘thread’ or selecting the semihosting output in the console:

Semihosting output
💡 If you pay close attention to the output, you will see that the stderr output is a char only. From my research this is a problem in the GNU ARM Embedded newlib nano libraries. If you are not using stderr, this should not be a concern for you.
Troubleshooting
You should see a message in the semihosting console right up in main() like this:
SEGGER J-Link GDB Server V6.00e - Terminal output channel

Semihosting initial output in console
If you do not see such a first message, somehow the GDB server is not in semihosting mode. There should be something like this in the GDB Server console:
Semi-hosting enabled (Handle on BKPT)
Semihosting I/O set to TELNET and GDB Client

semihosting status in GDB Server
If this is not the case: I have found that several SDK launch configurations seem not to be setup properly and the settings are not properly used. Check again the settings in the launch configuration: if they are properly set, disable the settings, press Apply button and set them again then use the Apply button again, followed by Debug:
Semihosting in the Debugger Settings
Then it works most of the time. I’m not clear if this is a problem of the Segger J-Link libraries (there has been many updates recently) or a problem of the GNU ARM Eclipse plugins, or a problem of the SDK generated projects. As for reference, I’m using this configuration:
- Segger J-Link V6.00e
- GNU ARM Eclipse J-Link Debugging 4.1.1.201606210758
UPDATE
After a while, I have found what was causing the problem for me. The problem was that the same port was used as for the SWO port (2332):

Wrong Telnet Port
Fixing it to the correct value of 2333 solved the problem 🙂 :

Fixed Telnet Port
Summary
I hope this helps you all to get semihosting up and running with the NXP Kinetis SDK. Again, best would be not to use semihosting at all: it is really not ideal for any embedded application (code bloat, uses lots of stack and RAM, potentially blocks the microcontroller if no debugger is attached, …). But up to you ;-).
I have put my project used in this article on GitHub: https://github.com/ErichStyger/mcuoneclipse/tree/master/Examples/KDS/FRDM-K64F120M/FRDM-K64F_Semihosting_SDKv2
Happy Semihosting 🙂
Links
- Semihosting with Kinetis SDK V2.0: Semihosting with Eclipse and the NXP Kinetis SDK V2.0
- Project on GitHub: https://github.com/ErichStyger/mcuoneclipse/tree/master/Examples/KDS/FRDM-K64F120M/FRDM-K64F_Semihosting_SDKv2

If you suspect a problem with the J-Link plug-in, try to document how to reproduce it and open a ticket on GitHub.
LikeLike
It seems random to me. I checked the .launch file and the settings are in there. Is there way to see what is passed from the plugin to the GDB server? I did not see a log what is passed as parameter to the segger?
LikeLike
> Is there way to see what is passed from the plugin to the GDB server?
right click on the JLinkGDBServerCL.exe.
LikeLike
Ah, interesting, I did not know abotu this :-). I see that parameters are looking ok. And that semihosting is not passed that way (as launch parameter), but as monitor command. I see them in the GDB traces:
137,657 21monitor speed 1000

137,657 22monitor clrbp

137,657 23monitor reset

137,657 24monitor halt

137,657 25monitor regs

137,657 26flushreg

137,657 27monitor speed auto

137,657 28monitor flash breakpoints 1

137,657 29monitor semihosting enable

137,657 30monitor semihosting IOClient 3
So I’m coming to the conclusion that this is not a problem in your plugin, but either in gdb or in the Segger version.
Because in the JLinkGDBServerCL I see the following:
Reading 19 bytes @ address 0x200001B8

...Target halted for semihosting, waiting for GDB handling

Read 1 bytes @ address 0x2000012B (Data = 0x53)

...Target halted for semihosting, waiting for GDB handling

Reading 14 bytes @ address 0x200001B8

...Target halted for semihosting, waiting for GDB handling

Reading 19 bytes @ address 0x200001B8

...Target halted for semihosting, waiting for GDB handling

Read 1 bytes @ address 0x2000012B (Data = 0x53)

...Target halted for semihosting, waiting for GDB handling

Debugger requested to halt target...
But still nothing shows up.
I’m using this GDB
GNU gdb (GNU Tools for ARM Embedded Processors) 7.6.0.20140731-cvs
So I’ll try to isolate the problem with different versions of the GDB server and client.
Thanks!
LikeLike
ah, I remember some problems both with old GDBs and old J-Link software, so I would try with the latest versions to see if it makes any difference.
LikeLike
Hi Liviu,
I tried with different GDBs and Segger versions, the problem was still there: In most cases (maybe 8 out of 10 tries) it was not able to show the semihosting messages in the terminal view. It turned out the problem was a wrong setting in the launch configuration: it used port 2332 instead of 2333 for the telnet port. Changing it to 2333 solved the problem :-). That wrong port somehow comes from the project created by the NXP wizard, so I have reported it as a bug now.
LikeLike
The only reason I use semihosting is so that I can print out certain messages during debugging. Maybe I’m old school, but I found that I can get to a problem faster by just sticking some printfs in and just letting the code run, rather then stepping through with the debugger.
So I did get semihosting eventually working *without* following any of your steps. I did rename _read, _write and _sbrk so that might be equivalent. One thing I noticed is that the default debug config for Segger has the semihosting telnet port set to 2332, which I think should be 2333.
But I think I agree with you — I need to stop using printf and just deal with gdb. 🙂
LikeLike
Glad to hear you are up and running!
The most problematic case I have seen with semihosting is that it blocks if there is no debugger attached to handle it. Happend to me with some hidden assert macros which were using semihosting printf. That depends on the semihosting implementatin/library of course. But it is very dangerous to have such a blocking thing left over in release code and targets on the field. Then you really depend on the watchdog to get the system back on track.
There is nothing bad to print messages: it is way better just to use puts or normal ‘write string’ routines than printf(). Printf() with is open argument list is really bad for safety concerned systems and should not be used at all. But that’s probably because I’m old school too :-).
LikeLike
> semihosting … blocks if there is no debugger attached to handle it
The projects generated by the GNU ARM Eclipse wizards include an elaborated HardFault_Handler that ‘swallows’ the semihosting calls, so you can run applications with semihosting output standalone, without a connection to the debugger (see system/src/cortexm/exception_handlers.c).
LikeLike
Hi Robert,
indeed, I had somehow that telnet port set with the wrong number. It was using the same port as for the SWO causing problems :-(. Thanks for the hint!
LikeLike
Pingback: Eclipse and GDB: Process Properties, Arguments and GDB Traces | MCU on Eclipse
> best would be not to use semihosting at all
this is a bit extreme.
semihosting is the ideal setup for running unit tests, you can provide input data for the test from a file, you can write the test results into a file or you can simply return an exit code, so that the script runing the tests will break.
for embedded applications it is true that the poor performance of the semihosting debug stream can be a problem, but in this case the trace stream can be routed to SWO or, more recently, to SEGGER RTT, which is way faster than semihosting.
the projects generated by the GNU ARM Eclipse wizard use a separate trace channel, accessed via trace_printf(), which can be routed to semihosting output, semihosting debug, SWO and recently RTT, and I highly recommend this solution, it has nothing to do with full semihosting, it is only a simple trace output channel.
LikeLike
Yes, my concern is about the intrusivness of semihosting. As you say, Segger RTT is a much better alternative. SWO unfortunately is not an option as many small devices do not have SWO. The other concern with the usual printf() is the usage of open argument lists and excessive stack usage. Again, using things like Segger RTT is a much better alternative.
LikeLike
I suggest you take a look at how the trace infrastructure is implemented in CMSIS++ (https://github.com/micro-os-plus/cmsis-plus/blob/xpack/include/cmsis-plus/diag/trace.h). It is a generic API, that is neutral to the actual output, and a simple implementation API (an initialise() and a write()), which can be routed to an device. I provide implementations for semihosting output, semihosting debug, ITM and SEGGER RTT. Selecting one output or another is done via several preprocessor defines.
I guess you can build a PE component for this, using the similar approach.
Having a separate trace channel, that does not depend on anything else from the application setup, like retargeting, newlib impure, etc is very, very convenient.
The C++ API is documented here: http://micro-os-plus.github.io/reference/cmsis-plus/group__cmsis-plus-diag.html; the C API is similar.
LikeLike
> I need to stop using printf and just deal with gdb.
sure, if you have plenty of time to burn, the information you can get in a matter of minutes from a log you can also get in hours from single stepping through a long program and visually inspecting the values. this is very useful if you are paid by the hour, and want to impress your boss how hard working you are 😉
carefully placed trace output is sometimes the only solution when debugging real-time applications that need to implement a communication protocol; you can simply not place a breakpoint inside the fast executing code, since the peer will immediately timeout.
LikeLike
Hi Erich.
I have clone a project using “KSDK Project Generator — 2.2”, follow your guide do every thing, but printf not show anything in semihost console. after some search, I found a “nosys” hiding in Linker option, “Libraries (-l)” .
and I delete “nosys” item, semihost printf appear, 🙂
may be my experience can help someboby.
Cai.
LikeLike
That’s a really good point to check, thanks for sharing. I rarely use the project generator, so I have not seen that it burries the option deep in the settings. Thanks!
LikeLike
Pingback: Tutorial: Using Single Wire Output SWO with ARM Cortex-M and Eclipse | MCU on Eclipse
Hi Erich, as I understand, ProcessorExpert and Kinetis Design Studio are being phased out/changing to fit with NXP’s tools. Presently though, I’m developing for a K26 and I’d really like to stick with my existing toolchain – unfortunately though, KDS forces me to use the KSDK when I select the K26 processor but I really do not want to use KSDK. Is there any way for me to go about using PE with KDS and the K26? Or is there no way around this? Thanks, Kevin
LikeLike
Hi Kevin,
There is one way around this, have a read at https://mcuoneclipse.com/2017/03/25/tutorial-using-eclipse-with-nxp-mcuxpresso-sdk-v2-and-processor-expert/.
But this way only allows you to use Processor Expert with components like the ones I have created which are able to work with ‘native’ Processor Expert and with the SDK.
It works very well as long as no hardware resources are needed. For the hardware I have ported a few peripherals which can be used with the SDK: SysTick (with FreeRTOS), GPIO and UART. I2C and SPI are right now only supported with bit banging (GPIO). I do have a timer component in the works (on GitHub, not released as .PEupd yet). Bottom line is that I can do small things, but I cannot keep up with all the new devices and peripherals on my own. So you can use Processor Expert with the K26, but only in a restricted way 😦
LikeLike
So glad your articles exist, Erich! Initial experimentation with the NXP Kinetis KE18F, forced to use the new MCUXpresso so everything is new … walking through the example codes, “hello world” displays a message in the MCUXpresso debug console so “good, all working” but then the “pflash” example displays nothing. I found it was sending out RS232 instead and only lots of back and forth comparisons got me discovering the subtle differences (which is that the “hello world” has the SDK_DEBUGCONSOLE=0 in it, while the other example does not)
LikeLike
Glad to hear that things are useful :-). If you received the text in the debugger console, then it means that you used the semihosting feature?
LikeLike
Yes … eventually! What confused me was seeing RS232 data on the pin from target to debug host processor but not seeing anything on the PC. I need to figure how to get the (CMSIS?) RS232 input display into the MCUXpresso …
LikeLike
Pingback: Tutorial: Porting BLE+NRF Kinetis Design Studio Project to MCUXpresso IDE | MCU on Eclipse
Pingback: Tutorial: How to Optimize Code and RAM Size | MCU on Eclipse