I mentioned the hands-on sessions on FreeRTOS I do this week at NXP FTF Tech Forum in Austin in my previous post. What we are using in the session is an Eclipse plugin in Kinetis Design Studio showing all kinds of FreeRTOS information:

NXP FreeRTOS Plugin in Kinetis Design Studio
That Task Aware Debugger (TAD) plugin is not publicly released yet. The plugin should work with any standard Eclipse and GDB, and I have been running on the Eclipse Luna based NXP Kinetis Design Studio V3.2.0. with the NXP Kinetis SDK v2.0 on a FRDM-K22F board (it works as well fine on a FRDM-KL46Z board).
Installation is through the normal Eclipse ‘Install New Software’ process. The plugin adds a FreeRTOS menu from where I can open different views:

FreeRTOS Menu
The views are accessible through the normal Window > Show Views command:

NXP FreeRTOS Views
The Timer List lists all the FreeRTOS software timers with the data and status:

FreeRTOS Timer List
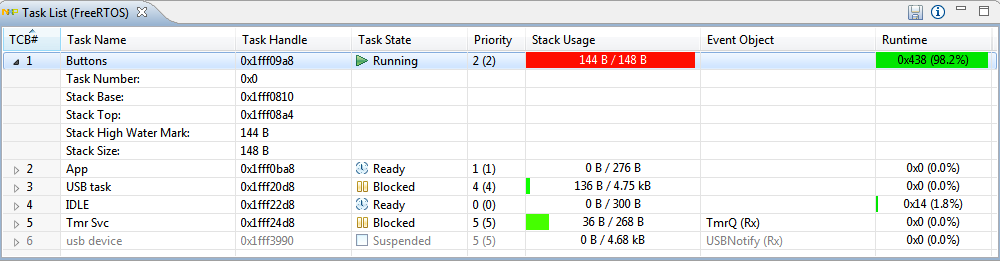
The Task List shows all the task in the system with their status. A very useful thing is to see the colored status of the task stack usage:

FreeRTOS Task List
The Queue List shows all the queues and semaphore/mutex (because FreeRTOS implements them as ‘queues with no data’), plus the data behind the queues:

FreeRTOS Queue List
The Heap Usage lists the FreeRTOS heap status with all the memory blocks allocated in it:

FreeRTOS Heap Usage
Each of the views has a button to export the data in into a CSV format file:
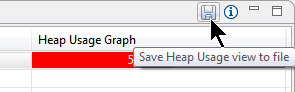
Save to File
The plugin works in ‘GDB stop mode’: I have to halt/suspend the target board with the debugger, then the plugin reads all the RTOS data from the device through the GDB commands.
The plugin should be available soon, and if you are NXP FTF this week (class FTF-DES-N2048 is today), you can get your hands on it. Together with the Eclipse GDB thread awareness (see “FreeRTOS Thread Debugging with Segger GDB in Eclipse“) this is a big step forward to me for anyone doing FreeRTOS development :-).
Happy Awaring 🙂

wow. very impressive!
how strong is this dongled to nxp parts ?
LikeLike
I have not yet used it for non-NXP parts, but I don’t see any reason why it should not work for others too.
LikeLike
Task Aware Debugger (TAD) plugin – Is the plugin provided by NXP or Segger?
LikeLike
It is provided by NXP.
LikeLike
It is provided by NXP.
Is it similar to Segger’s SystemView (or does it offer more options other than IDE integration?)
LikeLike
It is similar to https://mcuoneclipse.com/2013/08/04/diy-free-toolchain-for-kinetis-part-5-freertos-eclipse-kernel-awareness-with-gdb/, but more powerful with better views.
LikeLike
Will you be able to post the hands-on session(s) on the blog, for the people that could not attend the event, as i for one would be very interested 🙂
LikeLike
The slide material is (will) be available for everyone from the NXP FTF site. The project used in the labs is already on GitHub here: https://github.com/ErichStyger/mcuoneclipse/tree/master/Examples/KDS/FRDM-K22F/FRDM-K22F_USB_Mouse_Kybd_SDK_v2.0
LikeLike
Hello Eric, you have no idea how your blog has always been so helpful.
So I got stuck with an issue, hoping to get a reply on it from you. So earlier I used KL25z to connect to cloud using TCP/IP using a GSM module. But now I have the requirement of sending it via HTTPS. Is it possible using KL25 board.if so then how? Please help me, will be glad to get a reply from you.
Thanks
LikeLike
Hi Sabbi,
if you were using TCP/iP with the KL25Z, you should be able to use HTTP. However, to use HTTPS it requires more ressources/RAM for the secure connection. It all depends what your GSM modem is able to provide you on that level. And what level of RAM buffers you need. So I cannot give a definitive answer: it all depends on your legroom you have and need on the device.
Erich
LikeLike
Is NXP going to release the source code for this plug-in? I don’t use FreeRTOS, but I’d like to take this plug-in and adapt it for another RTOS.
LikeLiked by 1 person
I assume so as it is a Java plugin, but you would have to check the licensing terms which are coming with it.
LikeLike
if NXP is ready to contribute this back to the open source community, I’m considering integrating similar functionality in GNU ARM Eclipse.
LikeLike
Any idea when we are likely to see this released? Looks like it would be super useful for some debugging I am doing.
LikeLike
Hi Michael,
I don’t know about a date for a release.
Erich
LikeLike
Any updates on this or is it possible to get a beta copy?
LikeLike
Hi Michael,
I have asked to get notified when it is available. For sure I will post an article by then.
Erich
LikeLike
Pingback: FreeRTOS Kernel Awareness for Eclipse from NXP | MCU on Eclipse
Hello Erich,
I’m having trouble understanding the stack size in the Stack Usage column of Task List. The stack sizes shown in Task List don’t seem to correlate with the stack depth I define when creating a task.
I know the stack size is supposed to be equal to the stack depth ( which I pass to xTaskCreate ) multiplied by the stack width. When I observe the stack size, none of them are the sizes I expect.
I know I’m missing something because two tasks I create with the same stack depth will have different stack sizes.
Thanks!
LikeLike
Hi Jake,
your observation is correct. The problem is that that the FreeRTOS public data structure which is accessed by the plugin only has information about the stack beginning and the current stack pointer (stack top), but not about the stack end/size. That’s why I report all the information with the command line shell component for FreeRTOS, e.g.
TCB Static Handle     Name         State    Prio    Stack Beg  Stack End  Size    Stack Top            Unused  Runtime

2   yes(2) 0x1FFF0A88 Shell        Running  (1,1)   0x1FFF19BC 0x1FFF0AE8  3800 B 0x1FFF193C (  132 B)  3064 B 0x00000E53 ( <1%)

4   yes(2) 0x1FFF1D40 IDLE         Ready    (0,0)   0x1FFF1FF4 0x1FFF1DA0   600 B 0x1FFF1F94 (  100 B)   512 B 0x00062087 ( 98%)

1   yes(2) 0x1FFF19C0 Stim300      Blocked  (3,3)   0x1FFF1D3C 0x1FFF1A20   800 B 0x1FFF1C9C (  164 B)   580 B 0x00000004 ( <1%)

3   yes(2) 0x1FFF0000 Logger       Blocked  (2,2)   0x1FFF0A84 0x1FFF0060  2600 B 0x1FFF05C4 ( 1220 B)  1300 B 0x0000000B ( <1%)

5   yes(2) 0x1FFF1FF8 Tmr Svc      Blocked  (4,4)   0x1FFF2374 0x1FFF2058   800 B 0x1FFF22F4 (  132 B)   472 B 0x00000F26 ( <1%)
And here is what the plugin reports for the IDLE task:
4	IDLE	0x1fff1d40	Running	0 (0)	0 B / 500 B		0x78e69 (98.2%)

	Task Number:	0x0

	Stack Base:	0x1fff1da0

	Stack Top:	0x1fff1f94

	Stack High Water Mark:	0x1fff1f94

	Stack Growth Direction:	Down
It report 500 and not the actual 600 bytes of stack because it does not know where the end of the stack is.
LikeLike
Thanks for the quick reply!
I’m still left with a couple of questions about the plug in, but seeing that your FreeRTOS component provides the info I need through the shell, I’ll just make the switch to your component rather than the SDK1.3 freertos component.
LikeLike
Hey Sorry, this is out of context. But can anyone help me on how to send a jpeg image file using KL25Z over TCP/IP? Thanks in advance
-xo, Sabbi
LikeLike
Hey Erich,
I switched over to your FreeRTOS componenet, I’m already enjoying some of the Debugging tools that come with it.
With that said I’ve ran into an issue that wasn’t happening when I was using the KSDK’s freertos component. I was hoping you could give me a little insight.
My program keeps getting stuck in the IDLE task after a OSA_TimeDelay or OSA_MutexLock call.
At first I thought it may be a priority issue because all the tasks have a priority of 0 ( tskIDLE_PRIORITY ). But I do have “Idle Should Yield” enabled, plus if I raise the priorities of the other tasks the issue isn’t fixed.
When I open up Task List, it shows that all the tasks are BLOCKED and IDLE is running.
I know when I call OSA_TimeDelay or OSA_MutexLock, the task becomes blocked, I’m just not sure why its not becoming unblocked.
Anything that may point me in the right direction, is much appreciated.
Thanks
LikeLike
I found the issue. SysTick_Handler() is never being ran thus xTaskIncrementTick is never executed.
This is out of the scope of this article but is more related to this blog post (https://mcuoneclipse.com/2015/07/08/tutorial-using-processor-expert-and-freertos-with-kinetis-sdk-v1-2/)
I followed the above article, setting the fsl_os_abstraction to baremetal and no timer. Plus I’ve enabled the Systick in the FreeRTOS component.
LikeLike
Hi Jake,
ah, ok, thanks for reporting back on the solution so others could benefit from it, appreciated!
Erich
LikeLike
I’m using this tool for my stm32 projetc with gnu arm eclipse.
everything seems work good but in the Task List window, the list of runtime show nothing 🙂
do you know how should I do please..
I’m not use timer in my project.Is this problem?
hope your replay,
forget my terrible English 🙂
Thank you.
LikeLike
Hi Aaron,
for the performance analysis and runtime counters, you need to have some kind of timer for the measurement, either use the Systick (as possible with my port for NXP Kinetis) or your own timer (should be 10x the freqency of systick).
Additionally, you need to turn on configUSE_TRACE_FACILITY and config_GENERATE_RUNTIME_STATS.
I hope this helps,
Erich
PS: see as well https://mcuoneclipse.com/2016/07/06/freertos-kernel-awareness-for-eclipse-from-nxp/
LikeLike
Hi Erich,
my reply disappered~~~~
so I’m rewrite this [cry]
I have done this (use STM32 TIM5 with 10x of the freqency of freertos tick freq), and I can print the runtime state use uxTaskGetSystemState with semihosting~
names status ID priority stack CPU usage
debugTask R 1 0 90 t<1%
IDLE R 4 0 115 99%
ledTask B 3 3 51 t<1%
defaultTask B 2 3 16 t DEBUG_INIT_0 (SUSPENDED, USER_REQUEST)
11:14:54.735 INFO: [TadState] TAD state changed: DEBUG_INIT_0 -> DEBUG_INIT_1 (RESUMED, USER_REQUEST)
11:14:58.978 INFO: [TadState] TAD state changed: DEBUG_INIT_1 -> DEBUG_SUSPENDED (SUSPENDED, SIGNAL)
11:15:01.531 INFO: [TadState] TAD state changed: DEBUG_SUSPENDED -> DEBUG_RESUMED (RESUMED, USER_REQUEST)
11:15:03.974 INFO: [TadState] TAD state changed: DEBUG_RESUMED -> READY (SUSPENDED, SIGNAL)
11:15:03.984 INFO: [Benchmark] Loading data for “Task List” has started.
11:15:04.646 EXCEPTION: [QueueFactory] ReadingException in class “com.nxp.freertos.gdb.tad.controller.queuelist.QueueFactory” at 187. line when calling method “readIntAtAddress(0x200002b8, QueueDefinition, xTasksWaitingToSend.uxNumberOfItems)”
com.nxp.freertos.gdb.tad.controller.TadFactory.readIntAtAddress(TadFactory.java:213)
com.nxp.freertos.gdb.tad.controller.queuelist.QueueFactory.getQueue(QueueFactory.java:187)
com.nxp.freertos.gdb.tad.controller.queuelist.QueueFactory.getData(QueueFactory.java:109)
com.nxp.freertos.gdb.tad.model.TadModel$3.execute(TadModel.java:237)
com.nxp.freertos.gdb.tad.model.TadModel$4.run(TadModel.java:356)
11:15:04.647 ERROR: [TadFactoryData] Could not load data for “Queue List” view! For more information check TAD log
11:15:05.149 EXCEPTION: [TaskFactory] ReadingException in class “com.nxp.freertos.gdb.tad.controller.tasklist.TaskFactory” at 109. line when calling method “getSize(pxReadyTasksLists)”
com.nxp.freertos.gdb.tad.controller.TadFactory.getSize(TadFactory.java:116)
com.nxp.freertos.gdb.tad.controller.tasklist.TaskFactory.getData(TaskFactory.java:109)
com.nxp.freertos.gdb.tad.model.TadModel$3.execute(TadModel.java:256)
com.nxp.freertos.gdb.tad.model.TadModel$4.run(TadModel.java:356)
11:15:05.150 ERROR: [TadFactoryData] Could not load data for “Task List” view! For more information check TAD log
11:15:05.151 INFO: [Benchmark] Loading data for “Task List” took 1167 ms.
11:15:12.28 INFO: [TadState] TAD state changed: READY -> DEBUG_RESUMED (RESUMED, USER_REQUEST)
11:15:15.594 INFO: [TadState] TAD state changed: DEBUG_RESUMED -> READY (SUSPENDED, SIGNAL)
11:15:15.596 INFO: [Benchmark] Loading data for “Task List” has started.
11:15:16.208 EXCEPTION: [QueueFactory] ReadingException in class “com.nxp.freertos.gdb.tad.controller.queuelist.QueueFactory” at 170. line when calling method “readLongAtAddress(0x200002b8, QueueDefinition, u.pcReadFrom)”
com.nxp.freertos.gdb.tad.controller.TadFactory.readLongAtAddress(TadFactory.java:158)
com.nxp.freertos.gdb.tad.controller.queuelist.QueueFactory.getQueue(QueueFactory.java:170)
com.nxp.freertos.gdb.tad.controller.queuelist.QueueFactory.getData(QueueFactory.java:109)
com.nxp.freertos.gdb.tad.model.TadModel$3.execute(TadModel.java:237)
com.nxp.freertos.gdb.tad.model.TadModel$4.run(TadModel.java:356)
11:15:16.209 ERROR: [TadFactoryData] Could not load data for “Queue List” view! For more information check TAD log
11:15:16.711 EXCEPTION: [TaskFactory] ReadingException in class “com.nxp.freertos.gdb.tad.controller.tasklist.TaskFactory” at 109. line when calling method “getSize(pxReadyTasksLists)”
com.nxp.freertos.gdb.tad.controller.TadFactory.getSize(TadFactory.java:116)
com.nxp.freertos.gdb.tad.controller.tasklist.TaskFactory.getData(TaskFactory.java:109)
com.nxp.freertos.gdb.tad.model.TadModel$3.execute(TadModel.java:256)
com.nxp.freertos.gdb.tad.model.TadModel$4.run(TadModel.java:356)
11:15:16.712 ERROR: [TadFactoryData] Could not load data for “Task List” view! For more information check TAD log
11:15:16.713 INFO: [Benchmark] Loading data for “Task List” took 1117 ms.
11:15:18.903 INFO: [Benchmark] Loading data for “Heap Usage” has started.
11:15:19.838 INFO: [TaskFactory] FreeRTOS macro “configGENERATE_RUN_TIME_STATS” is disabled.
11:15:19.839 INFO: [FreeRTOS] FreeRTOS macro “configGENERATE_RUN_TIME_STATS” is disabled.
11:15:20.439 INFO: [TaskFactory] Stack grows DOWN
11:15:21.281 INFO: [HeapFactory] Application is using Heap type “4” (defined by configFRTOS_MEMORY_SCHEME in FreeRTOSConfig.h).
11:15:21.423 INFO: [Benchmark] Loading data for “Heap Usage” took 2520 ms.
11:15:22.433 INFO: [Benchmark] Loading data for “Queue List” has started.
11:15:22.434 INFO: [Benchmark] Loading data for “Queue List” took 1 ms.
11:15:23.635 INFO: [Benchmark] Loading data for “Task List” has started.
11:15:43.379 INFO: [TadState] TAD state changed: READY -> DEBUG_RESUMED (RESUMED, USER_REQUEST)
11:15:47.195 INFO: [TadState] TAD state changed: DEBUG_RESUMED -> READY (SUSPENDED, SIGNAL)
11:15:47.196 INFO: [Benchmark] Loading data for “Task List” has started.
11:15:47.848 INFO: [FreeRTOS] FreeRTOS macro “configUSE_TRACE_FACILITY” is disabled.
11:15:48.349 EXCEPTION: [QueueFactory] ReadingException in class “com.nxp.freertos.gdb.tad.controller.queuelist.QueueFactory” at 187. line when calling method “readIntAtAddress(0x200002b8, QueueDefinition, xTasksWaitingToSend.uxNumberOfItems)”
com.nxp.freertos.gdb.tad.controller.TadFactory.readIntAtAddress(TadFactory.java:213)
com.nxp.freertos.gdb.tad.controller.queuelist.QueueFactory.getQueue(QueueFactory.java:187)
com.nxp.freertos.gdb.tad.controller.queuelist.QueueFactory.getData(QueueFactory.java:109)
com.nxp.freertos.gdb.tad.model.TadModel$3.execute(TadModel.java:237)
com.nxp.freertos.gdb.tad.model.TadModel$4.run(TadModel.java:356)
11:15:48.350 ERROR: [TadFactoryData] Could not load data for “Queue List” view! For more information check TAD log
11:15:49.968 EXCEPTION: [TaskFactory] ReadingException in class “com.nxp.freertos.gdb.tad.controller.tasklist.TaskFactory” at 109. line when calling method “getSize(pxReadyTasksLists)”
com.nxp.freertos.gdb.tad.controller.TadFactory.getSize(TadFactory.java:116)
com.nxp.freertos.gdb.tad.controller.tasklist.TaskFactory.getData(TaskFactory.java:109)
com.nxp.freertos.gdb.tad.model.TadModel$3.execute(TadModel.java:256)
com.nxp.freertos.gdb.tad.model.TadModel$4.run(TadModel.java:356)
11:15:49.968 ERROR: [TadFactoryData] Could not load data for “Task List” view! For more information check TAD log
11:15:49.969 INFO: [Benchmark] Loading data for “Task List” took 2774 ms.
11:16:32.140 INFO: [TadState] TAD state changed: READY -> DEBUG_RESUMED (RESUMED, USER_REQUEST)
11:16:36.211 INFO: [TadState] TAD state changed: DEBUG_RESUMED -> READY (SUSPENDED, SIGNAL)
11:16:36.212 INFO: [Benchmark] Loading data for “Task List” has started.
11:16:38.307 INFO: [Benchmark] Loading data for “Task List” took 2095 ms.
11:16:41.46 INFO: [TadState] TAD state changed: READY -> DEBUG_RESUMED (RESUMED, USER_REQUEST)
11:16:46.260 INFO: [TadState] TAD state changed: DEBUG_RESUMED -> READY (SUSPENDED, SIGNAL)
11:16:46.262 INFO: [Benchmark] Loading data for “Task List” has started.
11:16:46.917 EXCEPTION: [QueueFactory] ReadingException in class “com.nxp.freertos.gdb.tad.controller.queuelist.QueueFactory” at 199. line when calling method “readIntAtAddress(0x200002b8, QueueDefinition, xTasksWaitingToReceive.uxNumberOfItems)”
com.nxp.freertos.gdb.tad.controller.TadFactory.readIntAtAddress(TadFactory.java:213)
com.nxp.freertos.gdb.tad.controller.queuelist.QueueFactory.getQueue(QueueFactory.java:199)
com.nxp.freertos.gdb.tad.controller.queuelist.QueueFactory.getData(QueueFactory.java:109)
com.nxp.freertos.gdb.tad.model.TadModel$3.execute(TadModel.java:237)
com.nxp.freertos.gdb.tad.model.TadModel$4.run(TadModel.java:356)
11:16:46.917 ERROR: [TadFactoryData] Could not load data for “Queue List” view! For more information check TAD log
11:16:47.419 EXCEPTION: [TaskFactory] ReadingException in class “com.nxp.freertos.gdb.tad.controller.tasklist.TaskFactory” at 109. line when calling method “getSize(pxReadyTasksLists)”
com.nxp.freertos.gdb.tad.controller.TadFactory.getSize(TadFactory.java:116)
com.nxp.freertos.gdb.tad.controller.tasklist.TaskFactory.getData(TaskFactory.java:109)
com.nxp.freertos.gdb.tad.model.TadModel$3.execute(TadModel.java:256)
com.nxp.freertos.gdb.tad.model.TadModel$4.run(TadModel.java:356)
11:16:47.421 ERROR: [TadFactoryData] Could not load data for “Task List” view! For more information check TAD log
11:16:47.422 INFO: [Benchmark] Loading data for “Task List” took 1161 ms.
11:17:00.448 INFO: [TadModel] DSF session ID 2 has ended.
(but I’m sure turn on the configGENERATE_RUN_TIME_STATS and configUSE_TRACE_FACILITY in my “FreeRTOSConfig.h”)
I have serch this tool with google and bing, seems most link take me here 🙂
Sorry for the inconvenience, but can you help me ?
why this error message and how can I see runtime with this tool~~
semihosting too slow 🙂
LikeLike
Hi Erich,
this is a version delete log message…. [cry]
I have done this (use STM32 TIM5 with 10x of the freqency of freertos tick freq), and I can print the runtime state use uxTaskGetSystemState with semihosting~
and I have trun on configUSE_TRACE_FACILITY and config_GENERATE_RUNTIME_STATS.
There is another problem of this tool:
sometimes I pause the application, Task LIst Tab show this message
I have to change to Heap Usage Tab and change back.
Queue List have same problem
LOG:
(but I’m sure turn on the configGENERATE_RUN_TIME_STATS and configUSE_TRACE_FACILITY in my “FreeRTOSConfig.h”)
I have serch this tool with google and bing, seems most link take me here 🙂
Sorry for the inconvenience, but can you help me ?
why this error message and how can I see runtime with this tool~~
semihosting too slow 🙂
LikeLike
Hi Aaron,
I cleaned up the number of comments, sorry about this, but sometimes WordPress is picky about preventing spam (usually a good thing).
As for diagnostics: inside your workspace folder there is a debug log folder named FreeRTOS_TAD_logs which has log text files. It seems you already have found them.
What I see is
“com.nxp.freertos.gdb.tad.controller.tasklist.TaskFactory” at 109. line when calling method “getSize(pxReadyTasksLists)”
com.nxp.freertos.gdb.tad.controller.TadFactory.getSize(TadFactory.java:116)
11:15:04.647 ERROR: [TadFactoryData] Could not load data for “Queue List” view! For more information check TAD log
11:15:05.149 EXCEPTION: [TaskFactory] ReadingException in class
so somehow it is not able to get the needed data. Is the TAD log showing anything useful?
What version of RTOS are you using? I’m using V9.0.0.
And there seems to be a known issue on Linux at least (see https://community.nxp.com/message/809333). Maybe you could post your problem in that community forum too as the engineers at NXP are in the loop there.
Erich
LikeLike
Thank you Erich
LikeLike
Hi dear Erich
By having this great plugin do we still need tracealyzer? Does tracealyzer give us any more useful data?
I’m using this plugin in truestudio, which is an eclipse based IDE for STM32. Does it have any impact on data it shows me? Can I trust it? You know it is basically developed for NXP microcontrollers, not ST.
PS: Thanks for your great blog. My life is divided into “before” and “after” times of knowing your blog. 🙂 You are a great teacher.
LikeLike
These plugins give you only a ‘stop-mode’ view, means when the target is halted. I still need Tracealyzer as it records more and it it shows me how things go over time.
The Plugin is for FreeRTOS in general, and as long as your FreeRTOS is up-to-date and includes the settings as in https://mcuoneclipse.com/2017/03/18/better-freertos-debugging-in-eclipse/, you should be fine.
PS: Thanks 🙂
LikeLike
Hi Erich,
Do you know if there is a way to specify the GDB server to use? I want to try this on a different part and the vendor’s debugger does expose a gdb server. I hope that if I could configure the remote host and GDB server port the plugin would query for the symbols and display correctly.
Do you think that could work?
Thanks!
LikeLike
see https://mcuoneclipse.com/2013/07/22/diy-free-toolchain-for-kinetis-part-3-debugger-gdb-server-with-pe-and-segger/
LikeLike