
NXP FTF Tech Forum in Austin has been a blast! I’m running another FreeRTOS hands-on session (FTF-DES-N2048) this afternoon which yet again is fully booked. But we will squeeze in as many as possible from the waiting list.
One very exciting thing we are going to use is FreeRTOS thread awareness in Eclipse/Kinetis Design Studio: to see and debug the FreeRTOS threads in Eclipse using the Segger GDB and it will show the list of threads in the Debug view:
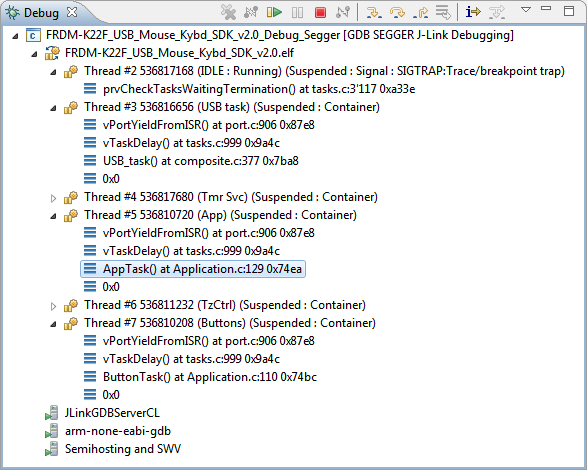
FreeRTOS Thread Awareness with Segger GDB
Segger provided me a patch (thanks!) of their GDB server implementation right for NXP FTF. So why is this so important? Because this gives me direct debug access to the running FreeRTOS tasks:

With and Without Trhead Awareness
When I select a task it switches the context: shows the source, registers, variables and so on for that task:
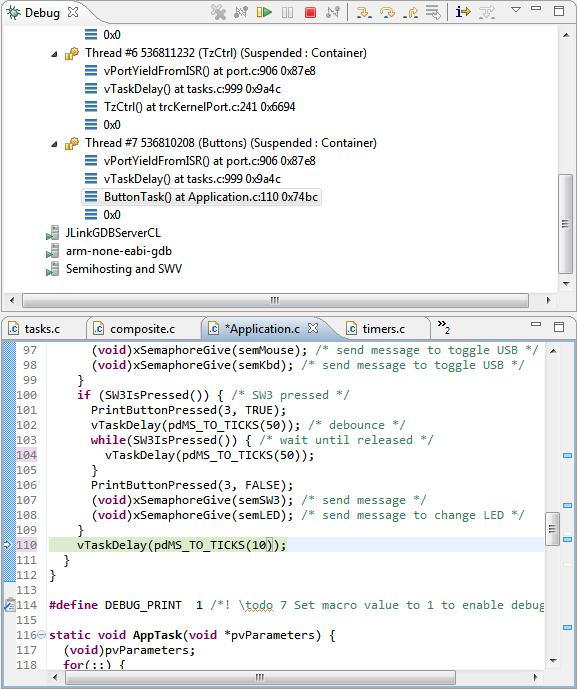
Task Context
I expect this will come out with one of the upcoming Segger J-Link software releases. I’m using the NXP Kinetis Design Studio for the above, but this should work for any Eclipse using the GDB server from Segger. NXP Kinetis Design Studio included the Segger GDB Server, and if you do an update with the Segger J-Link software, it can update the Segger files inside the IDEs which are detected. So this could be rolled out with one of the next Segger J-Link software updates.
Happy Threading 🙂
Links
- Segger GDB: Segger J-Link GDB Server
- Similar thing with OpenOCD: FreeRTOS Thread debugging with OpenOCD
- NXP Kinetis Design Studio: http://www.nxp.com/kds

Hi Erich,
I’m very happy to hear that!!
Thanks for the info :))
LikeLike
> One very exiting thing …
One very exciting thing …
😉
LikeLike
oh gee, I guess I need more sleep ;-). Thanks for the catching that one, fixed now
Erich
LikeLike
is there a ETA for this new gdb server ?
LikeLike
Hi Peter,
if not already done, register for beta updates here: https://www.segger.com/jlink-software-beta-version.html
Erich
LikeLike
Hi Peter,
Segger has released a beta of it in V5.41e on https://www.segger.com/jlink-software-beta-version.html:
– GDBServer: Implemented support for thread debugging with RTOS by using a plug-in
LikeLiked by 1 person
great! but the needed rtosplugin.so/dll is not yet provided 😦
LikeLike
yes, I have found this out too. I have been told that it should come out later today as a plugin download from segger.com
LikeLike
Hi,
Segger released beta V5.42h which includes plugins for both embOS and FreeRTOS.
I tried using the FreeRTOS plugin but i’m getting the following error from GDBServer: ‘ERROR: Don’t have the number of threads in FreeRTOS.’
Does anyone know how to solve this?
LikeLike
My bad, it’s beta V5.41h
LikeLike
Hi mave,
I don’t see any FreeRTOS plugins in V5.41h and and I don’t see any reference about FreeRTOS in the release notes?
Why do you think it is included?
Erich
LikeLike
Hi Erich,
The plugins are located in the folder ‘GDBServer’.
Add ‘-rtos GDBServer\RTOSPlugin_FreeRTOS’ to the command line to use the FreeRTOS plugin.
mave
LikeLiked by 1 person
Ah, I see it now. I’ll have a look.
LikeLike
Hi mave,
I quickly tried the plugin with my FreeRTOS project on a FRDM-K64F (ARM Cortex-M4F), and it works. At least I don’t see that error message. There is only one thing that for one thread it does not show properly the call stack (which I’m going to report to Segger). But otherwise it seems to work fine. I’m writing up a short article on how to setup things too, so thanks for your pointers and tips!
Erich
LikeLike
Hi Erich,
Good to know it is working for you. I’m looking forward to the article. You’re welcome 🙂
Maybe it has something to do with the FreeRTOS version? I’m still at version 8.1.0 but i want to upgrade to 9.0.0 in the near future. What version did you use for testing?
mave
LikeLike
Hi mave,
I’m using v9.0.0 (https://mcuoneclipse.com/2016/05/29/freertos-v9-0-0-with-static-memory-allocation/).
Erich
LikeLike
Hi Erich,
I upgraded FreeRTOS to version 9 but i’m still having the same problem.. There is probably something wrong in my environment but i have to figure out what exactly.
BTW my target is an LPC1768 and i’m using the LPCXpresso IDE.
mave
LikeLike
I received a reply (very fast!) from Segger. My problem was caused by compiler optimizations (I used -O3) and vPortEnableVFP() was optimized away. Can you check in the Segger GDB log that you each symbol is defined and does not have an address of zero?
Received symbol: pxCurrentTCB (20003A7C)
Received symbol: pxReadyTasksLists (20003A80)
Received symbol: xDelayedTaskList1 (20003AF8)
Received symbol: xDelayedTaskList2 (20003B0C)
Received symbol: pxDelayedTaskList (20003B20)
Received symbol: pxOverflowDelayedTaskList (20003B24)
Received symbol: xPendingReadyList (20003B28)
Received symbol: xTasksWaitingTermination (00000000)
Received symbol: xSuspendedTaskList (20003B3C)
Received symbol: uxCurrentNumberOfTasks (20003B50)
Received symbol: uxTopUsedPriority (2000002C)
Received symbol: vPortEnableVFP (0000FE24)
LikeLike
I tried different optimization levels but none of them seems to fix my problem. I also checked the GDB log and there is no mention of any of those symbols, not even that they are not found. I assume they should be in the log where ‘ERROR: Don’t have the number of threads in FreeRTOS.’ is now.
Strange, because all of those symbols are in the binary and i can see them in the expressions view of eclipse while debugging so for some reason the plugin is not getting the symbols.
This is part of the GDB log:
8<—–
Starting target CPU…
…Breakpoint reached @ address 0x0002ADD0
ERROR: Don't have the number of threads in FreeRTOS.
Reading all registers
Removing breakpoint @ address 0x0002ADD0, Size = 2
Read 4 bytes @ address 0x0002ADD0 (Data = 0xB08FB5F0)
Reading 64 bytes @ address 0x10007F80
8<—–
LikeLike
Hi mave,
you need to check the Segger GDB log. This is where I have these lines from.
Erich
LikeLike
Hi Erich,
I know. That is where the lines i posted are coming from. I don’t see the ‘Received symbol:’ messages anywhere, only that error message 😦
I’m quite getting out of ideas. Why does it work for others but not for me..
Here are some more lines from the log:
SEGGER J-Link GDB Server V5.41h (beta) LogFile
…
Loading RTOS plugin: GDBServer\RTOSPlugin_FreeRTOS…
RTOS plugin (v1.0) loaded successfully
…
RTOS plugin initialized successfully
…
ERROR: Don’t have the number of threads in FreeRTOS
…
mave
LikeLike
Hi mave,
I have contacted Segger. I suspect that in your FreeRTOS some symbols are not found.
Below is my log, in case this helps.
SEGGER J-Link GDB Server V5.41h (beta) Command Line Version
JLinkARM.dll V5.41h (DLL compiled Jun 10 2016 17:44:13)
—–GDB Server start settings—–
GDBInit file: none
GDB Server Listening port: 2331
SWO raw output listening port: 2332
Terminal I/O port: 2333
Accept remote connection: localhost only
Generate logfile: off
Verify download: on
Init regs on start: on
Silent mode: off
Single run mode: on
Target connection timeout: 0 ms
——J-Link related settings——
J-Link Host interface: USB
J-Link script: none
J-Link settings file: none
——Target related settings——
Target device: MK64FN1M0xxx12
Target interface: SWD
Target interface speed: 1400kHz
Target endian: little
Loading RTOS plugin: GDBServer/RTOSPlugin_FreeRTOS…
Connecting to J-Link…
RTOS plugin (v1.0) loaded successfully
J-Link is connected.
Firmware: J-Link OpenSDA 2 compiled Apr 24 2014 14:44:11
Hardware: V1.00
S/N: 621000000
Checking target voltage…
Target voltage: 3.30 V
Listening on TCP/IP port 2331
Connecting to target…Connected to target
Waiting for GDB connection…Connected to 127.0.0.1
RTOS plugin initialized successfully
Reading all registers
Read 4 bytes @ address 0x00000000 (Data = 0x20030000)
Target interface speed set to 30 kHz
Resetting target
Halting target CPU…
…Target halted (PC = 0x000041A8)
R0 = 00000000, R1 = 00000000, R2 = 00000000, R3 = 00000000
R4 = 00000000, R5 = 00000000, R6 = 00000000, R7 = 00000000
R8 = 00000000, R9 = 00000000, R10= 00000000, R11= 00000000
R12= 00000000, R13= 20030000, MSP= 20030000, PSP= 00000000
R14(LR) = FFFFFFFF, R15(PC) = 000041A8
XPSR 01000000, APSR 00000000, EPSR 01000000, IPSR 00000000
CFBP 00000000, CONTROL 00, FAULTMASK 00, BASEPRI 00, PRIMASK 00
Reading all registers
Select auto target interface speed (1429 kHz)
Flash breakpoints enabled
Received symbol: pxCurrentTCB (200061A8)
Received symbol: pxReadyTasksLists (200061AC)
Received symbol: xDelayedTaskList1 (20006224)
Received symbol: xDelayedTaskList2 (20006238)
Received symbol: pxDelayedTaskList (2000624C)
Received symbol: pxOverflowDelayedTaskList (20006250)
Received symbol: xPendingReadyList (20006254)
Received symbol: xTasksWaitingTermination (00000000)
Received symbol: xSuspendedTaskList (20006268)
Received symbol: uxCurrentNumberOfTasks (2000627C)
Received symbol: uxTopUsedPriority (20000038)
Received symbol: vPortEnableVFP (0001589C)
All mandatory symbols successfully loaded.
All mandatory symbols successfully loaded.
LikeLike
Hi Erich,
Thank you for your help.
In the mean time, i installed the segger jlink plugin from gnuarmeclipse and now it finally works!
mave
LikeLiked by 1 person
Pingback: FreeRTOS Kernel Awareness with Ozone | MCU on Eclipse
Pingback: P&E ARM Cortex-M Debugging with FreeRTOS Thread Awareness and Real Time Expressions for GDB and Eclipse | MCU on Eclipse
Pingback: Better FreeRTOS Debugging in Eclipse | MCU on Eclipse
Pingback: Troubleshooting Tips for FreeRTOS Thread Aware Debugging in Eclipse | MCU on Eclipse
Pingback: Show FreeRTOS Threads in Eclipse Debug View with SEGGER J-Link and NXP S32 Design Studio | MCU on Eclipse