
I’m exploring the Kinetis SDK v2.0 (see “First NXP Kinetis SDK Release: SDK V2.0 with Online On-Demand Package Builder“). For this, I’m using the ‘standard’ way: blinking the LED on the board 🙂

Blinky on FRDM-K64F Board
Blinky Project
First I checked out the ‘Blinky LED’ example in the Kinetis SDK v2.0 for the FRDM-K64F board: The example is located in
<SDK Installation Path>\SDK_2.0_FRDM-K64F\boards\frdmk64f\driver_examples\gpio\led_output
That project indeed does what I want: it blinks the red RGB LED on the board. But to my surprise, looking at the code size I see that it takes this amount of RAM and FLASH (see “text, data and bss: Code and Data Size Explained“):
   text       data        bss        dec        hex    filename
  19840        128       4488      24456       5f88    gpio_led_output_frdmk64f.elf
20 KByte of code for only blinking a LED? Ok, that was for the ‘Debug’ project, so I tried the ‘Release’ build instead. Better, but not even close to what I would expect:
   text       data        bss        dec        hex    filename
  15184        128       4488      19800       4d58    gpio_led_output_frdmk64f.elf
main()
Looking at the main() of that demo shows
int main(void)
{
    /* Define the init structure for the output LED pin*/
    gpio_pin_config_t led_config = {
        kGPIO_DigitalOutput, 0,
    };

    /* Board pin, clock, debug console init */
    BOARD_InitPins();
    BOARD_BootClockRUN();
    BOARD_InitDebugConsole();

    /* Print a note to terminal. */
    PRINTF("\r\n GPIO Driver example\r\n");
    PRINTF("\r\n The LED is taking turns to shine.\r\n");

    /* Init output LED GPIO. */
    GPIO_PinInit(BOARD_LED_GPIO, BOARD_LED_GPIO_PIN, &led_config);

    while (1)
    {
        delay();
        GPIO_TogglePinsOutput(BOARD_LED_GPIO, 1u << BOARD_LED_GPIO_PIN);
    }
}
Ah! That PRINTF thing probably the bad thing (see “Why I don’t like printf()“). And indeed, after removing the two calls to PRINTF() things are looking better for the release build:
   text       data        bss        dec        hex    filename
   3888        120       4496       8504       2138    gpio_led_output_frdmk64f.elf
Still, the Debug build really looks to huge even with the PRINTF removed from main():
   text       data        bss        dec        hex    filename
  19752        128       4488      24368       5f30    gpio_led_output_frdmk64f.elf
assert()
Looking at the linker file it was clear that still the huge overhead from printf() was used. Why? The cause is by usage of ‘assert’ in the Kinetis SDK driver code, e.g. here:
void GPIO_PinInit(GPIO_Type *base, uint32_t pin, const gpio_pin_config_t *config)
{
    assert(config);

    if (config->pinDirection == kGPIO_DigitalInput)
    {
        base->PDDR &= ~(1U << pin);     }     else     {         GPIO_WritePinOutput(base, pin, config->outputLogic);
        base->PDDR |= (1U << pin);
    }
}
Using asserts is a good thing: it makes sure that a condition is checked and verified early. However, there is a cost behind it. The assert macro is defined in assert.h:
#ifdef NDEBUG           /* required by ANSI standard */
# define assert(__e) ((void)0)
#else
# define assert(__e) ((__e) ? (void)0 : __assert_func (__FILE__, __LINE__, \
                               __ASSERT_FUNC, #__e))
...
#endif
The __assert_func is defined in fsl_common.c as
void __assert_func(const char *file, int line, const char *func, const char *failedExpr)
{
    PRINTF("ASSERT ERROR \" %s \": file \"%s\" Line \"%d\" function name \"%s\" \n", failedExpr, file, line, func);
    for (;;)
    {
        __asm("bkpt #0");
    }
}
Found it! So that’s why it is still referring to PRINTF!
In assert.h the macro is defined to ‘nothing’ if NDEBUG is defined:
#ifdef NDEBUG           /* required by ANSI standard */
# define assert(__e) ((void)0)
#else
...
#endif
So the solution to get rid of all the assert() code is to define NDEBUG in the project settings like it is done in the Release configuration:
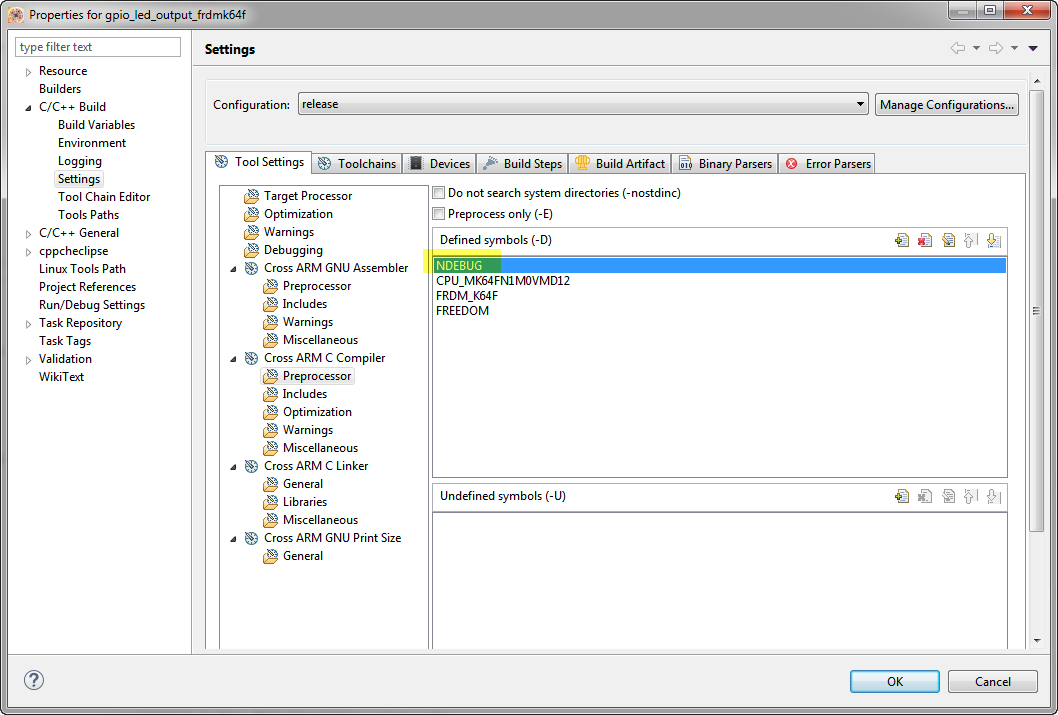
NDEBUG Setting
Having this define (instead of DEBUG) present in the debug configuration does the trick:
   text       data        bss        dec        hex    filename
   6004        120       4496      10620       297c    gpio_led_output_frdmk64f.elf
Still a lot of code for a Blinky application, but much better. Another solution would be to remove the PRINTF() call in __assert_func(), but I did not want to change the SDK code at least at this stage. So adding the NDEBUG did what I needed.
💡 The Kinetis Desig Studio projects with the Kinetis SDK v2.x project wizard do not have the NDEBUG define set.
Debug or Release?
Next consideration is: why using such a Debug and Release configuration at all? Actually for embedded the terms ‘Release’ and ‘Debug’ actually do not have much meaning (see “Debug vs. Release?“). But when I tried to debug the Release build, the debugger did not show any source information 😦

No Source Available
The problem is that the project setting has ‘none’ for the debug information. So the solution is to change that e.g.

Debug Settings
Note that adding debug information does increase the .elf file size on the *host*, but does *not* change the code size on the embedded target. So in my view there is really no reason to turn debug information off in the project settings.
Debug Settings
With this, I can now debug my ‘optimized’ application:

Debugging Release Build
Summary
Using standard printf() usually is a very bad, bad thing for embedded projects which care about performance and code size. So the first step to shrink code size is to get rid of it. The Kinetis SDK drivers are using assert() macros which is a good thing, but they use printf() as well.
Happy Reducing 🙂

I agree with your view on *printf() (avoid it possible in embedded) but if you do have to use it then, where available, newlib-nano and newlib’s integer only (iprintf() etc.) version may help minimise overhead?
LikeLike
Agreed, newlib is better, and my example in this post is using newlib. It would be much worse with newlib only
LikeLiked by 1 person
I tried newlib-nano in my project, by that binary size was getting reduced by approx 10k, but heard from others that nano has not stabilized yet and have lots of bug, as I am not expert, So not migrated to newlib-nano.
Cortex-M4F , arm gcc V4.7 2014q2 (launchpad)
What you say about newlib-nano with Cortex-M4F
LikeLike
The size reduction it all depends on what you are using as standard functions calls (printf(), malloc(), etc). I’m not using newlib in any of my projects, I’m always using newlib-nano and I have not faced any issues. But I have to say that usually I try to avoid the standard functions as much as possible too (especially I avoid printf(), scanf(), and the like). It is true that if you use the more complex printf() functions, that these might not be well supported in the newlib-nano. But again: you should not use them anyway 🙂
LikeLiked by 1 person
Thanks alot, we were struggling as our debug binary was not fitting into flash, So meanwhile developer can debug release build 🙂
I checked by compiling release build with -g flag and able to debug 🙂
LikeLike
Hi.
NDEBUG settings do not appear:
file:///home/juan/Pictures/Screenshot%20from%202016-03-15%2011:45:50.png
LikeLike
Juan,
That screenshot is empty for me?
Erich
LikeLike
Its difficult to image developing and testing without printf. I agree it does take a lot of code space and clock cycles. Its often the case that a program behaves differently when you include significant printf debug calls during testing and you could say that invalidates test results for real time system.
Perhaps the answer is to improve debugging techniques so that printf does not need to be used , sure the watch window can display values fine, but a human readable transcript or log is much more useful for diagnosis.
If the value to string formatting could be handled by the debug server and IDE that would help to free up MCU clock cycles. I have not fully examined its capabilities, but NXP FreeMaster springs to mind here http://www.nxp.com/products/power-management/wireless-charging-ics/freemaster-run-time-debugging-tool:FREEMASTER
LikeLike
Hi Chad,
the dangerous part with printf() is that it can affect system timing to an extend that it affects the testing results. There are plenty of ways to avoid the overhead of printf(), for example to use puts() instead. You might have a look at Segger RTT (see https://mcuoneclipse.com/2015/07/07/using-segger-real-time-terminal-rtt-with-eclipse/): this is a lightweight and fast way to communicate through the debugger interface.
LikeLiked by 1 person
I like the concept of Segger RTT and the fact all J-Links support it. I notice they have a printf function which is ok.
If KSDK 2.x+ included the means to override PRINTF to use SEGGER_RTT_printf that would provide part of the solution. I suppose the RTT terminal and library could be modified to dump values in an even more efficient manner than using SEGGER_RTT_printf, but I suppose I should use it first 🙂
LikeLike
I never use things like printf in debugging as that mechanism isn’t viable in a field deployed system. Instead I keep “logs” of what’s going on in binary formats (dense and fast) in things like E2 that I can grab later and then analyze with some custom software that runs on a host system (e.g. windows). There are instructions to product support people of how to grab these logs off products and get them to me.
Debugging is largely done through I/O ports with logic analyzers because (as Erich notes) running things like printf causes timings to change which is often a bad thing in embedded systems.
so, yes, you need to change the way you’re doing debug for two basic reasons:
1) timing integrity and
2) field diagnosis (you will be putting this in the field, yes?)
LikeLiked by 1 person
You mentioned that
“Actually for embedded the terms ‘Release’ and ‘Debug’ actually do not have much meaning (see “Debug vs. Release?“)”
Does that mean that controller doesn’t know that its being debugged, and its not going to affect performance (execution time) if we are not putting any breakpoint? Is it debug hw module(coresight for cortex-m) which gets started and will be managing breakpoint etc without stealing any cycle from core?
In terms of power consumption , if we compiled with -g option and we haven’t connected debugger then it that case it will consume same power as compiled without -g option.
I am using cortex-m4 , gnu arm gcc(launchpad)
Can you please refer to some documents where i can get these things?
Thanks in advance
LikeLike
Hi Horaira,
the controller in general is not affected if you are debugging it. Of course if you are setting a breakpoint while the target is running it will stop the target briefly, set the breakpoint and then it starts running again. There is a difference if you have a watchpoint (see ) set as this sniffs (by hardware) the addresses on the bus. But this does not really affect performance.
LikeLike
Thanks !!
LikeLike
Pingback: assert(), __FILE__, Path and other cool GNU gcc Tricks to be aware of | MCU on Eclipse