
I have published a Sneak Preview how GNU gprof profiling looks for an embedded target ARM Cortex-M in an earlier post:
This tutorial explains how to profile an embedded application (no RTOS needed) on ARM Cortex-M devices with GNU gprof. Additionally I explain the inner workings to generate the data necessary for gprof.
Outline
In my earlier posts (“Code Coverage with gcov, launchpad tools and Eclipse Kinetis Design Studio V3.0.0“) I showed how GNU tools can be used to create coverage information for a bare metal application. This post is about Application Profiling with gprof. As it is a longer article with many details, it took me a while to get it written down. But hopefully this post enables you to use the powerful GNU gprof profiling with embedded targets on ARM Cortex-M. I show how to use it in command line mode or using gprof in Eclipse (e.g. in Freescale Kinetis Design Studio, or any other Eclipse distribution with standard GNU tools for ARM Embedded).
What is profiling? It is about to know where the application spends most of its time so I can optimize it. In the GNU world, there is ‘gprof‘ used for that, and it is part of the standard GNU binaries. gprof it is commonly used e.g. for host or (Embedded) Linux applications. Profiling with gprof requires the sources compiled by gcc with a special option to instrument the code. The gprof tool is used then on the host to analyze and visualize the data. To my surprise I have not found instructions or steps how to use gprof for an embedded bare-metal target. This post tries to close that gap.
💡 Of course I can use any RTOS like FreeRTOS for this too. I’m using bare metal in this post to keep it very generic.
For this I’m using:
- Toolchain: I’m using GNU ARM Embedded (launchpad) 4.9q2-2015. But any other or earlier GNU toolchain for ARM could be used too.
- ARM Cortex-M: I’m using an ARM Cortex-M4F from Freescale (Kinetis K64F on a FRDM-K64F board). But any other ARM Cortex-M could be used instead.
- Run Control: You need a run control device capable to do full semihosting including file I/O. I’m using a Segger J-Link which is embedded on the FRDM-K64F board from Freescale. But any external Segger J-Link probe can be used too.
- SDK: I need to set up a timer (SysTick) for the statistical PC sampling (histogram). Every silicon vendor provides their own libraries, I’m using the Freescale Kinetis SDK in this article. But any other SDK or library will do it.
- IDE: I’m using the Eclipse based Freescale Kinetis Design Studio V3.0.0. But any other Eclipse IDE or IDE will do it. Or use vi, that will work too :-). Or use command line utilities (no IDE is required).
💡 The project used in this article is posted at the GitHub link at the end of this post. From the link you can download the sources and project files.
Profiling with GNU gprof
To use gprof, the sources need to be compiled with a special (-pg) compiler option. This directs the gcc compiler to add special calls to the generated code (more about this later). I can instrument all of my application code or only a part of it. Instrumenting only a part of it makes sense if I want to limit the overhead (FLASH, RAM) created in the instrumented (.elf) image (more about this later too). The instrumented image will collect the profiling information which then is written to the gmon.out file.
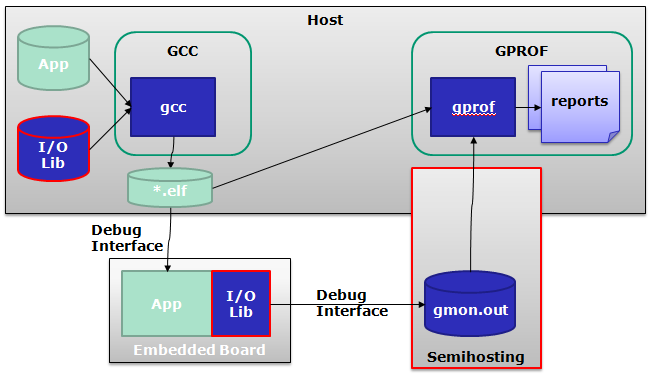
Typically, the generated .elf file gets downloaded to the embedded target/board e.g. using the debugger. At exit of the application, the profiling data gets written to the file gmon.out. Typically a bare embedded target does not have a file system. Therefore I need a way to transfer the data from the board to the host. One way to do is to use ‘semihosting’: With semihosting the application is using a special I/O Library.
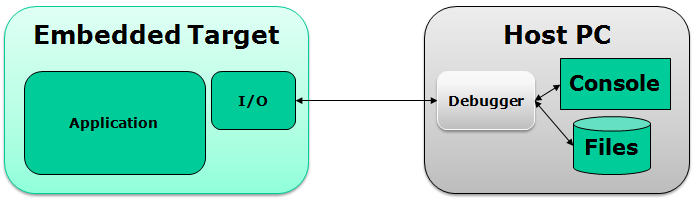
Semihosting means that the embedded application gets linked with a special version of the library which will trigger the debugger for any console or file I/O operation. The application can use things like f_open() to open and then read/write files on the host :-).
With semihosting the debugger will intercept the I/O operations: it will re-route the data to the host through the debug interface: the embedded application can read/write files which are actually on the host.
I’m using semihosting to get the gmon.out data file from the embedded board to the host PC. Once the file is on the host, it can be analyzed by the gprof program to generate reports. For this gprof is using the debug information in the .elf file to locate the functions and source files.
gprof: Call Counting and PC Sampling
This is how gprof works: it has two aspects:
- Function Call Counting: it counts for every instrumented function, how many times the function is called and from where. gcc inserts at the beginning of each instrumented function a call to a special library function to count the calls. This creates ‘Arcs’: information about who is calling what, how many times. Think about directed edges in a graph. Counting is done with _mcount() or in the case of GNU for ARM with __gnu_mcount_nc().
- Program Counter Sampling: at a period time, the current PC (Program Counter) gets sampled, creating a histogram of PC over addresses. This is typically done with a profile() function.
Function Call Counting is done with an insertion of a special call at the beginning of each instrumented function. The GNU ARM Embedded calls the function __gnu_mcount_nc():
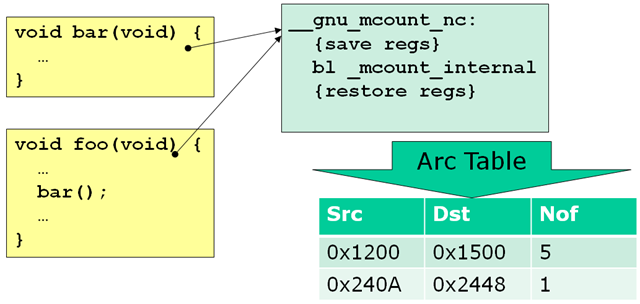
The _mcount_internal() function calculates the source and destination address of each call and stores it in a table. That table has a counter telling how many times a call from a source address has been performed. Such a table line entry is called an ‘arc’.
For the Function Call Counting, the compiler inserts a call to __gnu_mcount_nc at each instrumented function. Below is an example function to be instrumented:
static void CheckButton(void) {
 uint32_t val;

 val = GPIO_DRV_ReadPinInput(BUTTON_SW2);
 if (val==0) { /* SW2 pressed! */
...
After compiling it with the -pg option, the disassembly code shows the call to __gnu_mcount_nc() inserted:
 30:../Sources/Application.c **** static void CheckButton(void) {
 44 .loc 1 30 0
 45 .cfi_startproc
 46 @ args = 0, pretend = 0, frame = 8
 47 @ frame_needed = 1, uses_anonymous_args = 0
 48 0000 80B5 push {r7, lr}
 49 .cfi_def_cfa_offset 8
 50 .cfi_offset 7, -8
 51 .cfi_offset 14, -4
 52 0002 82B0 sub sp, sp, #8
 53 .cfi_def_cfa_offset 16
 54 0004 00AF add r7, sp, #0
 55 .cfi_def_cfa_register 7
 56 0006 00B5 push {lr}
 57 0008 FFF7FEFF bl __gnu_mcount_nc
 31:../Sources/Application.c **** uint32_t val;
 32:../Sources/Application.c ****
 33:../Sources/Application.c **** val = GPIO_DRV_ReadPinInput(BUTTON_SW2);
 58 .loc 1 33 0
 59 000c 40F20620 movw r0, #518
 60 0010 FFF7FEFF bl GPIO_DRV_ReadPinInput
 61 0014 7860 str r0, [r7, #4]
 34:../Sources/Application.c **** if (val==0) { /* SW2 pressed! */
 62 .loc 1 34 0
 63 0016 7B68 ldr r3, [r7, #4]
 64 0018 002B cmp r3, #0
 65 001a 19D1 bne .L2
...
The second thing is the Program Counter Sampling. gprof does *not* measure the time a function takes from the beginning to the end:
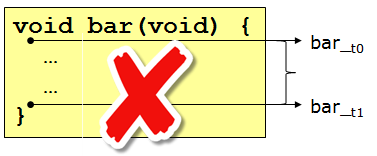
💡 such a measurement could be done with the ‘poor man’s profiling’ method.
Instead, it does a periodic sampling of the program counter (PC), say every 10 ms and counts the number of that PC in a histogram:
The histogram is a basically an array of code space addresses with a number how many times that PC has been sampled.
💡 Note that the sampling is only about program counter addresses. gprof later will use the debug information to match address ranges with functions.
Accuracy and Timing
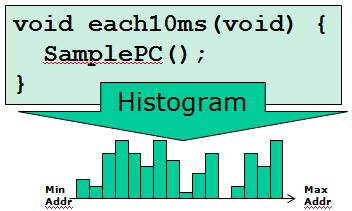
Based on the arcs and PC sampling information, gprof is able to estimate time spent in functions. Consider the following example where A() calls B() and C(), and D() calls C(). A() has been sampled 3 times ([3 s]) and D() has been sampled one time ([1 s]):
The numbers on the arrows indicate the number of calls performed: A() calls B() one time and three times C(). gprof will start bottom-up distributing run-time: B() has been sampled with one sample (e.g. one sample duration is 10 ms). C() has been sampled 10 times. As C() has been called in total 5 times, the sample time of 5 gets distributed to the callers of C() according to the call counts. So A() gets added ((10/5)*3 ==> 6) and D() gets added an additional of 4 samples ((10/5)*2).
💡
gprofassumes that the time spent inC()is regardless how it is called. Maybe A() is calling C() with parameters letting C() spend more CPU cycles.gprofdoes assume that calling a function() always takes the same effort. Which might not be always true.
That PC sampling is sometimes called ‘statistical sampling’ and is not error-free. The first error of PC sampling comes with the sampling frequency: Usually sampling is done at 10 ms or 1 ms rate. That means that short functions less than the sampling time will be rarely sampled or not at all. If a function has not been sampled multiple times, the timing for it will not be very accurate.
Mathematically, the expected error for the sampling is the square root of the number of samples taken. To illustrate this with examples:
- Sampling frequency is 100 Hz (Sampling period 10 ms). 10 samples will make a runtime if 1 second. The error is SQRT(100) which is 10, or 10*10ms = 100ms. So the ‘measured’ 1 second has an error of 100 ms (10%).
- Sampling frequency is again 100 Hz, and a function gets sampled 10000 times (runtime 100 seconds). The error is SQRT(10000) or 100 samples or 1 second. This means that the error for this function is 1%.
This means that only high sample numbers are accurate (several hundreds of samples). If the sample count for a function is small, this does not tell much. To get higher sample counts, you need to profile for an extended period or combine multiple profiling runs.
Memory Requirements for Arcs and Histogram
I have presented so far what information gprof collects:
- Arcs: which address (function) gets called from where (address) and how many times.
- Histogram: sampling of program counter on a periodic base, program counter frequency distribution over text/code range.
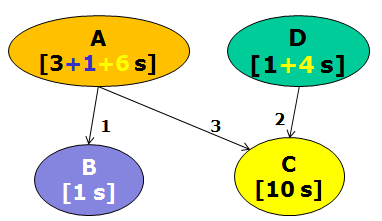
In the implementation I’m using, that information is collected and stored in a data structure as shown below:
- text is the memory range to be monitored. Typically this is the FLASH or code range of the application. Only one memory area is supported.
- The arrays froms[] and tos[] are building the Arcs. froms[] is an array mapping the text addresses from where function calls are performed.
- froms[] is an array of short (16bit) index values into the tos[] array. This means that there can be up to 65535 Arcs.
- To save memory for the froms[] array, the mapping is not a 1 to 1: instead a hashfraction is used to reduce the number of entries. This hashfraction is configurable, and can be 2 or higher for an thumb code on ARM because calls can be only done from even addresses.
- tos[] is an array of desination address with total 96 bits for each entry: a 32bit selfpc (destination address of call), a 32bit counter how many times that selfpc has been called, a 16bit link index into tos[] array. To align the array entries to 32bit addresses, there is a 16bit padding field which is not used for any data.
- To reduce the size of the tos[] array an ardensity can be specified. This value is a precentage, how many arcs are expected for an address range. Or in other words: the density of function calls for the code profiled. For example an arcdensity of 2% means that we can cover up to 2% of the text area using calls.
- kcount[] is the histogram of the sampled PCs: each counter is 16 bit wide. To reduce the amount of RAM needed, the available text/code area is divided by histfraction. For ARM Cortex-M with thumb mode, as every instruction at least 16bit long, a value of histfraction >= 2 can be used.
So the larger the text range to cover, the more RAM is needed. To give an example:
- text==8192 bytes
- hashfraction==2 (to cover every ‘from’ address
- arcenensity==2% (2% of the text are function calls)
- histfraction==2 (every address can be sampled)
This would result in a need for 10148 bytes of RAM:

Clearly, many targets will not have that much of RAM available. The strategy then is to use higher fraction values and/or lower arc density. Another approach is to selectively instrument only a portion of the source files/modules and place them into a text range using the linker file, as multiple gprof runs can be combined. But the amount of RAM needed to store the data is indeed a problem using gprof :-(.
Program Flow
After instrumentation, the program will run as usual, except that function calls get recorded in arcs and the PC gets sampled into a histogram. The data is written usually with calling _exit() at the end fo the program which then calls _mclean() which does the write of the file:
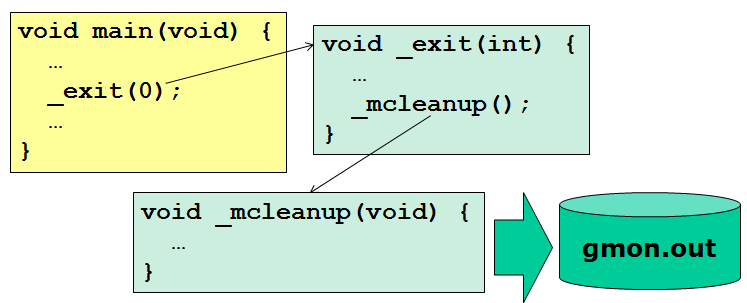
The application of course can directly call _mcleanup() which then will write the data with file I/O which gets transferred to the host with semihosting.
To enable semihosting (with the newlib-nano) I specify this option in the linker settings:
--specs=rdimon.specs
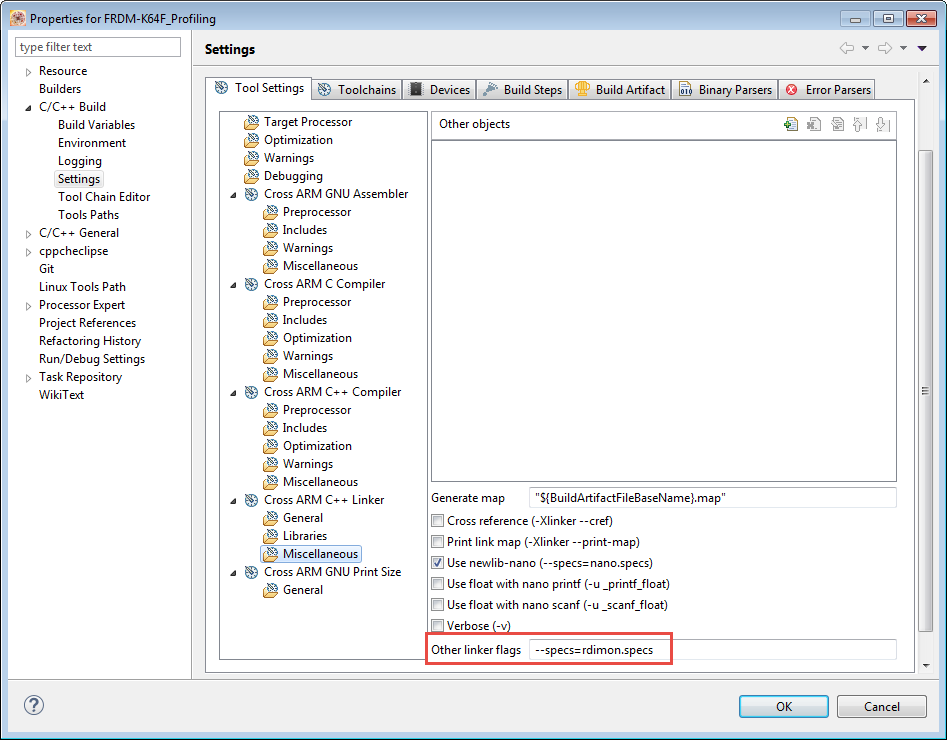
💡 Note that there are several different level of semihosting implemented. I’m using a Segger J-Link interface which has console AND file semihosting implemented.
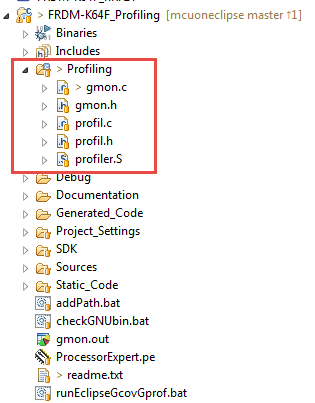
Profiler Library
As the gcc ARM Embedded (launchpad) tools do not come with the library having profiling support included, I have added ported the cygwin for i386 port to GNU ARM. The profiling port libraries are available in the project at the GitHub location at the end of this article.
💡 Make sure you use the latest files from GitHub. I’m posting here the current version for documentation purposes.
With the option -pg, the gcc compiler will add calls to __gnu_mound_nc() to count the functions and building the arcs. profiler.S implements that function:
/*
 * profiler.S
 * Implements the gprof profiler arc counting function.
 * Created on: 06.08.2015
 * Author: Erich Styger
 */

 .syntax unified
 .arch armv7-m

.globl __gnu_mcount_nc
.type __gnu_mcount_nc, %function

__gnu_mcount_nc:
#if 0 /* dummy version, doing nothing */
 mov ip, lr
 pop { lr }
 bx ip
#else
 push {r0, r1, r2, r3, lr} /* save registers */
 bic r1, lr, #1 /* R1 contains callee address, with thumb bit cleared */
 ldr r0, [sp, #20] /* R0 contains caller address */
 bic r0, r0, #1 /* clear thumb bit */
 bl _mcount_internal /* jump to internal _mcount() implementation */
 pop {r0, r1, r2, r3, ip, lr} /* restore saved registers */
 bx ip /* return to callee */
#endif
gmon.h implements the interface to gmon.c. It declares the data structures and contains the configuration parameters. Calling _mcleanup() will write the output file. _monInit() has to be called from the startup code in case the startup code is instrumented too.
/* $OpenBSD: gmon.h,v 1.3 1996/04/21 22:31:46 deraadt Exp $ */
/* $NetBSD: gmon.h,v 1.5 1996/04/09 20:55:30 cgd Exp $ */

/*-
 * Copyright (c) 1982, 1986, 1992, 1993
 * The Regents of the University of California. All rights reserved.
 *
 * Redistribution and use in source and binary forms, with or without
 * modification, are permitted provided that the following conditions
 * are met:
 * 1. Redistributions of source code must retain the above copyright
 * notice, this list of conditions and the following disclaimer.
 * 2. Redistributions in binary form must reproduce the above copyright
 * notice, this list of conditions and the following disclaimer in the
 * documentation and/or other materials provided with the distribution.
 * 4. Neither the name of the University nor the names of its contributors
 * may be used to endorse or promote products derived from this software
 * without specific prior written permission.
 *
 * THIS SOFTWARE IS PROVIDED BY THE REGENTS AND CONTRIBUTORS ``AS IS'' AND
 * ANY EXPRESS OR IMPLIED WARRANTIES, INCLUDING, BUT NOT LIMITED TO, THE
 * IMPLIED WARRANTIES OF MERCHANTABILITY AND FITNESS FOR A PARTICULAR PURPOSE
 * ARE DISCLAIMED. IN NO EVENT SHALL THE REGENTS OR CONTRIBUTORS BE LIABLE
 * FOR ANY DIRECT, INDIRECT, INCIDENTAL, SPECIAL, EXEMPLARY, OR CONSEQUENTIAL
 * DAMAGES (INCLUDING, BUT NOT LIMITED TO, PROCUREMENT OF SUBSTITUTE GOODS
 * OR SERVICES; LOSS OF USE, DATA, OR PROFITS; OR BUSINESS INTERRUPTION)
 * HOWEVER CAUSED AND ON ANY THEORY OF LIABILITY, WHETHER IN CONTRACT, STRICT
 * LIABILITY, OR TORT (INCLUDING NEGLIGENCE OR OTHERWISE) ARISING IN ANY WAY
 * OUT OF THE USE OF THIS SOFTWARE, EVEN IF ADVISED OF THE POSSIBILITY OF
 * SUCH DAMAGE.
 *
 * @(#)gmon.h 8.2 (Berkeley) 1/4/94
 */

/*
 * This file is taken from Cygwin distribution. Please keep it in sync.
 * The differences should be within __MINGW32__ guard.
 */

#ifndef _SYS_GMON_H_
#define _SYS_GMON_H_

#ifndef __P
#define __P(x) x
#endif

/* On POSIX systems, profile.h is a KRB5 header. To avoid collisions, just
 pull in profile.h's content here. The profile.h header won't be provided
 by Mingw-w64 anymore at one point. */
#if 0
#include <profile.h>
#else
#ifndef _WIN64
#define _MCOUNT_CALL __attribute__ ((regparm (2)))
extern void _mcount(void);
#else
#define _MCOUNT_CALL
extern void mcount(void);
#endif
#define _MCOUNT_DECL __attribute__((gnu_inline)) __inline__ \
 void _MCOUNT_CALL _mcount_private
#define MCOUNT
#endif

/*
 * Structure prepended to gmon.out profiling data file.
 */
struct gmonhdr {
 size_t lpc; /* base pc address of sample buffer */
 size_t hpc; /* max pc address of sampled buffer */
 int ncnt; /* size of sample buffer (plus this header) */
 int version; /* version number */
 int profrate; /* profiling clock rate */
 int spare[3]; /* reserved */
};
#define GMONVERSION 0x00051879

/*
 * histogram counters are unsigned shorts (according to the kernel).
 */
#define HISTCOUNTER unsigned short

/*
 * fraction of text space to allocate for histogram counters here, 1/2
 */
#define HISTFRACTION 2

/*
 * Fraction of text space to allocate for from hash buckets.
 * The value of HASHFRACTION is based on the minimum number of bytes
 * of separation between two subroutine call points in the object code.
 * Given MIN_SUBR_SEPARATION bytes of separation the value of
 * HASHFRACTION is calculated as:
 *
 * HASHFRACTION = MIN_SUBR_SEPARATION / (2 * sizeof(short) - 1);
 *
 * For example, on the VAX, the shortest two call sequence is:
 *
 * calls $0,(r0)
 * calls $0,(r0)
 *
 * which is separated by only three bytes, thus HASHFRACTION is
 * calculated as:
 *
 * HASHFRACTION = 3 / (2 * 2 - 1) = 1
 *
 * Note that the division above rounds down, thus if MIN_SUBR_FRACTION
 * is less than three, this algorithm will not work!
 *
 * In practice, however, call instructions are rarely at a minimal
 * distance. Hence, we will define HASHFRACTION to be 2 across all
 * architectures. This saves a reasonable amount of space for
 * profiling data structures without (in practice) sacrificing
 * any granularity.
 */
#define HASHFRACTION 2

/*
 * percent of text space to allocate for tostructs with a minimum.
 */
#define ARCDENSITY 2 /* this is in percentage, relative to text size! */
#define MINARCS 50
#define MAXARCS ((1 << (8 * sizeof(HISTCOUNTER))) - 2)

struct tostruct {
 size_t selfpc; /* callee address/program counter. The caller address is in froms[] array which points to tos[] array */
 long count; /* how many times it has been called */
 u_short link; /* link to next entry in hash table. For tos[0] this points to the last used entry */
 u_short pad; /* additional padding bytes, to have entries 4byte aligned */
};

/*
 * a raw arc, with pointers to the calling site and
 * the called site and a count.
 */
struct rawarc {
 size_t raw_frompc;
 size_t raw_selfpc;
 long raw_count;
};

/*
 * general rounding functions.
 */
#define ROUNDDOWN(x,y) (((x)/(y))*(y))
#define ROUNDUP(x,y) ((((x)+(y)-1)/(y))*(y))

/*
 * The profiling data structures are housed in this structure.
 */
struct gmonparam {
 int state;
 u_short *kcount; /* histogram PC sample array */
 size_t kcountsize; /* size of kcount[] array in bytes */
 u_short *froms; /* array of hashed 'from' addresses. The 16bit value is an index into the tos[] array */
 size_t fromssize; /* size of froms[] array in bytes */
 struct tostruct *tos; /* to struct, contains histogram counter */
 size_t tossize; /* size of tos[] array in bytes */
 long tolimit;
 size_t lowpc; /* low program counter of area */
 size_t highpc; /* high program counter */
 size_t textsize; /* code size */
};
extern struct gmonparam _gmonparam;

/*
 * Possible states of profiling.
 */
#define GMON_PROF_ON 0
#define GMON_PROF_BUSY 1
#define GMON_PROF_ERROR 2
#define GMON_PROF_OFF 3

void _mcleanup(void); /* routine to be called to write gmon.out file */
void _monInit(void); /* initialization routine */

#endif /* !_SYS_GMONH_ */
gmon.c implements the function counting with _mcount_internal() and the data writing with _mcleanup(). The implementation uses a global flag already_setup: the first time arcs get created, it will allocate memory using malloc().
/*-
 * Copyright (c) 1983, 1992, 1993
 *	The Regents of the University of California.  All rights reserved.
 *
 * Redistribution and use in source and binary forms, with or without
 * modification, are permitted provided that the following conditions
 * are met:
 * 1. Redistributions of source code must retain the above copyright
 *    notice, this list of conditions and the following disclaimer.
 * 2. Redistributions in binary form must reproduce the above copyright
 *    notice, this list of conditions and the following disclaimer in the
 *    documentation and/or other materials provided with the distribution.
 * 4. Neither the name of the University nor the names of its contributors
 *    may be used to endorse or promote products derived from this software
 *    without specific prior written permission.
 *
 * THIS SOFTWARE IS PROVIDED BY THE REGENTS AND CONTRIBUTORS ``AS IS'' AND
 * ANY EXPRESS OR IMPLIED WARRANTIES, INCLUDING, BUT NOT LIMITED TO, THE
 * IMPLIED WARRANTIES OF MERCHANTABILITY AND FITNESS FOR A PARTICULAR PURPOSE
 * ARE DISCLAIMED.  IN NO EVENT SHALL THE REGENTS OR CONTRIBUTORS BE LIABLE
 * FOR ANY DIRECT, INDIRECT, INCIDENTAL, SPECIAL, EXEMPLARY, OR CONSEQUENTIAL
 * DAMAGES (INCLUDING, BUT NOT LIMITED TO, PROCUREMENT OF SUBSTITUTE GOODS
 * OR SERVICES; LOSS OF USE, DATA, OR PROFITS; OR BUSINESS INTERRUPTION)
 * HOWEVER CAUSED AND ON ANY THEORY OF LIABILITY, WHETHER IN CONTRACT, STRICT
 * LIABILITY, OR TORT (INCLUDING NEGLIGENCE OR OTHERWISE) ARISING IN ANY WAY
 * OUT OF THE USE OF THIS SOFTWARE, EVEN IF ADVISED OF THE POSSIBILITY OF
 * SUCH DAMAGE.
 */

/*
 * This file is taken from Cygwin distribution. Please keep it in sync.
 * The differences should be within __MINGW32__ guard.
 */

#include <fcntl.h>
#include <stdlib.h>
#include <stdio.h>
#include <unistd.h>
#include "gmon.h"
#include "profil.h"
#include <stdint.h>
#include <string.h>

#define MINUS_ONE_P (-1)
#define bzero(ptr,size) memset (ptr, 0, size);
#define ERR(s) write(2, s, sizeof(s))

struct gmonparam _gmonparam = { GMON_PROF_OFF, NULL, 0, NULL, 0, NULL, 0, 0L, 0, 0, 0};
static char already_setup = 0; /* flag to indicate if we need to init */
static int	s_scale;
/* see profil(2) where this is described (incorrectly) */
#define		SCALE_1_TO_1	0x10000L

static void moncontrol(int mode);

/* required for gcc ARM Embedded 4.9-2015-q2 */
#if 0
void *_sbrk(int incr) {
  extern char __HeapLimit; /* Defined by the linker */
  static char *heap_end = 0;
  char *prev_heap_end;

  if (heap_end==0) {
    heap_end = &__HeapLimit;
  }
  prev_heap_end = heap_end;
  heap_end += incr;
  return (void *)prev_heap_end;
}
#endif

static void *fake_sbrk(int size) {
  void *rv = malloc(size);
  if (rv) {
    return rv;
  } else {
    return (void *) MINUS_ONE_P;
  }
}

void monstartup (size_t lowpc, size_t highpc) {
	register size_t o;
	char *cp;
	struct gmonparam *p = &_gmonparam;

	/*
	 * round lowpc and highpc to multiples of the density we're using
	 * so the rest of the scaling (here and in gprof) stays in ints.
	 */
	p->lowpc = ROUNDDOWN(lowpc, HISTFRACTION * sizeof(HISTCOUNTER));
	p->highpc = ROUNDUP(highpc, HISTFRACTION * sizeof(HISTCOUNTER));
	p->textsize = p->highpc - p->lowpc;
	p->kcountsize = p->textsize / HISTFRACTION;
	p->fromssize = p->textsize / HASHFRACTION;
	p->tolimit = p->textsize * ARCDENSITY / 100;
	if (p->tolimit < MINARCS) {
		p->tolimit = MINARCS;
	} else if (p->tolimit > MAXARCS) {
		p->tolimit = MAXARCS;
	}
	p->tossize = p->tolimit * sizeof(struct tostruct);

	cp = fake_sbrk(p->kcountsize + p->fromssize + p->tossize);
	if (cp == (char *)MINUS_ONE_P) {
		ERR("monstartup: out of memory\n");
		return;
	}

	/* zero out cp as value will be added there */
	bzero(cp, p->kcountsize + p->fromssize + p->tossize);

	p->tos = (struct tostruct *)cp;
	cp += p->tossize;
	p->kcount = (u_short *)cp;
	cp += p->kcountsize;
	p->froms = (u_short *)cp;

	p->tos[0].link = 0;

	o = p->highpc - p->lowpc;
	if (p->kcountsize < o) {
#ifndef notdef
		s_scale = ((float)p->kcountsize / o ) * SCALE_1_TO_1;
#else /* avoid floating point */
		int quot = o / p->kcountsize;

		if (quot >= 0x10000)
			s_scale = 1;
		else if (quot >= 0x100)
			s_scale = 0x10000 / quot;
		else if (o >= 0x800000)
			s_scale = 0x1000000 / (o / (p->kcountsize >> 8));
		else
			s_scale = 0x1000000 / ((o << 8) / p->kcountsize);
#endif
	} else {
		s_scale = SCALE_1_TO_1;
	}
	moncontrol(1); /* start */
}

void _mcleanup(void) {
	static const char gmon_out[] = "c:\\tmp\\" "gmon.out"; /* by default this is inside the <IDE>\ide folder */
	int fd;
	int hz;
	int fromindex;
	int endfrom;
	size_t frompc;
	int toindex;
	struct rawarc rawarc;
	struct gmonparam *p = &_gmonparam;
	struct gmonhdr gmonhdr, *hdr;
	const char *proffile;
#ifdef DEBUG
	int log, len;
	char dbuf[200];
#endif

	if (p->state == GMON_PROF_ERROR) {
		ERR("_mcleanup: tos overflow\n");
	}
	hz = PROF_HZ;
	moncontrol(0); /* stop */
	proffile = gmon_out;
	fd = open(proffile , O_CREAT|O_TRUNC|O_WRONLY|O_BINARY, 0666);
	if (fd < 0) {
		perror( proffile );
		return;
	}
#ifdef DEBUG
	log = open("c:\\tmp\\" "gmon.log", O_CREAT|O_TRUNC|O_WRONLY, 0664);
	if (log < 0) {
		perror("mcount: gmon.log");
		return;
	}
	len = sprintf(dbuf, "[mcleanup1] kcount 0x%x ssiz %d\n",
	    p->kcount, p->kcountsize);
	write(log, dbuf, len);
#endif
	hdr = (struct gmonhdr *)&gmonhdr;
	hdr->lpc = p->lowpc;
	hdr->hpc = p->highpc;
	hdr->ncnt = p->kcountsize + sizeof(gmonhdr);
	hdr->version = GMONVERSION;
	hdr->profrate = hz;
	write(fd, (char *)hdr, sizeof *hdr);
	write(fd, p->kcount, p->kcountsize);
	endfrom = p->fromssize / sizeof(*p->froms);
	for (fromindex = 0; fromindex < endfrom; fromindex++) {
		if (p->froms[fromindex] == 0) {
			continue;
		}
		frompc = p->lowpc;
		frompc += fromindex * HASHFRACTION * sizeof(*p->froms);
		for (toindex = p->froms[fromindex]; toindex != 0; toindex = p->tos[toindex].link) {
#ifdef DEBUG
			len = sprintf(dbuf,
			"[mcleanup2] frompc 0x%x selfpc 0x%x count %d\n" ,
				frompc, p->tos[toindex].selfpc,
				p->tos[toindex].count);
			write(log, dbuf, len);
#endif
			rawarc.raw_frompc = frompc;
			rawarc.raw_selfpc = p->tos[toindex].selfpc;
			rawarc.raw_count = p->tos[toindex].count;
			write(fd, &rawarc, sizeof rawarc);
		}
	}
	close(fd);
}

/*
 * Control profiling
 *	profiling is what mcount checks to see if
 *	all the data structures are ready.
 */
static void moncontrol(int mode) {
	struct gmonparam *p = &_gmonparam;

	if (mode) {
		/* start */
		profil((char *)p->kcount, p->kcountsize, p->lowpc, s_scale);
		p->state = GMON_PROF_ON;
	} else {
		/* stop */
		profil((char *)0, 0, 0, 0);
		p->state = GMON_PROF_OFF;
	}
}

void _mcount_internal(uint32_t *frompcindex, uint32_t *selfpc) {
  register struct tostruct	*top;
  register struct tostruct	*prevtop;
  register long			toindex;
  struct gmonparam *p = &_gmonparam;

  if (!already_setup) {
    extern char __etext; /* end of text/code symbol, defined by linker */
    already_setup = 1;
    monstartup(0x410, (uint32_t)&__etext);
  }
  /*
   *	check that we are profiling
   *	and that we aren't recursively invoked.
   */
  if (p->state!=GMON_PROF_ON) {
    goto out;
  }
  p->state++;
  /*
   *	check that frompcindex is a reasonable pc value.
   *	for example:	signal catchers get called from the stack,
   *			not from text space.  too bad.
   */
  frompcindex = (uint32_t*)((long)frompcindex - (long)p->lowpc);
  if ((unsigned long)frompcindex > p->textsize) {
      goto done;
  }
  frompcindex = (uint32_t*)&p->froms[((long)frompcindex) / (HASHFRACTION * sizeof(*p->froms))];
  toindex = *((u_short*)frompcindex); /* get froms[] value */
  if (toindex == 0) {
    /*
    *	first time traversing this arc
    */
    toindex = ++p->tos[0].link; /* the link of tos[0] points to the last used record in the array */
    if (toindex >= p->tolimit) { /* more tos[] entries than we can handle! */
	    goto overflow;
	  }
    *((u_short*)frompcindex) = (u_short)toindex; /* store new 'to' value into froms[] */
    top = &p->tos[toindex];
    top->selfpc = (size_t)selfpc;
    top->count = 1;
    top->link = 0;
    goto done;
  }
  top = &p->tos[toindex];
  if (top->selfpc == (size_t)selfpc) {
    /*
     *	arc at front of chain; usual case.
     */
    top->count++;
    goto done;
  }
  /*
   *	have to go looking down chain for it.
   *	top points to what we are looking at,
   *	prevtop points to previous top.
   *	we know it is not at the head of the chain.
   */
  for (; /* goto done */; ) {
    if (top->link == 0) {
      /*
       *	top is end of the chain and none of the chain
       *	had top->selfpc == selfpc.
       *	so we allocate a new tostruct
       *	and link it to the head of the chain.
       */
      toindex = ++p->tos[0].link;
      if (toindex >= p->tolimit) {
        goto overflow;
      }
      top = &p->tos[toindex];
      top->selfpc = (size_t)selfpc;
      top->count = 1;
      top->link = *((u_short*)frompcindex);
      *(u_short*)frompcindex = (u_short)toindex;
      goto done;
    }
    /*
     *	otherwise, check the next arc on the chain.
     */
    prevtop = top;
    top = &p->tos[top->link];
    if (top->selfpc == (size_t)selfpc) {
      /*
       *	there it is.
       *	increment its count
       *	move it to the head of the chain.
       */
      top->count++;
      toindex = prevtop->link;
      prevtop->link = top->link;
      top->link = *((u_short*)frompcindex);
      *((u_short*)frompcindex) = (u_short)toindex;
      goto done;
    }
  }
  done:
    p->state--;
    /* and fall through */
  out:
    return;		/* normal return restores saved registers */
  overflow:
    p->state++; /* halt further profiling */
    #define	TOLIMIT	"mcount: tos overflow\n"
    write (2, TOLIMIT, sizeof(TOLIMIT));
  goto out;
}

void _monInit(void) {
  _gmonparam.state = GMON_PROF_OFF;
  already_setup = 0;
}

void _exit(int status) {
  (void)status; /* not used */
  _mcleanup(); /* write gmon.out file */
  for(;;){
      __asm volatile("nop");
      __asm volatile("bkpt #0");
  } /* does not return */
}
In profile.h is the interface to the PC sampling histogram functionality:
/* profil.h: gprof profiling header file

   Copyright 1998, 1999, 2000, 2001, 2002 Red Hat, Inc.

This file is part of Cygwin.

This software is a copyrighted work licensed under the terms of the
Cygwin license.  Please consult the file "CYGWIN_LICENSE" for
details. */

/*
 * This file is taken from Cygwin distribution. Please keep it in sync.
 * The differences should be within __MINGW32__ guard.
 */

#ifndef __PROFIL_H__
#define __PROFIL_H__

/* profiling frequency.  (No larger than 1000) */
#define PROF_HZ			1000

/* convert an addr to an index */
#define PROFIDX(pc, base, scale)	\
  ({									\
    size_t i = (pc - base) / 2;				\
    if (sizeof (unsigned long long int) > sizeof (size_t))		\
      i = (unsigned long long int) i * scale / 65536;			\
    else								\
      i = i / 65536 * scale + i % 65536 * scale / 65536;		\
    i;									\
  })

/* convert an index into an address */
#define PROFADDR(idx, base, scale)		\
  ((base)					\
   + ((((unsigned long long)(idx) << 16)	\
       / (unsigned long long)(scale)) << 1))

/* convert a bin size into a scale */
#define PROFSCALE(range, bins)		(((bins) << 16) / ((range) >> 1))

typedef void *_WINHANDLE;

typedef enum {
  PROFILE_NOT_INIT = 0,
  PROFILE_ON,
  PROFILE_OFF
} PROFILE_State;

struct profinfo {
  PROFILE_State state; /* profiling state */
  u_short *counter;			/* profiling counters */
  size_t lowpc, highpc;		/* range to be profiled */
  u_int scale;			/* scale value of bins */
};

int profile_ctl(struct profinfo *, char *, size_t, size_t, u_int);
int profil(char *, size_t, size_t, u_int);
void gprof_init_timer(void);
int profile_file_write_check(void);

#endif /* __PROFIL_H__ */
The PC sampling is implemented in profile.c. I’m using the SysTick with the Kinetis SDK to generate a 1 kHz sampling interrupt:
/* profil.c -- win32 profil.c equivalent

   Copyright 1998, 1999, 2000, 2001, 2002 Red Hat, Inc.

   This file is part of Cygwin.

   This software is a copyrighted work licensed under the terms of the
   Cygwin license.  Please consult the file "CYGWIN_LICENSE" for
   details. */

/*
 * This file is taken from Cygwin distribution, adopted to be used for bare embeeded targets.
 */
#include <stdio.h>
#include <sys/types.h>
#include <errno.h>
#include <math.h>
#include "profil.h"
#include <string.h>
#include <stdint.h>
#include "fsl_pit.h"


/* global profinfo for profil() call */
static struct profinfo prof = {
  PROFILE_NOT_INIT, 0, 0, 0, 0
};

#define PIT_BASEADDR 		PIT
#define PIT_CHANNEL  		kPIT_Chnl_0
#define PIT_HANDLER   		PIT0_IRQHandler
#define PIT_IRQ_ID      	PIT0_IRQn
#define PIT_SOURCE_CLOCK 	CLOCK_GetFreq(kCLOCK_BusClk)

/* sample the current program counter */
void PIT0_IRQHandler(void) {
  static size_t pc, idx;

  PIT_ClearStatusFlags(PIT_BASEADDR, PIT_CHANNEL, kPIT_TimerFlag);
  if (prof.state==PROFILE_ON) {
    pc = ((uint32_t*)(__builtin_frame_address(0)))[14]; /* get SP and use it to get the return address from stack */
    if (pc >= prof.lowpc && pc < prof.highpc) {
      idx = PROFIDX (pc, prof.lowpc, prof.scale);
      prof.counter[idx]++;
    }
  }
  __DSB();
}

void gprof_init_timer(void) {
    pit_config_t pitConfig;
    /*
     * pitConfig.enableRunInDebug = false;
     */
    PIT_GetDefaultConfig(&pitConfig);

    /* Init pit module */
    PIT_Init(PIT_BASEADDR, &pitConfig);

    /* Set timer period for channel 0 */
    PIT_SetTimerPeriod(PIT_BASEADDR, PIT_CHANNEL, USEC_TO_COUNT(1000U, PIT_SOURCE_CLOCK)); /* must be PROF_HZ */

    /* Enable timer interrupts for channel 0 */
    PIT_EnableInterrupts(PIT_BASEADDR, PIT_CHANNEL, kPIT_TimerInterruptEnable);

    /* Enable at the NVIC */
    EnableIRQ(PIT_IRQ_ID);
    PIT_StartTimer(PIT_BASEADDR, PIT_CHANNEL);
}

/* Stop profiling to the profiling buffer pointed to by p. */
static int profile_off (struct profinfo *p) {
  p->state = PROFILE_OFF;
  return 0;
}

/* Create a timer thread and pass it a pointer P to the profiling buffer. */
static int profile_on (struct profinfo *p) {
  p->state = PROFILE_ON;
  return 0; /* ok */
}

/*
 * start or stop profiling
 *
 * profiling goes into the SAMPLES buffer of size SIZE (which is treated
 * as an array of u_shorts of size size/2)
 *
 * each bin represents a range of pc addresses from OFFSET.  The number
 * of pc addresses in a bin depends on SCALE.  (A scale of 65536 maps
 * each bin to two addresses, A scale of 32768 maps each bin to 4 addresses,
 * a scale of 1 maps each bin to 128k address).  Scale may be 1 - 65536,
 * or zero to turn off profiling
 */
int profile_ctl (struct profinfo *p, char *samples, size_t size, size_t offset, u_int scale) {
  size_t maxbin;

  if (scale > 65536) {
    errno = EINVAL;
    return -1;
  }
  profile_off(p);
  if (scale) {
    memset(samples, 0, size);
    memset(p, 0, sizeof *p);
    maxbin = size >> 1;
    prof.counter = (u_short*)samples;
    prof.lowpc = offset;
    prof.highpc = PROFADDR(maxbin, offset, scale);
    prof.scale = scale;
    return profile_on(p);
  }
  return 0;
}

/* Equivalent to unix profil()
   Every SLEEPTIME interval, the user's program counter (PC) is examined:
   offset is subtracted and the result is multiplied by scale.
   The word pointed to by this address is incremented. */
int profil (char *samples, size_t size, size_t offset, u_int scale) {
  return profile_ctl (&prof, samples, size, offset, scale);
}

int profile_file_write_check(void) {
  FILE *file = NULL;

  file = fopen ("c:\\tmp\\test.txt", "w");
  if (file!=NULL) {
    fputs("hello world with file I/O\r\n", file);
    (void)fwrite("hello\r\n", sizeof("hello\r\n")-1, 1, file);
    fclose(file);
    return 1; /* ok */
  }
  return 0; /* failed */
}
With this, the profiling library and support is complete.
💡 It is ok to profile the profiler library too, except do *not* profile gmon.c. I have not found a way to disable profiling for a single function.
Profiling and Calling _mcleanup()
With the library included in the application, I can run the application as usual. The profiling with arc counting and histogram generation might slow down the application maybe ~30%, depending on the number of function calls. The PC sampling (histogram) adds a constant load of about 5% or less, depending on the sampling frequency (is use typically a frequency of 1 kHz). With using an RTOS like FreeRTOS the PC sampling could be done from a task or better from the FreeRTOS tick hook.
At the end of the application (or when I’m done with profiling), I have to call _mcleanup() to write the profiling data. I most cases I’m using my own version of the _exit() function as below:
void _exit(int status) {
(void)status; /* not used */
_mcleanup(); /* write gmon.out file */
/* turn on all LED's ==&amp;amp;amp;gt; WHITE */
GPIO_DRV_ClearPinOutput(led_red);
GPIO_DRV_ClearPinOutput(led_green);
GPIO_DRV_ClearPinOutput(led_blue);
for(;;){} /* does not return */
}
In that above implementation I’m indicating the end with a visual LED code, because writing the output file with semihosting can take several seconds.
Compiler Settings
Now I have the library for profiling. What is missing are the required project settings. In the GNU ARM Eclipse panels, there is a ‘Generate gprof information (-pg)’ option:
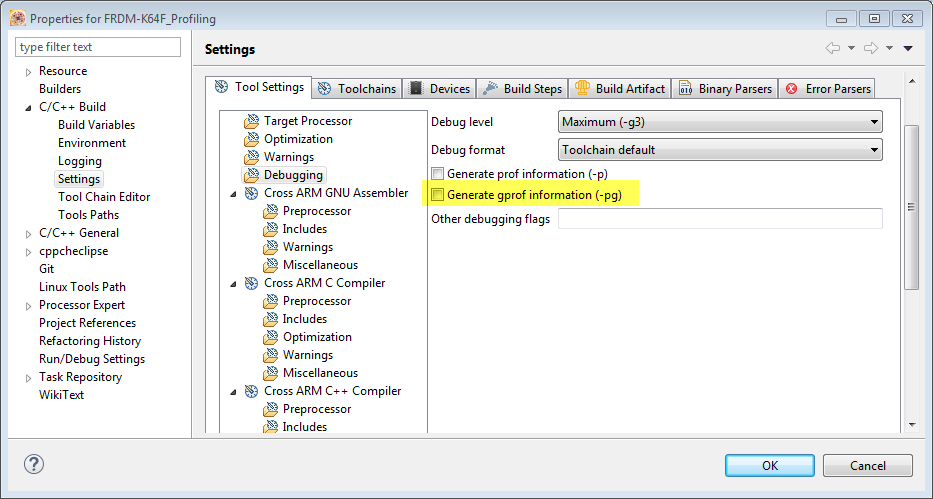
But it will not work that way! This option will be used for all the source files and will be passed to the linker. I do *not* set that option:
- It will instrument all the files which very likely will exceed the RAM size of an embedded target
- It will cause the linker to link with a special version of the C library, compiled with the -pg option too (libc_p.a)
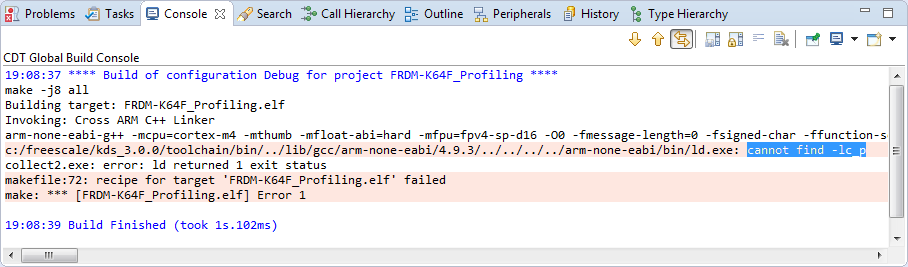
Even if I would have enough RAM, the second point is a problem for the GCC ARM Embedded (launchpad) tools (at least up to version 4.9 2015q2): that GNU gcc distribution does not have that library included 😦 (see this community discussion): the linker will report:
cannot find -lc_p
Instead, I specify the -pg compiler option on a per file/folder base: I only apply it to the files I want to profile (right click on the file/folder to set per-file/folder options):
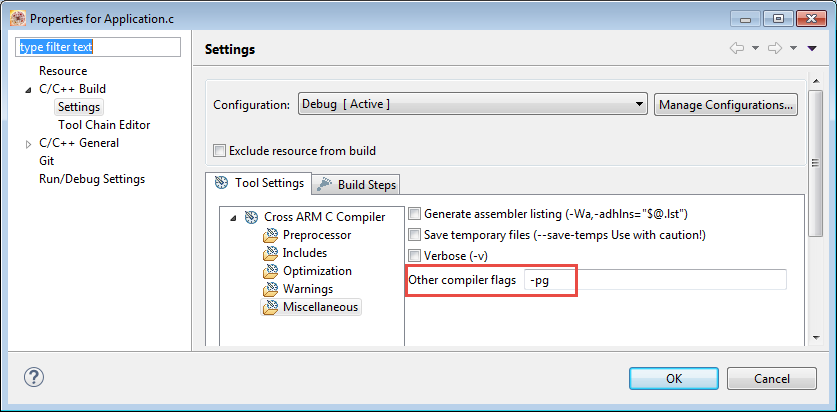
💡 Do *not* instrument (add the option -pg) to the profiling functions itself (file gmon.c), otherwise it will be called in a recursive way causing a stack overflow!
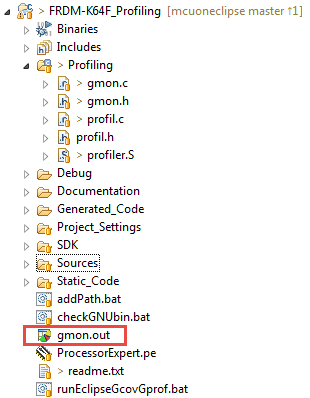
Eclipse will mark the files (see “Icon and Label Decorators in Eclipse“):
Running the program creates the gmon.out on the host through semihosting:
Using Command Line version of prof
The gmon.out result file then gets analyzed with gprof command:
gprof <options> <ELF file> <gmon file>
See https://sourceware.org/binutils/docs/gprof/Invoking.html#Invoking for the command line summary.
To make it easier for me, I have the following addPath.bat DOS batch file which adds the GNU tools path:
@ECHO off
ECHO Adding GNU tools to PATH
SET KDSBIN=C:\Freescale\KDS_3.0.0\bin
SET KDSTOOLBIN=C:\Freescale\KDS_3.0.0\toolchain\bin
ECHO %PATH%|findstr /i /c:"%KDSBIN:"=%">nul || set PATH=%PATH%;%KDSBIN%
ECHO %PATH%|findstr /i /c:"%KDSTOOLBIN:"=%">nul || set PATH=%PATH%;%KDSTOOLBIN%
ECHO %PATH%
The gprof utility can be used like this:
arm-none-eabi-gprof.exe Debug\FRDM-K64F_Profiling.elf gmon.out > gmon.txt
This creates the file gmon.txt with a ‘flat’ profile:
Flat profile: Each sample counts as 0.001 seconds. % cumulative self self total time seconds seconds calls s/call s/call name 94.61 28.92 28.92 1 28.92 29.31 APP_Run 2.31 29.63 0.71 OSA_TimeDiff 1.48 30.08 0.45 OSA_TimeGetMsec 1.17 30.43 0.36 15 0.02 0.02 OSA_TimeDelay 0.29 30.52 0.09 _mcount_internal 0.10 30.55 0.03 15953 0.00 0.00 GPIO_HAL_ReadPinInput 0.05 30.57 0.01 __gnu_mcount_nc 0.00 30.57 0.00 15953 0.00 0.00 GPIO_DRV_ReadPinInput 0.00 30.57 0.00 15 0.00 0.00 CheckButton 0.00 30.57 0.00 15 0.00 0.00 GPIO_DRV_TogglePinOutput 0.00 30.57 0.00 15 0.00 0.00 GPIO_HAL_TogglePinOutput 0.00 30.57 0.00 3 0.00 0.00 CLOCK_SYS_EnablePortClock 0.00 30.57 0.00 3 0.00 0.00 GPIO_DRV_OutputPinInit 0.00 30.57 0.00 3 0.00 0.00 GPIO_DRV_SetPinOutput 0.00 30.57 0.00 3 0.00 0.00 GPIO_HAL_SetPinDir 0.00 30.57 0.00 3 0.00 0.00 GPIO_HAL_SetPinOutput 0.00 30.57 0.00 3 0.00 0.00 GPIO_HAL_WritePinOutput 0.00 30.57 0.00 3 0.00 0.00 PORT_HAL_SetDriveStrengthMode 0.00 30.57 0.00 3 0.00 0.00 PORT_HAL_SetMuxMode 0.00 30.57 0.00 3 0.00 0.00 PORT_HAL_SetOpenDrainCmd 0.00 30.57 0.00 3 0.00 0.00 PORT_HAL_SetSlewRateMode 0.00 30.57 0.00 3 0.00 0.00 SIM_HAL_EnableClock 0.00 30.57 0.00 1 0.00 0.00 CLOCK_HAL_GetClkOutStat 0.00 30.57 0.00 1 0.00 0.00 CLOCK_HAL_GetMcgExternalClkFreq 0.00 30.57 0.00 1 0.00 0.00 CLOCK_HAL_GetOutClk 0.00 30.57 0.00 1 0.00 0.00 CLOCK_HAL_GetOutDiv1 0.00 30.57 0.00 1 0.00 0.00 CLOCK_HAL_GetPll0Clk 0.00 30.57 0.00 1 0.00 0.00 CLOCK_HAL_GetPll0RefFreq 0.00 30.57 0.00 1 0.00 0.00 CLOCK_HAL_TestOscFreq 0.00 30.57 0.00 1 0.00 0.00 CLOCK_SYS_GetCoreClockFreq 0.00 30.57 0.00 1 0.00 0.00 GPIO_DRV_Init 0.00 30.57 0.00 1 0.00 0.00 OSA_Init 0.00 30.57 0.00 1 0.00 0.00 _exit 0.00 30.57 0.00 1 0.00 29.31 main 0.00 30.57 0.00 1 0.00 0.00 task_init % the percentage of the total running time of the time program used by this function. cumulative a running sum of the number of seconds accounted seconds for by this function and those listed above it. self the number of seconds accounted for by this seconds function alone. This is the major sort for this listing. calls the number of times this function was invoked, if this function is profiled, else blank. self the average number of milliseconds spent in this ms/call function per call, if this function is profiled, else blank. total the average number of milliseconds spent in this ms/call function and its descendents per call, if this function is profiled, else blank. name the name of the function. This is the minor sort for this listing. The index shows the location of the function in the gprof listing. If the index is in parenthesis it shows where it would appear in the gprof listing if it were to be printed. Copyright (C) 2012 Free Software Foundation, Inc. Copying and distribution of this file, with or without modification, are permitted in any medium without royalty provided the copyright notice and this notice are preserved. Call graph (explanation follows) granularity: each sample hit covers 4 byte(s) for 0.00% of 30.57 seconds index % time self children called name 28.92 0.39 1/1 main [2] [1] 95.9 28.92 0.39 1 APP_Run [1] 0.36 0.00 15/15 OSA_TimeDelay [6] 0.00 0.03 15/15 CheckButton [10] 0.00 0.00 15/15 GPIO_DRV_TogglePinOutput [12] 0.00 0.00 3/3 GPIO_DRV_SetPinOutput [16] 0.00 0.00 1/1 _exit [106] ----------------------------------------------- 0.00 29.31 1/1 _mainCRTStartup [3] [2] 95.9 0.00 29.31 1 main [2] 28.92 0.39 1/1 APP_Run [1] ----------------------------------------------- &amp;amp;amp;lt;spontaneous&amp;amp;amp;gt; [3] 95.9 0.00 29.31 _mainCRTStartup [3] 0.00 29.31 1/1 main [2] ----------------------------------------------- &amp;amp;amp;lt;spontaneous&amp;amp;amp;gt; [4] 2.3 0.71 0.00 OSA_TimeDiff [4] ----------------------------------------------- &amp;amp;amp;lt;spontaneous&amp;amp;amp;gt; [5] 1.5 0.45 0.00 OSA_TimeGetMsec [5] ----------------------------------------------- 0.36 0.00 15/15 APP_Run [1] [6] 1.2 0.36 0.00 15 OSA_TimeDelay [6] ----------------------------------------------- &amp;amp;amp;lt;spontaneous&amp;amp;amp;gt; [7] 0.3 0.09 0.00 _mcount_internal [7] ----------------------------------------------- 0.00 0.03 15953/15953 CheckButton [10] [8] 0.1 0.00 0.03 15953 GPIO_DRV_ReadPinInput [8] 0.03 0.00 15953/15953 GPIO_HAL_ReadPinInput [9] ----------------------------------------------- 0.03 0.00 15953/15953 GPIO_DRV_ReadPinInput [8] [9] 0.1 0.03 0.00 15953 GPIO_HAL_ReadPinInput [9] ----------------------------------------------- 0.00 0.03 15/15 APP_Run [1] [10] 0.1 0.00 0.03 15 CheckButton [10] 0.00 0.03 15953/15953 GPIO_DRV_ReadPinInput [8] ----------------------------------------------- &amp;amp;amp;lt;spontaneous&amp;amp;amp;gt; [11] 0.0 0.01 0.00 __gnu_mcount_nc [11] ----------------------------------------------- 0.00 0.00 15/15 APP_Run [1] [12] 0.0 0.00 0.00 15 GPIO_DRV_TogglePinOutput [12] 0.00 0.00 15/15 GPIO_HAL_TogglePinOutput [13] ----------------------------------------------- 0.00 0.00 15/15 GPIO_DRV_TogglePinOutput [12] [13] 0.0 0.00 0.00 15 GPIO_HAL_TogglePinOutput [13] ----------------------------------------------- 0.00 0.00 3/3 GPIO_DRV_OutputPinInit [15] [14] 0.0 0.00 0.00 3 CLOCK_SYS_EnablePortClock [14] 0.00 0.00 3/3 SIM_HAL_EnableClock [24] ----------------------------------------------- 0.00 0.00 3/3 GPIO_DRV_Init [33] [15] 0.0 0.00 0.00 3 GPIO_DRV_OutputPinInit [15] 0.00 0.00 3/3 CLOCK_SYS_EnablePortClock [14] 0.00 0.00 3/3 PORT_HAL_SetMuxMode [21] 0.00 0.00 3/3 GPIO_HAL_SetPinDir [17] 0.00 0.00 3/3 GPIO_HAL_WritePinOutput [19] 0.00 0.00 3/3 PORT_HAL_SetSlewRateMode [23] 0.00 0.00 3/3 PORT_HAL_SetDriveStrengthMode [20] 0.00 0.00 3/3 PORT_HAL_SetOpenDrainCmd [22] ----------------------------------------------- 0.00 0.00 3/3 APP_Run [1] [16] 0.0 0.00 0.00 3 GPIO_DRV_SetPinOutput [16] 0.00 0.00 3/3 GPIO_HAL_SetPinOutput [18] ----------------------------------------------- 0.00 0.00 3/3 GPIO_DRV_OutputPinInit [15] [17] 0.0 0.00 0.00 3 GPIO_HAL_SetPinDir [17] ----------------------------------------------- 0.00 0.00 3/3 GPIO_DRV_SetPinOutput [16] [18] 0.0 0.00 0.00 3 GPIO_HAL_SetPinOutput [18] ----------------------------------------------- 0.00 0.00 3/3 GPIO_DRV_OutputPinInit [15] [19] 0.0 0.00 0.00 3 GPIO_HAL_WritePinOutput [19] ----------------------------------------------- 0.00 0.00 3/3 GPIO_DRV_OutputPinInit [15] [20] 0.0 0.00 0.00 3 PORT_HAL_SetDriveStrengthMode [20] ----------------------------------------------- 0.00 0.00 3/3 GPIO_DRV_OutputPinInit [15] [21] 0.0 0.00 0.00 3 PORT_HAL_SetMuxMode [21] ----------------------------------------------- 0.00 0.00 3/3 GPIO_DRV_OutputPinInit [15] [22] 0.0 0.00 0.00 3 PORT_HAL_SetOpenDrainCmd [22] ----------------------------------------------- 0.00 0.00 3/3 GPIO_DRV_OutputPinInit [15] [23] 0.0 0.00 0.00 3 PORT_HAL_SetSlewRateMode [23] ----------------------------------------------- 0.00 0.00 3/3 CLOCK_SYS_EnablePortClock [14] [24] 0.0 0.00 0.00 3 SIM_HAL_EnableClock [24] ----------------------------------------------- 0.00 0.00 1/1 CLOCK_HAL_GetOutClk [27] [25] 0.0 0.00 0.00 1 CLOCK_HAL_GetClkOutStat [25] ----------------------------------------------- 0.00 0.00 1/1 CLOCK_HAL_GetPll0RefFreq [30] [26] 0.0 0.00 0.00 1 CLOCK_HAL_GetMcgExternalClkFreq [26] 0.00 0.00 1/1 CLOCK_HAL_TestOscFreq [31] ----------------------------------------------- 0.00 0.00 1/1 CLOCK_SYS_GetCoreClockFreq [32] [27] 0.0 0.00 0.00 1 CLOCK_HAL_GetOutClk [27] 0.00 0.00 1/1 CLOCK_HAL_GetClkOutStat [25] 0.00 0.00 1/1 CLOCK_HAL_GetPll0Clk [29] ----------------------------------------------- 0.00 0.00 1/1 CLOCK_SYS_GetCoreClockFreq [32] [28] 0.0 0.00 0.00 1 CLOCK_HAL_GetOutDiv1 [28] ----------------------------------------------- 0.00 0.00 1/1 CLOCK_HAL_GetOutClk [27] [29] 0.0 0.00 0.00 1 CLOCK_HAL_GetPll0Clk [29] 0.00 0.00 1/1 CLOCK_HAL_GetPll0RefFreq [30] ----------------------------------------------- 0.00 0.00 1/1 CLOCK_HAL_GetPll0Clk [29] [30] 0.0 0.00 0.00 1 CLOCK_HAL_GetPll0RefFreq [30] 0.00 0.00 1/1 CLOCK_HAL_GetMcgExternalClkFreq [26] ----------------------------------------------- 0.00 0.00 1/1 CLOCK_HAL_GetMcgExternalClkFreq [26] [31] 0.0 0.00 0.00 1 CLOCK_HAL_TestOscFreq [31] ----------------------------------------------- 0.00 0.00 1/1 CLOCK_SYS_GetSystickFreq [42] [32] 0.0 0.00 0.00 1 CLOCK_SYS_GetCoreClockFreq [32] 0.00 0.00 1/1 CLOCK_HAL_GetOutClk [27] 0.00 0.00 1/1 CLOCK_HAL_GetOutDiv1 [28] ----------------------------------------------- 0.00 0.00 1/1 Components_Init [43] [33] 0.0 0.00 0.00 1 GPIO_DRV_Init [33] 0.00 0.00 3/3 GPIO_DRV_OutputPinInit [15] ----------------------------------------------- 0.00 0.00 1/1 PE_low_level_init [55] [34] 0.0 0.00 0.00 1 OSA_Init [34] 0.00 0.00 1/1 task_init [35] ----------------------------------------------- 0.00 0.00 1/1 OSA_Init [34] [35] 0.0 0.00 0.00 1 task_init [35] ----------------------------------------------- 0.00 0.00 1/1 APP_Run [1] [106] 0.0 0.00 0.00 1 _exit [106] ----------------------------------------------- This table describes the call tree of the program, and was sorted by the total amount of time spent in each function and its children. Each entry in this table consists of several lines. The line with the index number at the left hand margin lists the current function. The lines above it list the functions that called this function, and the lines below it list the functions this one called. This line lists: index A unique number given to each element of the table. Index numbers are sorted numerically. The index number is printed next to every function name so it is easier to look up where the function is in the table. % time This is the percentage of the `total' time that was spent in this function and its children. Note that due to different viewpoints, functions excluded by options, etc, these numbers will NOT add up to 100%. self This is the total amount of time spent in this function. children This is the total amount of time propagated into this function by its children. called This is the number of times the function was called. If the function called itself recursively, the number only includes non-recursive calls, and is followed by a `+' and the number of recursive calls. name The name of the current function. The index number is printed after it. If the function is a member of a cycle, the cycle number is printed between the function's name and the index number. For the function's parents, the fields have the following meanings: self This is the amount of time that was propagated directly from the function into this parent. children This is the amount of time that was propagated from the function's children into this parent. called This is the number of times this parent called the function `/' the total number of times the function was called. Recursive calls to the function are not included in the number after the `/'. name This is the name of the parent. The parent's index number is printed after it. If the parent is a member of a cycle, the cycle number is printed between the name and the index number. If the parents of the function cannot be determined, the word `&amp;amp;amp;lt;spontaneous&amp;amp;amp;gt;' is printed in the `name' field, and all the other fields are blank. For the function's children, the fields have the following meanings: self This is the amount of time that was propagated directly from the child into the function. children This is the amount of time that was propagated from the child's children to the function. called This is the number of times the function called this child `/' the total number of times the child was called. Recursive calls by the child are not listed in the number after the `/'. name This is the name of the child. The child's index number is printed after it. If the child is a member of a cycle, the cycle number is printed between the name and the index number. If there are any cycles (circles) in the call graph, there is an entry for the cycle-as-a-whole. This entry shows who called the cycle (as parents) and the members of the cycle (as children.) The `+' recursive calls entry shows the number of function calls that were internal to the cycle, and the calls entry for each member shows, for that member, how many times it was called from other members of the cycle. Copyright (C) 2012 Free Software Foundation, Inc. Copying and distribution of this file, with or without modification, are permitted in any medium without royalty provided the copyright notice and this notice are preserved. Index by function name [1] APP_Run [15] GPIO_DRV_OutputPinInit [5] OSA_TimeGetMsec [25] CLOCK_HAL_GetClkOutStat (fsl_mcg_hal.h) [8] GPIO_DRV_ReadPinInput [20] PORT_HAL_SetDriveStrengthMode (fsl_port_hal.h) [26] CLOCK_HAL_GetMcgExternalClkFreq (fsl_mcg_hal.c) [16] GPIO_DRV_SetPinOutput [21] PORT_HAL_SetMuxMode (fsl_port_hal.h) [27] CLOCK_HAL_GetOutClk [12] GPIO_DRV_TogglePinOutput [22] PORT_HAL_SetOpenDrainCmd (fsl_port_hal.h) [28] CLOCK_HAL_GetOutDiv1 (fsl_sim_hal_mk64f12.h) [9] GPIO_HAL_ReadPinInput (fsl_gpio_hal.h) [23] PORT_HAL_SetSlewRateMode (fsl_port_hal.h) [29] CLOCK_HAL_GetPll0Clk [17] GPIO_HAL_SetPinDir [24] SIM_HAL_EnableClock (fsl_sim_hal_mk64f12.h) [30] CLOCK_HAL_GetPll0RefFreq [18] GPIO_HAL_SetPinOutput (fsl_gpio_hal.h) [11] __gnu_mcount_nc [31] CLOCK_HAL_TestOscFreq [13] GPIO_HAL_TogglePinOutput (fsl_gpio_hal.h) [106] _exit [14] CLOCK_SYS_EnablePortClock [19] GPIO_HAL_WritePinOutput [7] _mcount_internal [32] CLOCK_SYS_GetCoreClockFreq [34] OSA_Init [2] main [10] CheckButton (Application.c) [6] OSA_TimeDelay [35] task_init [33] GPIO_DRV_Init [4] OSA_TimeDiff
Using gprof in Eclipse
The command line version of gprof is powerful. Another way is to use gprof in Eclipse. There is only a subtle problem: gprof and other GNU tools need to be present in the PATH, *without* the architecture (arm-none-eabi) prefix.
💡 Both gcov (see “Code Coverage with gcov, launchpad tools and Eclipse Kinetis Design Studio V3.0.0“) and gprof need to have the tools in the PATH that way.
To keep toolchains and Eclipse IDE’s separate, I’m reluctant to modify the Windows PATH globally as this affects *everything*. And using a non-matching gprof with a different GNU toolchain (mixing GNU versions) can have strange effects.
Instead, I have a special batch file which
- Configures the PATH locally in a CMD shell (addPath.bat)
- Ensures that the necessary GNU tools without arm-none-eabi name are present (checkGNUbin.bat)
- Launches Eclipse from the environment (runEclipseGcovGprof.bat)
addPath.bat has the following content:
@ECHO off ECHO Adding GNU tools to PATH SET KDSBIN=C:\Freescale\KDS_3.0.0\bin SET KDSTOOLBIN=C:\Freescale\KDS_3.0.0\toolchain\bin ECHO %PATH%|findstr /i /c:"%KDSBIN:"=%"&amp;amp;amp;gt;nul || set PATH=%PATH%;%KDSBIN% ECHO %PATH%|findstr /i /c:"%KDSTOOLBIN:"=%"&amp;amp;amp;gt;nul || set PATH=%PATH%;%KDSTOOLBIN% ECHO %PATH%
checkGNUbin.bat has the following content:
@ECHO OFF
ECHO Checking GNU Binaries and making copies as necessary
SET KDS3=C:\Freescale\KDS_3.0.0
IF NOT EXIST "%KDS3%\toolchain\bin\gcov.exe" COPY "%KDS3%\toolchain\bin\arm-none-eabi-gcov.exe" "%KDS3%\toolchain\bin\gcov.exe"
IF NOT EXIST "%KDS3%\toolchain\bin\addr2line.exe" COPY "%KDS3%\toolchain\bin\arm-none-eabi-addr2line.exe" "%KDS3%\toolchain\bin\addr2line.exe"
IF NOT EXIST "%KDS3%\toolchain\bin\nm.exe" COPY "%KDS3%\toolchain\bin\arm-none-eabi-nm.exe" "%KDS3%\toolchain\bin\nm.exe"
IF NOT EXIST "%KDS3%\toolchain\bin\c++filt.exe" COPY "%KDS3%\toolchain\bin\arm-none-eabi-c++filt.exe" "%KDS3%\toolchain\bin\c++filt.exe"
IF NOT EXIST "%KDS3%\toolchain\bin\strings.exe" COPY "%KDS3%\toolchain\bin\arm-none-eabi-strings.exe" "%KDS3%\toolchain\bin\strings.exe"
IF NOT EXIST "%KDS3%\toolchain\bin\gdb.exe" COPY "%KDS3%\toolchain\bin\arm-none-eabi-gdb.exe" "%KDS3%\toolchain\bin\gdb.exe"
IF NOT EXIST "%KDS3%\toolchain\bin\gprof.exe" COPY "%KDS3%\toolchain\bin\arm-none-eabi-gprof.exe" "%KDS3%\toolchain\bin\gprof.exe"
ECHO Done!
And here is the content of runEclipseGcovGprof.bat:
REM Run Eclipse with gcov environment

REM Check that path setup is correct
call addPath.bat

REM Check that GNU tools are present
call checkGNUbin.bat

REM launch Eclipse
C:\Freescale\KDS_3.0.0\eclipse\kinetis-design-studio.exe
With an Eclipse launched like this, I can double click on the .out file in Eclipse and it will ask me for the .elf file to be used with that gmon.out file:
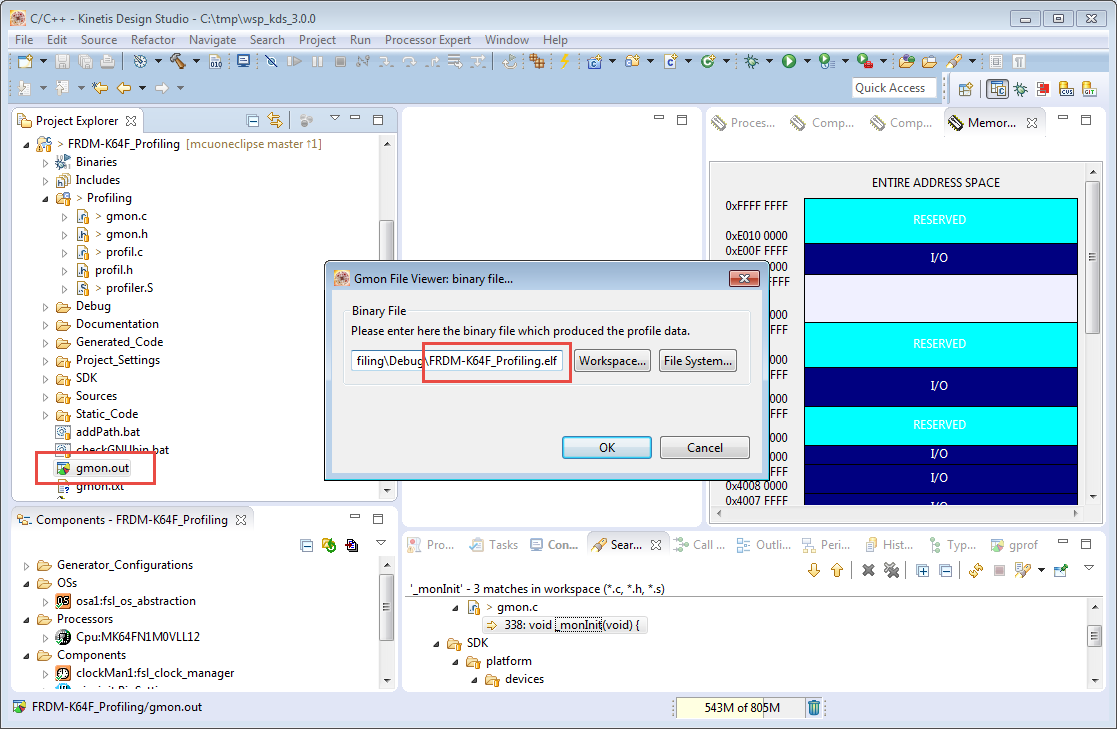
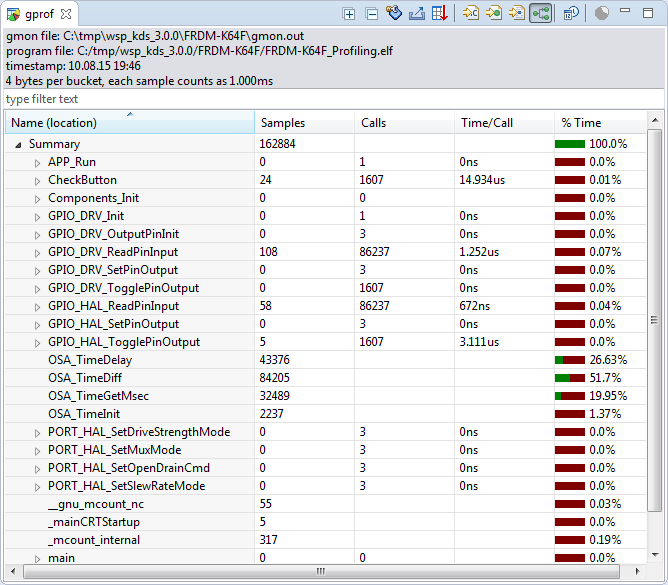
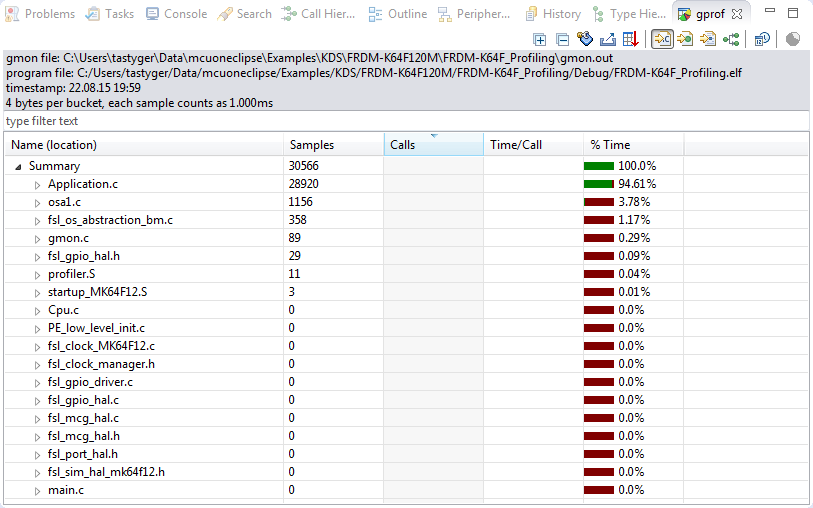
This then will open a nice graphical view (sorted by file):
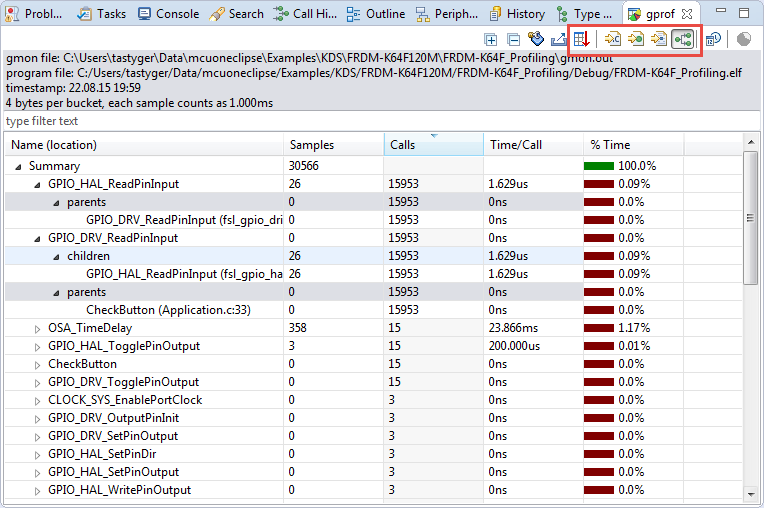
I have different ways of sorting, for example I can sort it by function calls:
The columns show the collected information:
- Samples: How many times it has been sampled (PC histogram).
- Calls: how many calls to that function has been counted.
- Time/Call: average time per call.
- % Time: Percentage of time spent. The sum of all profiled functions are summed up to 100%.
As I can see from above example screenshot: I’m using a sample frequency of 1 kHz (“each sample counts as 1.000 ms” written in the header). GPIO_HAL_ReadPinInput() has been sampled 26 times, but has been called 15953 times. That function has been called from his parent function GPIO_DRV_readPinInput(), but because the parent is a very small/short function, it has been never sampled (Samples count zero).
So this shows that short functions might not be sampled. Basically I have a good chance to sample functions which take longer than the PC sampling period (in my case here 1 ms). So the sampling time is statistical and should be read with care. But the number of calls are counted in an exact way.
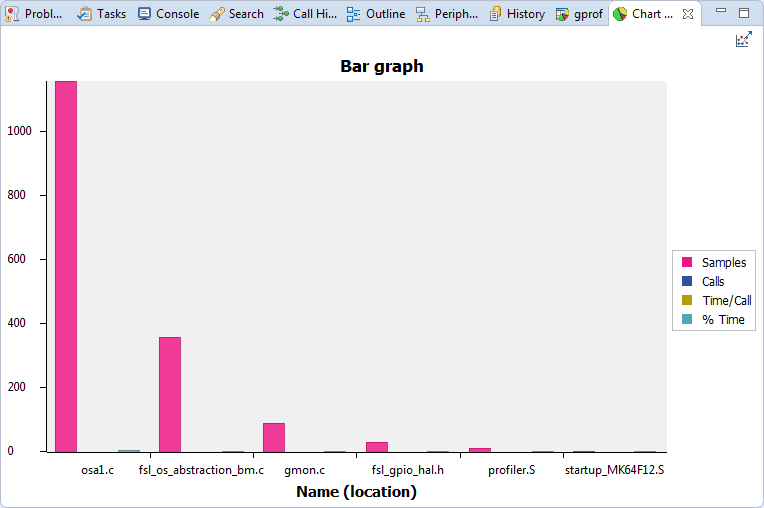
The gprof Eclipse view can visualize the data in multiple way, e.g. producing graphs and charts: select lines in the table view of gprof and use the ‘Create chart…’ button:
Summary
Using gprof to profile an application gives useful information about where the application spends most of the time. It is important to understand how gprof works to correctly use the data generated. Using gprof requires a considerable amount of RAM which needs to be taken into account during the design. Understanding the way how gprof works helps to read the data and helps to find the ‘hot spots’ and to optimize the application. Gprof is more targeted to host or embedded Linux applications where lots of RAM is available. But as I can instrument parts of the application and with the help of semihosting, it is very applicable to embedded targets having at a few kByte of RAM available for this kind of thing. And gathering this kind of information is always better than not knowing anything ;-).
The GCC ARM Embedded toolchain does not come with gprof enabled libraries. I have solved the problem with providing my own profiling implementation and libraries, inspired by the i386 cygwin libraries present in the GCC ARM Embedded libraries source files.
The project and source files discussed in this article can be found on GitHub: https://github.com/ErichStyger/mcuoneclipse/tree/master/Examples/KDS/FRDM-K64F120M/FRDM-K64F_Profiling
I’m going to present this research and approach at the Embedded Computing Conference 2015.
Happy Profiling 🙂
Links
- GNU gprof: https://sourceware.org/binutils/docs/gprof/
- GCC ARM Embedded toolchain: https://launchpad.net/gcc-arm-embedded
- GCC ARM Embedded Community discussion about GNU profiling: https://answers.launchpad.net/gcc-arm-embedded/+question/249429
- Sourcery G++ dummy profiling function: http://doc.ironwoodlabs.com/arm-arm-none-eabi/html/getting-started/arm-mcount.html
- Related article, but showing how to generate coverage with gcov: Code Coverage with gcov, launchpad tools and Eclipse Kinetis Design Studio V3.0.0

Amazing post! Thanks a lot!
LikeLike
I hate being a wet blanket, but somebody’s gotta do it. This is all great if you like gprof.
There’s another view, the second answer on this post: https://archive.is/9r927
The reason most people do profiling is not just because they want measurements, it is because they want to speed up the code. gprof claims to get some measurements; it never claimed to find speedups. For some reason it is widely assumed measuring and finding are the same thing. The result is that huge speedups go undiscovered, because profiling fails to find them. That link goes into great detail.
LikeLike
Yes, you are absolutely right. Gprof can assist with finding some speedups, but it does not mean it will find it. I value most the function call counting (because accurate). In combination with the sampling, it gives one picture (not necessarily the full truth one) of the application. Gprof tells me what gets called the most (so that’s an obvious thing to look at), plus gives me with the sampling somewhat of an idea.
Thanks for sharing that link: I knew I had read that one, but did not capture that discussion link in StackOverflow.
I have seen several mentions to valgrind during my research, but have not used it. Anyone using it for a bare embedded environment?
LikeLike
Ages ago, I worked on an embedded system (Intel 8080-8088 board). Hardware guys offered to put in a time-counter chip to help me find speedups. Thanks, but that’s not how I do it. I would run it under an In-Circuit-Emulator (Intel “blue box”). It was annoyingly slow while painting numbers on a screen. I did about 5 stackshots. They showed a lot of time going into the floating-point math library (pre-floating-point-chips). That was no surprise, it was a numerical app. However, the stackshots pinpointed the reason why. It was converting floating point numbers into numeric characters by dividing/multiplying/flooring/subtracting so they could be painted on-screen. Knowing that, the fix was simple – first convert to integers and use those. I’ve found many, many speedups this way over the last 40 years. Is it crude? Of course, but here’s my assertion: it will find any speedups profilers will find, plus plenty that they won’t.
LikeLike
I have seen many of these things (using floating point and not integral arithmetic) too. What I have seen in the past helping too was doing good and diligent code reviews. It won’t uncover things done by the compiler, but just the fact having someone else to look at the code can help a lot too.
LikeLike
Yeah, Its technical but, that’s how I like it 😛 . Thanks for sharing.
LikeLike
Hi,
great post, like all you others!
One thing I already struggle with it the question if the P&E JTAG interface built on a TWR-K21D50M supports “full semihosting including file I/O”. I tried to find information on it, but can’t find anything related.
Thank you in advance!
Best Regards
Michael
LikeLike
Hi Michael,
as of today, P&E seems only to support semihosting for UART (printf/scanf() kind of things), and *not* for file I/O (fopen(), etc).
So using GNU profiling with the way I presented in this post (which is using semihosting with file I/O) does not work with the P&E semihosting implementation.
I had to use the Segger J-Link connection.
I hope this helps,
Erich
LikeLike
Pingback: A Raspberry Pi for $5! What are your decision factors? | MCU on Eclipse
did you try to use
-finstrument-functions-exclude-function-list=sym,sym,…
to disable profiling for specific functions?
https://gcc.gnu.org/onlinedocs/gcc/Instrumentation-Options.html
LikeLike
Hi Peter,
no, I have not tried that, but sounds interesting. Have you used it sucessfully?
Erich
LikeLike
no, not yet.
my test setup is not ready 😦
if I do, I will report back.
LikeLike
If you would like to exclude a specific function and do it from within the source code instead of a linker argument, define the function with this attribute (works for gcc arm)
uint32_t __attribute__ ((no_instrument_function)) SomeFunc(uint32_t val)
LikeLike
Hi Alfonso,
thanks for the tip!
Erich
LikeLike
Hello!
Your article is a great deal!
But I have some difficulties trying to apply it with Eclipse. It would be great if you can help me.
I have copied yours Profile library, those .bat files and have added ‘-pg’ flag for main.c. Somehow profilr.S failed to compile. So I did it manually via command line and then added profiler.o to my project. Despite all this, there is still an error ” undefined reference to `__gnu_mcount_nc’ ”
What am I missing?
LikeLike
Hi Alena,
I’m actually using it with Eclipse, and the latest project is on Git (https://github.com/ErichStyger/mcuoneclipse/tree/master/Examples/KDS/FRDM-K64F120M/FRDM-K64F_Profiling).
__gnu_mcount_nc is defined in profiler.S. So if your linker does not find it, are you sure you are linking the file with your application? Keep in mind that for the GNU assembler in Eclipse the file really has to use *.S (and not *.s), see https://mcuoneclipse.com/2016/05/05/assembly-files-in-eclipse-cdt-projects/
LikeLike
You’re right. I am new to Eclipse, so I haven’t configured it correctly to compile profiling folder ><
LikeLike
Hi Alena,
ah, thanks for closing the loop on this. Indeed, you have to compile/include the needed profiler files, otherwise it won’t work 🙂
LikeLike
Hi Alena, you might find this interesting: http://stackoverflow.com/a/25870103/23771
LikeLike
Oops, i’v found my fault 🙂
LikeLike
Can you share what it was?
LikeLike
I hate to bother you again, but I have another problem with this library and this time it’s obviously not a problem of eclipse settings 🙂 And again I have no idea of solving this.
Everything goes well untill the end of program when the _mcleanup function is to be executed. There occures an infinite loop >froms[fromindex]; toindex != 0; toindex = p->tos[toindex].link) {…}
It never ends. Why can that happen?
LikeLike
Hi Alena,
hard to say what is wrong. It might not be an endless loop, as depending on your connection (semihosting?) it can take many minutes to store the information. I have seen semihosting implementations being able to send only a few bytes per second.
Ir recommend that you profile only a very small portion of your application first to see if things are workign properly.
Erich
LikeLike
Actually I try to profile only main.c of a standart blinky led sample 🙂 It blinks 5 times and writes smth. like “Hello, arm! 1,2,3,4,5” to the output. I have been waiting for about half an hour (may be more) and nothing has changed. There is every reason to believe that this is still an infinite loop, rather than a very, very slow execution 🙂
LikeLike
Hi Alena,
ok, that *could* be an infinite loop. Can you try it with just blinking and no “hello” writing at all?
Erich
LikeLike
Done. Still the same. Actually “toindex” variable changes only on the first iteration of the loop.
The only thing I had changed in your library is SysTickHandler — I had to add several lines from SysTickHandler of Blinky led so it could blink:
#if defined(USE_HAL_DRIVER)
HAL_IncTick();
#endif
timer_tick ()
May be that is a big mistake?
LikeLike
Hi Alena,
I don’t see why this could cause any problems. To be sure, simply disable it. The point is to reduce the problem as much as possible. Without actually debugging your code, is is very hard to find the problem. A few tips: make sure you have enough stack space allocated, just to be sure there is no stack overflow. Another problem could be your version of gcc and ARM libraries. If you can, try my code with an NXP K64F board and using the the Kinetis Design Studio: that way you have a working reference project you can compare with.
I hope this helps,
Erich
LikeLike
Thanks for your advices 🙂
I can’t try KDS with your sample as I use stm32f407 board, and KDS doesn’t support it.
About stack overflow — my board don’t have any limitation mechanisms so the worst thing may happen — stack will overwrite heap or any variables. In this case a HardFault may occur or the program will continue working useing changed variable values. As a consequence, there may occur an infinite loop or any other unpredictible behavior.
So I’ll have to make some research %) Thanks
LikeLike
Hello! That’s me again.
Could you please help me with several questions about your library?)
While initializing monstartup() function uses lowpc and highpc argumets. As I have understood — these arguments should be PC of the beginning of a piece of code we gonna debug and PC of end of this code. Then why are they hardcoded as 0x410 and_etext? Becouse of this fake_sbrk() thies to allocate A LOT OF memory — my board doesn’t have so much 🙂
0x410 looks like a magic number. As I’v understood, _etext, indicates end of ALL code, not only the end of a piece I want to profile.
LikeLike
Hi Alena,
0x410 is at/after where on Kinetis there is the FLASH configuration area. From this perspective, it is a magic number, and I only started from there to save some RAM. Be free to change the memory range for profiling.
LikeLike
Pingback: Adding GNU Coverage Tools to Eclipse | MCU on Eclipse
Pingback: GNU Code Coverage on Embedded Target with Eclipse Neon and ARM gcc 5 | MCU on Eclipse
I’ve been up and down on this for a week now. My first problem was that the semihosting in OpenOCD can’t do file IO. Oh, it says that it can but it doesn’t work. Maybe it has something to do with using nanolib or not, I ran into the stupid w_char size issue and abandoned that. It turned out to be easier to dump the memory location of the profiling structs using gdb, and generate the gmon file using host-side code (adjusting for 64-bit host vs 32-bit target). But even after that, I see that gprof correctly constructs a symbol table and knows the addresses of everything, yet there are just way too many tags in the output. Why can’t it properly find the parent? I thought it might have something to do with the way the PC always points some bytes past the present execution point (seems the compiler pretty much picks a number here), but there appears to be no proper consistency. It just doesn’t work properly. My own debug output indicates clearly how the call is made, disassembly shows that it to be in the right location, but gprof can’t find it… pffft. Seriously thinking of just abandoning this…
LikeLike
I recommend to drop OpenOCD for this. Semihosting worked for me only in an very old (0.6.0?) version and seems to be broken since then, at least I was not able to get it working. And at that time it was terrible slow (few characters per second) and did not support file I/O at all. So what I recommend is to use a decent debugging interface like the Segger J-Link which a) is fast and b) it works. And with the J-Link EDU Mini at the price point of $20 openOcD is dead for me now.
LikeLike
When i build, gmon.c errors “undefined reference to __exect”
LikeLike
What toolchain/GCC version are you using? And which library (newlib? newlib-nano). It sounds like you are missing some low level library routines.
LikeLike
Hi, I too get the same error undefined reference to __exect”. i uses True Studio and newlib-nano library .
LikeLike
The problem is with the library delivered with TrueStudio: it has not been compiled/provided with the correct options.You can rebuild the libraries (see https://mcuoneclipse.com/2014/08/23/gnu-libs-with-debug-information-rebuilding-the-gnu-arm-libraries/) or you have to get new fixed libraries from STM.
LikeLike
I always get failure if calling _mcount_internal at __gnu_mcount_nc, I run the code at NXP MK22F25612.
LikeLike
What kind of failure?
LikeLike
Not sure, looks like a reset occurs. If removing the line “bl _mcount_internal” from __gnu_mcount_nc(), no such reset. If replacing “bl _mcount_internal” with “bl gpio_init”, still get the failure. So, can’t call any functions at __gnu_mcount_nc()?
LikeLike
Are you using my files or something differnt? You have to step with the debugger through that call to see what is going on. I think you are causing somehow a hard fault. Do you have a hard fault handler installed (https://mcuoneclipse.com/2012/11/24/debugging-hard-faults-on-arm-cortex-m/, https://mcuoneclipse.com/2012/12/28/a-processor-expert-component-to-help-with-hard-faults/ or https://mcuoneclipse.com/2017/01/13/debugging-arm-cortex-m0-hardfaults/)?
LikeLike
Due to memory problem, i am unable to use proceed, is there a way to send these data in serial without storing them in memory
LikeLike
To my knowledge this is not possible with gprof, because you have to have some tables in memory.
What you could do is
a) only do gprof on part of the application, and run your tests multiple times and then combine the data
b) use Segger Systemview where you can measure execution time of code sequences (https://mcuoneclipse.com/2015/11/16/segger-systemview-realtime-analysis-and-visualization-for-freertos/).
I hope this helps,
Erich
LikeLike
Hello,
Thanks for the clear info.
I tried the code but I get
“monstartup: out of memory” error
I increased the heap to 0x1c00 but I am still getting the same problem
How to over come this Problem?
also I am using printf to send data over vcomport und I get the answer over VCOM port and not in debug consol
Best Regards
Hossam Alzomor
LikeLike
Hi Hossam,
never seen that message. Can you try with instrumenting a very small file, and not the application. Just do it for a single function to see if that works.
LikeLike
Hello,
I’m no expert but something puzzles me about the “Memory Requirements for Arcs and Histogram”. I don’t quite get what you store in the “froms” and “tos” arrays.
Assuming my program has N functions, an upperbound on the number of arcs is N^2. That is to say, I need a counter for every *couple* of functions. How can you store that many values in froms and tos (whose total dimension is < 2*N ? ).
It's more of a curiosity than a techincal issue for me, but I can't get my head around it 🙂
Anyways, thanks for posting that and explicitly showing how to configure the whole thing – very helpful to "non-experts" like me 😉
Thanks in advance
Federico
LikeLike
Hi Federico,
there is no need to store every possible call, it will record only the ones which are executed in the table. The from[] basically maps the from source locations, divided by a factor (e.g. 2 if you only even addresses can do a call, but this can be even reduced further if you are ok to have less function calls by the hashfraction. The to[] array is a hash table with overflow linkage too. That tos[] array grows while executing it, and has an upper limit with the number of possible destination addresses.
LikeLike
Hi Erich
I tried to run profiling in a STM32F302. All worked fiend but when I generate a gmou.txt with gprof the the PC sampling histogram does not work.
I think that this function is the problem pc = ((uint32_t*)(__builtin_frame_address(1)))[14]; when SysTick_Handler function is called, the value of pc is so big.
I got the backtrace:
(gdb) bt
#0 SysTick_Handler () at profiling/profil.c:34
#1
#2 HAL_Delay (Delay=) at Drivers/STM32F3xx_HAL_Driver/Src/stm32f3xx_hal.c:366
#3 0x00000000 in ?? ()
Maybe the problem is that the previous function is .
Thanks a lot.
LikeLike
Can you check if the PC is within (pc >= prof.lowpc && pc < prof.highpc)? If not, can you extend the range passed by monstartup()?
LikeLike
These are the values:
pc = 0x3afe74f0
lowpc = 0x8000000
highpc = 0x8004294
So, pc is not within pc >= prof.lowpc && pc < prof.highpc.
These is the frame:
(gdb) info frame
Stack level 0, frame at 0x20003f78:
pc = 0x8002d8a in SysTick_Handler (profiling/profil.c:34); saved pc = 0xffffffe9
called by frame at 0x20003f98
source language c.
Arglist at 0x20003f68, args:
Locals at 0x20003f68, Previous frame's sp is 0x20003f78
Saved registers:
r4 at 0x20003f68, r5 at 0x20003f6c, r7 at 0x20003f70, lr at 0x20003f74
I don't know why pc has that value.
Thanks.
LikeLike
So it seems it is not getting the correct PC inside that tick interrupt handler (assuming that you don’t have any code at 0x3afe74f0?).
I would check from where this 0x3afe74f0 is coming from the stack, or does it make any sense?
The other thing: as this is on the MSP (main stack pointer) for the interrupts: do you have plenty of RAM allocated for the MSP stack? Or could it be some artefact from a stack overflow?
LikeLike
Is there a standard implementation for the profiling library?
I wonder how there’s a profiler for embedded systems like arm-none-eabi-gprof but without standard library available!
LikeLike
To my knowledge, there is no such thing, but I’m aware of a university project trying to exactly this. I have started with such a library but never finished it due lack of time.
The other point to mention is: gprof is really independent of the target: all it does is consuming the data produced, and is not depending at all of the system producing the data.
The prefix arm-none-eabi- is just the way how GNU tools are built for a target and OS.
LikeLike
In your __gnu_mcount_nc() implementation, you say you return to the caller function by branching to the memory address stored in ip. Wouldn’t you want to branch to the callee function and not the caller function? __gnu_mcount_nc() is used as a hook function to intercept the function call between caller and callee so wouldn’t you want to branch to callee since that is where the program intended to go next?
Also if I’m not mistaken, doesn’t ip contain the callee address? So that would mean the code for __gnu_mcount_nc() is correct, it is just the comment above that branch instruction that is throwing me for a loop. Please let me know if this makes sense to you or if there is something I am missing.
Thanks so much for your hard work. I am looking forward to trying this out.
LikeLike
So here is what I uncovered. The -pg compiler flag inserts the following two instructions at every call arc:
push {lr}
bl __gnu_mcount_nc
Because of this, I believe the stack appears as such within the __gnu_mcount_nc function.
Stack information
r0 <– new top of stack top of stack
r1
r2
r3
lr (callee addr.)
lr (caller addr.) <– first lr push, initial top of stack
Is my thinking correct? Back to my initial question, doesn't it branch to the callee function and not the caller function at the end of __gnu_mcount_nc? Doesn't ip contain the callee address? Thanks so much for your help and your hard work in this space.
LikeLiked by 1 person
Hi Juan,
yes, this is correct. And yes, it returns to the callee (the one called by the original function). I believe I wrote ‘caller’ because it would be the ‘caller of the __gnu_mount_nc, so this would be correct for that case, but incorrect from the application point of view. Thanks for catching this!
LikeLike
Hi Juan,
I appologize for the very late reply (that COVID-19 is causing a lot of extra work).
Indeed, thanks for catching this: the comment is wrong, it really should say ‘callee’ from the user application point of view, and to be consistent.
I have fixed the comment in the article and on GitHub: https://github.com/ErichStyger/mcuoneclipse/commit/2d79220aec3763b9f7de729d8e2a2446fb6d7200
LikeLike
Hi Erich,
I am trying to profile on ARM Cortex A53 (https://en.wikipedia.org/wiki/ARM_Cortex-A53). Will your code work for this processor? Talking about gmon.c, profiles.S, etc. Or do I need to rewrite some parts? Any help most appreciated.
LikeLiked by 1 person
Yes, you will need to rewrite at least __gnu_mcount_nc
LikeLike
Another question… I was able to profile code for some Tensilica processors some time ago, but I did not need any hardware board to be connected. I just generated the code for the target, and ran it in Eclipse or in command line. This produced gmon.out, and then I just used grpof on the command line to generate a report.
Why is this not possible with ARM, why is a board required?
LikeLiked by 1 person
Then I would say you used a simulator or you were not actually running it on the hardware itself, but on the host PC. So not running Tensilica code at all.
LikeLike
First of all thanks for the research on this, it is such a nice tool for embedded developers ! About the question from the OP. I tried this with xPack Qemu ARM and I could profile the my application running on my PC which emulated the cortex-m4 cpu on a generic stm32 board. I will later test this against the hardware setup to see the differences but so far at least the call count is correct 😉
LikeLiked by 1 person
Is that QEMU version able to simulate all your peripherals too?
LikeLike
As my requirements are more of doing unit tests for the application side, I have mocked some of the peripherals. But from what I have seen so far there is no Flash Emulation and MPU.
LikeLike
Pingback: MCUXpresso IDE V11.3.0 for 2021 | MCU on Eclipse
Hi Erich !
Thank you so much for this article !
I have a question about retrieving the previous value of PC in profile.c. :
“`
pc = ((uint32_t*)(__builtin_frame_address(0)))[14]; /* get SP and use it to get the return address from stack */
“`
For me the return address value would be at 7 (value present in the stack during context switch are (R1to R3, R12, R14, last PC and PSR) but here is 14 and I don’t really understand why. Is this due to another function call ? If I try to retrieve the LR value to know whether I was running on Handler or Thread mode which one should I considered ? (6 or 13)
Best Regards,
Clara
LikeLiked by 1 person
Hi Clara,
there might be a difference if you are not using the GNU gcc with the defined ARM EABI?
If you are using something different, then you would have to update/change the offset values.
LikeLike
Thanks for the reply ! I’m also using ARM EABI on a STM32 board with a Cortex-M4. What made you choose 14 as offset ?
LikeLike
And also, why shouldn’t I increase the sampling frequency over 1kHz ? How can I make it 10kHz? I have some functions that go under 1ms and might never be sampled 😦
LikeLike
You can go as high as you want. But keep in mind that this adds overhead, so depending on your target speed this will or will not work for you.
LikeLike
Just one thing to consider: gprof is a *statistical* sampling, and it is very ok that small functions under 1 ms do not get counted. With gprof you want to get the *big* picture, not the nitty-gritty details. If you want to really cover these small functions, you need to use a full hardware trace: statistical sample won’t help you much for tiny things.
LikeLike
I don’t know if my previous answer to this comment was actually recorded.
When the goal is to find ways to speed up any software (which it usually is) I take a really dim view of profilers in general, especially gprof. (Read the doc. It was never intended for that.)
I get tired of explaining why. See this link: https://stackoverflow.com/a/25870103/23771
LikeLiked by 1 person
I simply looked at the stack frames generated by the compiler and determined the correct offsets for it. If your compiler does things differently, then you simply can change this as needed.
LikeLike